 Title: Emerging applications of stimulated Raman scattering microscopy for medicinal chemistry and drug discoveryDOI: 10.1039/d5cs00748h.Date: 2025.10.27 (For PDF access and group discussions, see the end of the article)
This article is a review that systematically summarizes the emerging applications of stimulated Raman scattering microscopy (SRS microscopy) in medicinal chemistry and drug discovery.
🧪 Core Content Summary:
1. Background and Motivation
-
The high failure rate in drug development (especially for cancer drugs, with a failure rate >95%) is partly due to the lack of reliable early preclinical assessment tools.
-
There is a need for label-free, high-resolution, real-time imaging technologies to observe drug behavior within cells, and SRS microscopy is an emerging tool that meets these needs.
2. Introduction to SRS Microscopy Technology
-
SRS is a nonlinear optical imaging technique based on Raman scattering, which can obtain chemical information of molecules without fluorescent labeling.
-
Advantages:
-
Label-free, non-invasive
-
High spatial resolution (up to 130 nm)
-
Real-time imaging of live cells and tissues
-
Can be combined with other imaging methods such as fluorescence and mass spectrometry
3. Applications of SRS in Drug Discovery
The article details the applications of SRS in the following areas:
🔬 (1) Imaging and Localization of Drugs within Cells
-
Label-free imaging: Distribution of tyrosine kinase inhibitors (TKIs) in cancer cells.
-
Tagged imaging: Achieving high-sensitivity tracking by introducing “bioorthogonal” Raman tags such as alkyne and deuterated groups into the drugs.
-
Drug-organelle interactions: For example, the accumulation of drugs in organelles such as lysosomes and endoplasmic reticulum.
🧬 (2) Drug Metabolism and Cellular Response
-
Using “isotope labeling (e.g., D₂O, deuterated fatty acids, deuterated amino acids)” to track the impact of drugs on cellular metabolism.
-
Studying abnormal lipid metabolism in cancer cells (e.g., cholesterol ester accumulation), changes in protein synthesis, etc.
-
Assessing the effects of drugs on cellular growth, apoptosis, lipid synthesis, and other metabolic pathways.
🧫 (3) Rapid Detection of Antimicrobial Drug Sensitivity (AST)
-
Using SRS combined with D₂O or deuterated glucose to quickly determine antibiotic sensitivity at the single bacterial level (30 minutes to 2 hours), much faster than traditional methods (24 to 48 hours).
-
Applicable for bacterial drug sensitivity testing in clinical samples such as blood and urine.
🧴 (4) Skin Drug Delivery and Transdermal Absorption Studies
-
Label-free imaging of drug penetration pathways and concentration distribution in skin, nails, and other tissues.
-
Studying the diffusion behavior of drugs with excipients (e.g., DMSO, propylene glycol) in the skin.
-
Can be used to evaluate the impact of different formulations (gels, solutions, nanocarriers) on drug permeability.
💊 (5) Drug Formulation Analysis
-
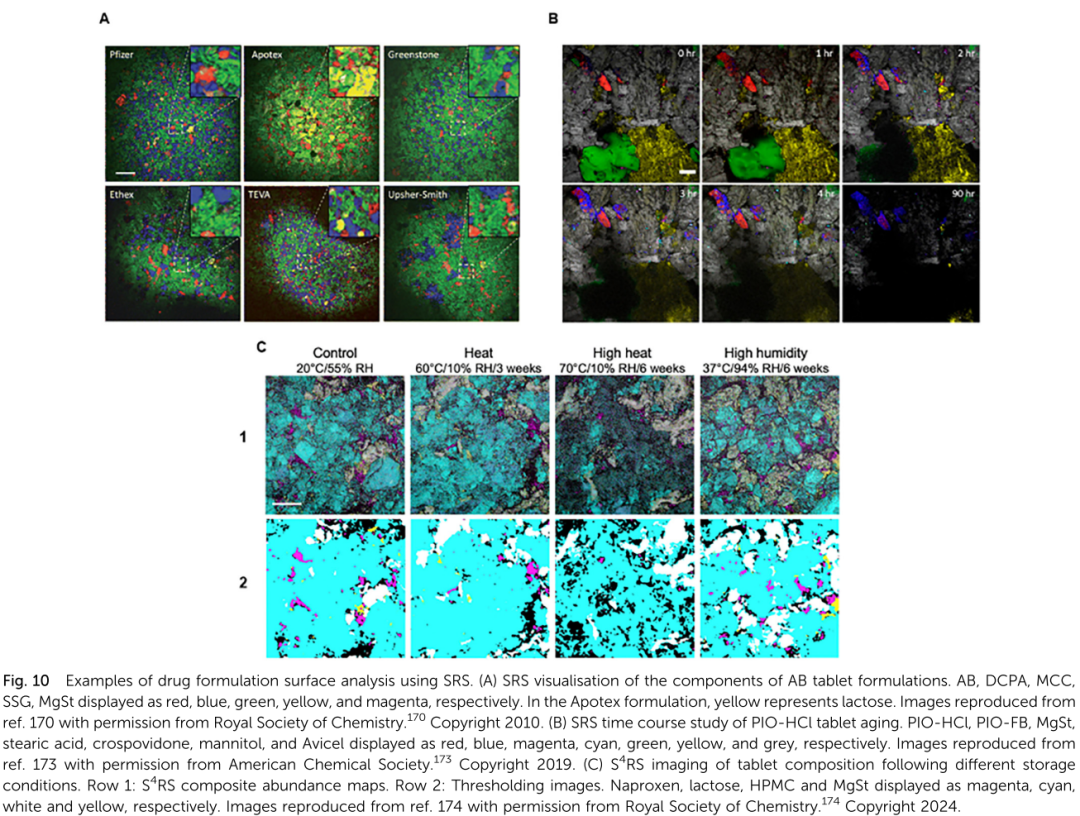
Imaging the distribution of APIs and excipients in drug tablets.
-
Monitoring changes in drug polymorphs, salt form conversion (e.g., salting out), and tablet aging processes.
-
Assessing drug release behavior in controlled-release implants.
4. Trends in Technology Development
-
Hyperspectral SRS: Obtaining complete Raman spectra for each pixel, enabling simultaneous imaging of multiple components.
-
Machine Learning and Chemometrics: Used for data analysis, image segmentation, and feature extraction.
-
Super-resolution SRS: Breaking the optical diffraction limit to achieve nanoscale imaging.
-
Multimodal Fusion: Combining with fluorescence, mass spectrometry, photoacoustic, and other technologies to enhance information dimensions.
✅ Summary in One Sentence:
This review systematically elaborates on how SRS microscopy, as a label-free, high-sensitivity, real-time imaging technology, plays a crucial role in multiple key aspects of drug discovery (drug distribution, metabolism, toxicity, antimicrobial sensitivity, skin penetration, formulation analysis), and looks forward to its broad prospects in precision medicine and drug development.
Stimulated Raman Scattering Microscopy
Overview of Stimulated Raman Scattering Microscopy
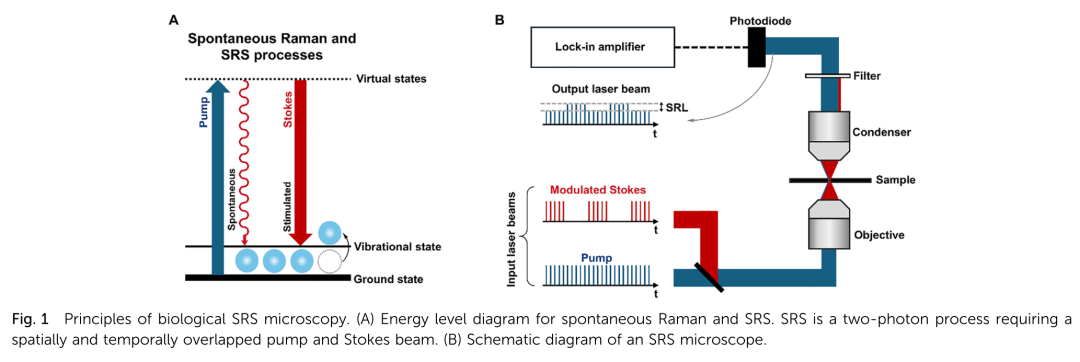
This section provides a systematic overview of the basic principles, signal generation and detection methods of SRS microscopy, as well as its advantages over spontaneous Raman scattering. Key points are as follows:
-
Basic Principles
-
SRS belongs to coherent Raman scattering, using two laser beams (pump light ω_p and Stokes light ω_S) to simultaneously illuminate the sample.
-
When the frequency difference Δω = ω_p – ω_S equals the vibrational transition frequency Ω of a molecule, stimulated excitation occurs, and the molecule transitions from the ground state to the excited state.
-
This process is accompanied by “stimulated Raman loss” (SRL, decrease in pump light intensity) and “stimulated Raman gain” (SRG, increase in Stokes light intensity).
Signal Detection
-
SRL/SRG signals manifest as small changes in laser beam intensity (ΔI/I ≈ 10⁻³–10⁻⁷), which need to be extracted using high-frequency modulation and phase-locked amplification: modulating the Stokes light at MHz frequencies and then demodulating with a lock-in amplifier to effectively suppress laser noise.
Nonlinear Optical Characteristics
-
SRS is a second-order nonlinear process, and the signal intensity is proportional to the product of the pump and Stokes light intensities; higher spatial resolution can be obtained under tight focusing.
Comparative Advantages over Confocal/Spontaneous Raman
-
Significantly improved imaging speed, achieving video rates (25 fps, 512×512 pixels).
-
No fluorescent background interference, compatible with fluorescence, second harmonic generation, photoacoustic, and other multimodal techniques.
-
Under near-infrared excitation, tissue penetration depth reaches 100–500 µm, suitable for in vivo and thick tissue imaging.
Spectral Regions and Chemical Contrast
-
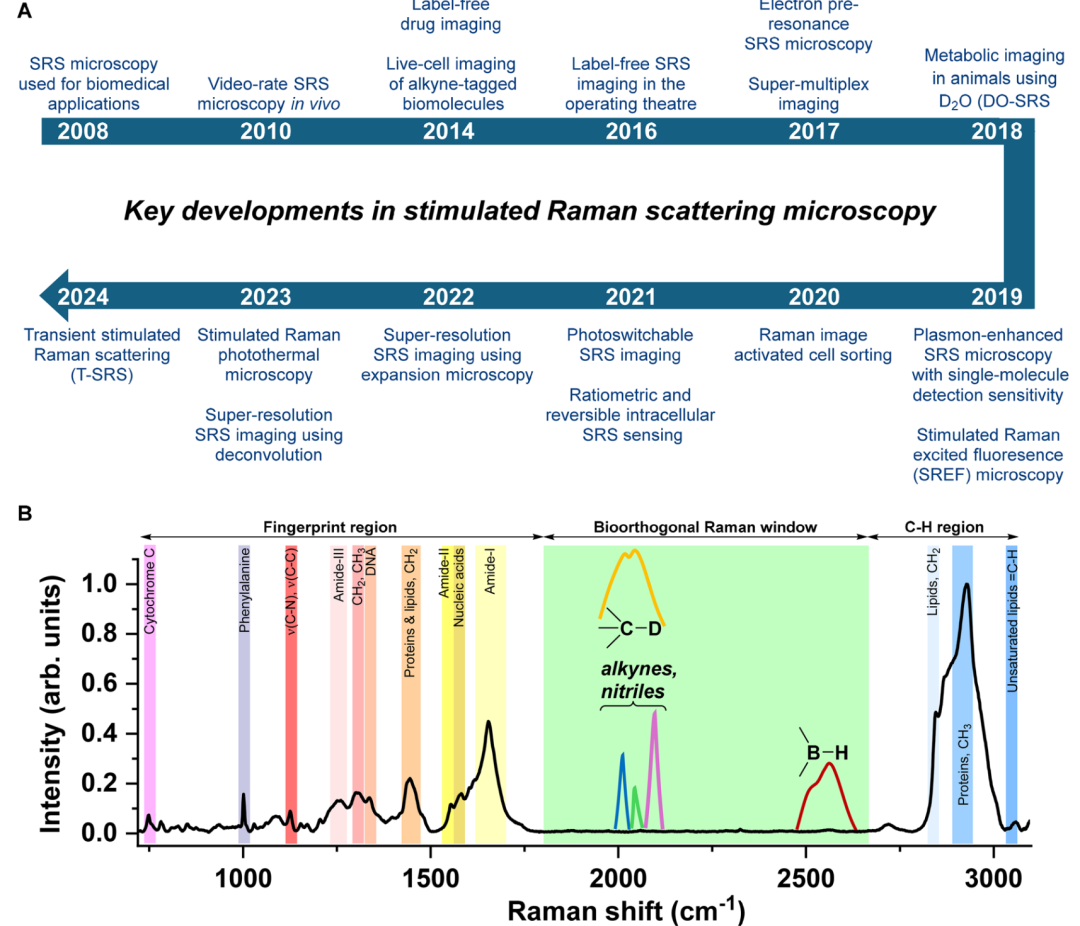
The fingerprint region (0–1800 cm⁻¹) can detect proteins, lipids, nucleic acids, etc.
-
The “bioorthogonal window” (1800–2800 cm⁻¹) is used for background-free imaging of exogenous labels containing alkynes, nitriles, C–D, etc.
-
The C–H region (2800–3100 cm⁻¹) provides rich endogenous contrast for lipids, proteins, etc.
Spatial Resolution and Depth
-
Under near-infrared excitation, lateral resolution is approximately 400 nm, axial resolution is 1–2 µm; visible light excitation can enhance resolution to 130 nm.
-
Tissue clearing techniques further increase imaging depth to >1 mm.
Biocompatibility
-
Long-term, low phototoxicity imaging of live samples such as live cells, nematodes, zebrafish, and mouse brain and skin has been achieved.
In summary, this section establishes the theoretical foundation for SRS as a rapid, label-free, chemically specific microscopic technique and highlights its unique advantages in biomedical imaging.
 Progress of SRS Microscopy in Biological Imaging Applications
This section focuses on “technological upgrades,” highlighting key advancements in SRS imaging speed, spectral multiplexing, spatial resolution, in vivo depth imaging, algorithm assistance, and super-resolution since the first biological imaging report in 2008, along with typical application examples. Key points are as follows:
-
Imaging Speed
-
Video-level acquisition: 100 ns/pixel, 512×512 pixels, 25 fps, real-time observation of drug penetration in live mouse skin and human arm skin has been achieved.
Spectral Windows and Multicolor Imaging
-
The fingerprint region (0–1800 cm⁻¹) and C–H region (2800–3100 cm⁻¹) provide endogenous contrast; the 1800–2800 cm⁻¹ “bioorthogonal window” allows for the insertion of narrowband tags such as alkynes, nitriles, C–D, B–H, enabling >20 color simultaneous imaging.
-
Alkyne tags have high Raman cross-sections and narrow peaks, allowing for fine-tuning through aryl end-capping or isotope editing (¹²C/¹³C, ¹H/²H) to construct a multicolor “palette.”
Enhancement of Spatial Resolution
-
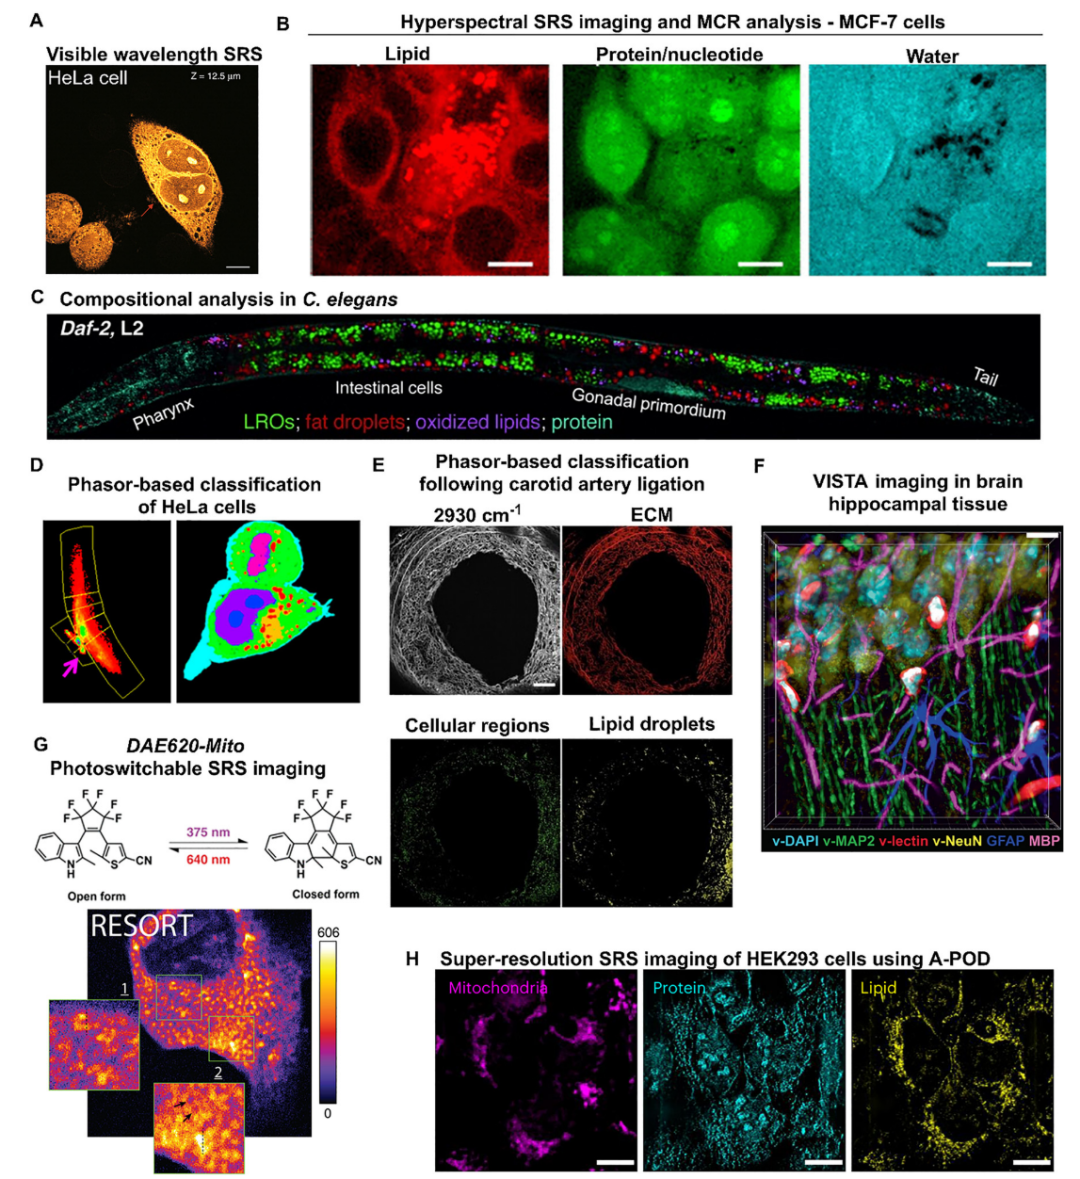
Visible light excitation (449.5 nm pump) pushes lateral resolution to approximately 130 nm; combining with optical switching “RESORT” strategy or Adam-pointillism deconvolution (A-PoD) achieves ≤60 nm super-resolution SRS imaging.
Imaging Depth and Tissue Clearing
-
Near-infrared excitation achieves depths of approximately 100 µm in scattering tissues, and up to 300–500 µm in low-scattering tissues; combined with tissue clearing techniques, depth extends to >1 mm, suitable for rapid pathological assessment of post-operative tissues.
No Fluorescent Interference and Multimodal Compatibility
-
SRS signals are collected at pump/Stokes wavelengths, avoiding fluorescent backgrounds, and can simultaneously image with single/double photon fluorescence, second harmonic generation, photoacoustic, and photothermal modalities.
Hyperspectral SRS and Algorithm Analysis
-
Wavelength scanning or “spectral focusing” fs lasers achieve 10–2 cm⁻¹ spectral resolution; combined with MCR, spectral phasor, and U-Net deep learning, enables unsupervised segmentation and concentration quantification of single cells, lipid droplets, and tissue regions.
In Vivo and Whole Organ Imaging
-
Long-term, low phototoxicity three-dimensional hyperspectral imaging of nematodes (C. elegans), zebrafish, mouse brain, skin, tumors, and human skin has been reported.
In summary, this section systematically demonstrates the progression of SRS from “rapid, label-free” to “multicolor, super-resolution, three-dimensional, intelligent analysis,” laying the technical foundation for subsequent applications in drug uptake, metabolism, and skin delivery.

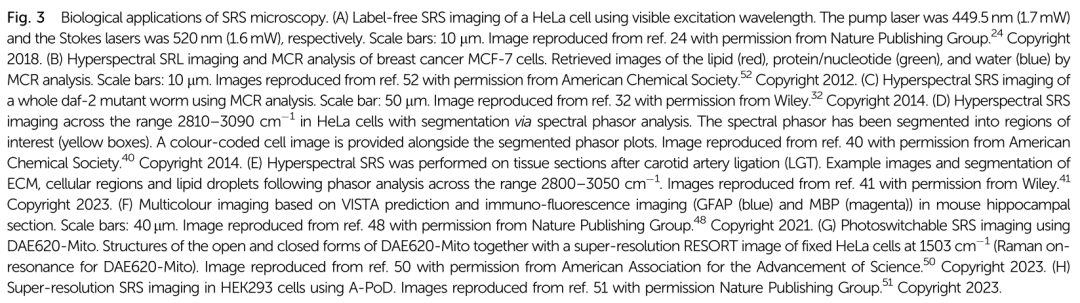 Hyperspectral SRS Imaging
This section focuses on how to upgrade traditional single-band SRS to a “high-content” imaging platform through “full-spectrum” acquisition and chemometric/machine learning algorithms, enabling simultaneous identification, quantification, and segmentation of multiple components in complex biological samples. Key points are as follows:
-
Motivation and Definition
-
Single-band SRS often fails to distinguish lipids, proteins, drugs, etc., due to overlapping peaks in the C–H region; hyperspectral SRS records complete Raman segments (x,y,ω) at each pixel, obtaining a “three-dimensional data cube” that can be “deconvoluted” using subsequent algorithms.
Acquisition Strategies
-
Picosecond lasers tune the pump wavelength frame by frame: spectral resolution ~10 cm⁻¹, but there is laser power/wavelength drift leading to spectral line distortion.
-
Femtosecond “spectral focusing”: using chirped pulses + delay scanning, achieving 5 cm⁻¹ or even 2 cm⁻¹ resolution while maintaining high repeatability and avoiding inter-frame tuning.
-
Dual-color/multi-window synchronization: dual narrowband Stokes beams acquire CH₂/CH₃, C–D/off-resonance pairs in one imaging session, eliminating motion artifacts and improving signal-to-noise ratio.
Data Analysis Methods
-
MCR (Multivariate Curve Resolution), NNLS, spectral phasor (Fourier projection to 2D phase map, clustering by distance), U-Net/CNN deep learning for unsupervised or supervised segmentation of organelles, lipid droplets, tissue regions, and extraction of pure spectra and relative concentrations.
In Vivo and High-Speed Applications
-
Spectral focusing fs-SRS can complete 50 frames of hyperspectral stacks in <1 s, enabling real-time tracking of lipid metabolism dynamics or drug-cell interactions in live yeast and mammalian cells.
Quantitative Progress
-
By using external concentration standard curves, converting grayscale SRS intensity to absolute concentration (mg mL⁻¹ or mM), generating spatially resolved “concentration maps”; care must be taken to match sample thickness, laser focusing, and optical properties.
In summary, this section emphasizes that “hyperspectral acquisition + algorithm deconvolution” allows SRS to simultaneously possess high spatial resolution and chemical specificity, providing a high-content data foundation for subsequent drug localization, metabolic reprogramming, and toxicity evaluation.
Quantitative SRS Imaging in Drug Discovery
This section focuses on how to elevate SRS from “seeing” to “measuring accurately,” achieving absolute or relative quantification of drugs and related components, providing reproducible and comparable numerical data for efficacy, toxicity, and formulation studies. Key points are as follows:
-
Quantitative Needs and Challenges
-
Drug development requires knowing “where the drug is and how much”; SRS signals are affected by focusing scattering, non-Raman backgrounds, and sample morphology differences, making simple grayscale values not directly equivalent to concentration.
Five Levels of Quantification
-
(i) Morphological: counting or measuring area/volume.
-
(ii) Semi-quantitative: comparing signal intensity within the same experiment.
-
(iii) Absolute concentration: using external calibration curves to convert grayscale to concentration, generating spatially resolved concentration maps; requires standard samples to match thickness, density, and laser power/focusing.
-
(iv) Relative quantification: the intensity ratio of two characteristic peaks (e.g., CH₂/CH₃, drug/protein) reflects relative changes in components.
-
(v) Dynamic ratio: using peak positions that shift with the environment for ratio sensing (pH, polarity, etc.).
Calibration and Standardization Practices
-
Prepare drug-matrix standard plates or solutions with known concentration gradients for simultaneous imaging; fit average grayscale values to linear or power-law curves, then back-calculate unknown samples.
-
It is recommended to fix laser power, scanning parameters, and use the same optical conditions; numerical corrections for thickness differences or using simultaneously collected “internal reference” bands should be applied.
Examples of Drug Research
-
Tyrosine kinase inhibitors: measured lysosomal enrichment >1000× extracellular concentration within single cells; and used ratio imaging to track drug-protein interactions.
-
Antifungal Amphotericin B: quantified its local concentration in membrane regions through the intensity of the 1556 cm⁻¹ peak and standard curve, validating the orientation model.
Error Control and Reporting Standards
-
Detection limits (common in mM), linear ranges, repeatability (CV <10%), and calibration conditions must be reported; promoting the establishment of unified standards between laboratories to improve data reproducibility.
In summary, this section emphasizes that “calibration curves + standardized experiments + ratio/absolute concentration outputs” is the necessary path for SRS to advance into quantitative research in drug discovery, providing a directly operable experimental framework and considerations.
Applications of SRS Microscopy in Drug Uptake, Localization, and Retention Imaging
This section systematically demonstrates the specific applications of SRS (including label-free, endogenous tags, and exogenous tags) in the “seeing drugs” phase: real-time tracking of small molecule drugs after entering cells/tissues, their uptake, subcellular distribution, and retention, providing direct evidence for elucidating action sites, resistance mechanisms, and drug interactions. Key points are as follows:
-
Label-free Imaging
-
Tyrosine kinase inhibitors (TKIs) – Imatinib, Nilotinib: observed lysosomal enrichment >1000× in BaF3/BCR-ABL cells using the 1305 cm⁻¹ phenyl-CC peak; co-treatment with chloroquine reduced lysosomal capture, achieving the first label-free quantitative drug-drug interaction. – Lapatinib, Afatinib: using the 1368–1390 cm⁻¹ peak combined with spectral deconvolution, found that inhibition of organic cation transporters (OCT) significantly reduced intracellular drug levels. – Ponatinib: in resistant strain KCL22-Pon-Res, lysosomal concentration was 1.9× higher than in wild type, with chloroquine co-treatment reducing it by 2.7×/3.8×, revealing lysosomal retention promoting resistance.
-
Other Categories – Amphotericin B: localized around the fungal cell membrane using the 1556 cm⁻¹ polyene C=C peak; polarization-SRS confirmed its molecular long axis is parallel to membrane phospholipids, consistent with traditional binding models.
Using Drug’s Own Endogenous Tags
-
Alkyne-containing FDA drugs: Ponatinib, 7RH, Ethinyl Estradiol (EE2) directly detected alkyne peaks (2217–2221 cm⁻¹) or the terminal alkyne of EE2 (2093 cm⁻¹); EE2, due to weak signals, was enhanced by CTAB-gold nanorods to improve sensitivity by 10×.
-
BNCT drugs: BSH-cholesterol conjugate utilized the B–H 2505 cm⁻¹ peak, enriching 435× in HeLa membrane regions, achieving the first label-free imaging of boron-containing drugs.
Exogenous Chemical Insertion Tags (bioorthogonal tagging)
-
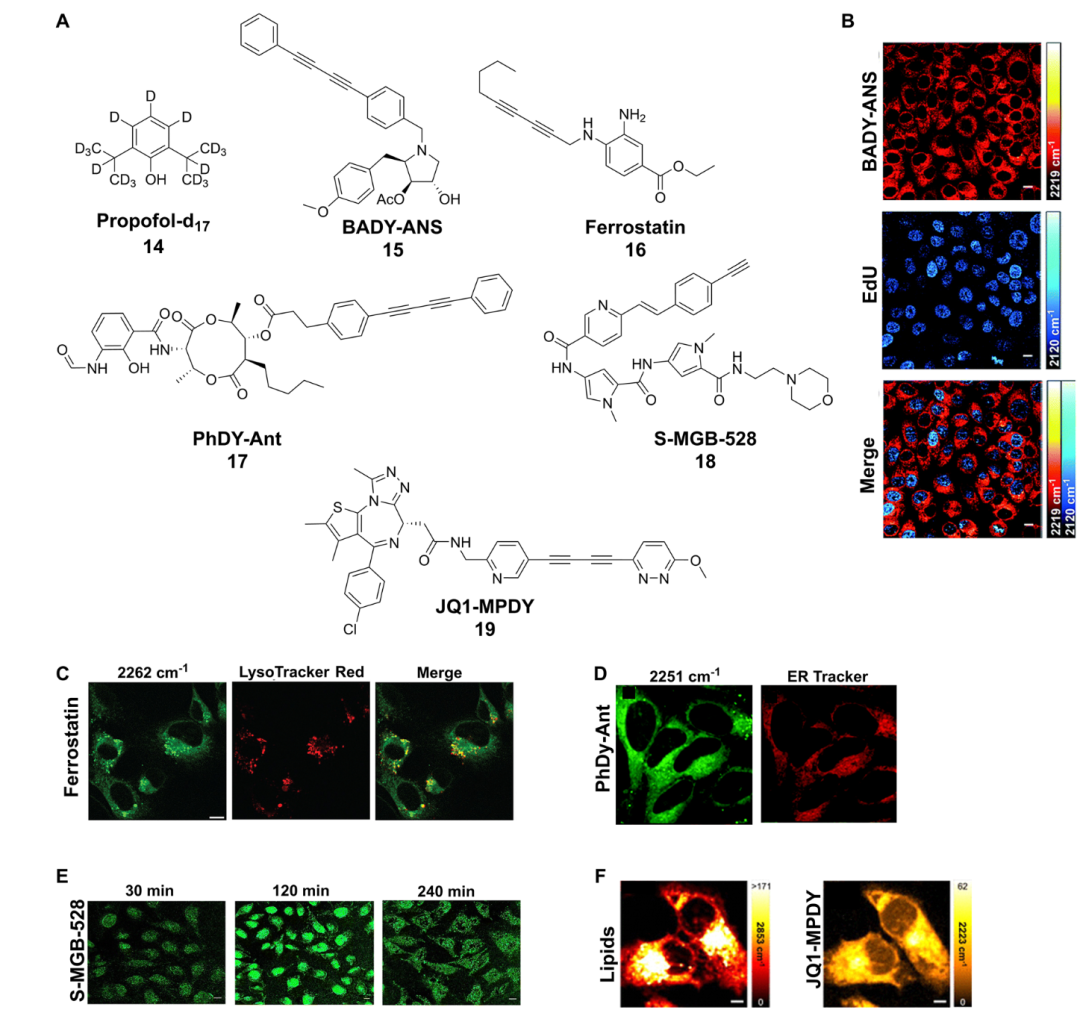
C–D labeling: Propofol-d₁₇ (2055 cm⁻¹) used in hippocampal neurons showed membrane region enrichment of 1.3×; requires high doses (mM) to compensate for small C–D cross-section.
-
Single/double alkyne tags: BADY-ANS (bis-aryl butadiyne-anthracene, 2219 cm⁻¹) can be imaged at 10 μM, with cytoplasmic enrichment of 50×; simultaneous dual-color imaging with EdU (2120 cm⁻¹) shows drug-nucleotide distribution.
-
Multi-alkyne/peptide tags: ferrostatin, antimycin, MGB, JQ1, and p53 peptide tags achieve dynamic observation of multiple compartments such as nucleus, ER, and lysosomes; time series (1 min intervals) show superior photostability compared to fluorescence.
Quantification and Kinetics
-
Establish grayscale-concentration calibration curves to output “local concentration maps”; perfusion chamber real-time recording shows 7RH rapidly taken up at 5 μM in MCF-7 cells, with a slow plateau at 1 μM.
-
Ratio imaging (drug peak/protein peak) can correct focal plane differences for high-throughput comparisons across different treatment groups.
Informatics Assistance
-
Spectral deconvolution, phasor analysis, and deep learning are used to automatically separate drug peaks from endogenous backgrounds, improving localization accuracy and throughput.
In summary, this section demonstrates the unique ability of SRS to quantitatively track various drug uptake, subcellular distribution, and retention at the single-cell level through a three-tier strategy of “label-free-endogenous tags-exogenous tags,” providing direct visual evidence for elucidating target engagement, resistance mechanisms, and combination therapies.
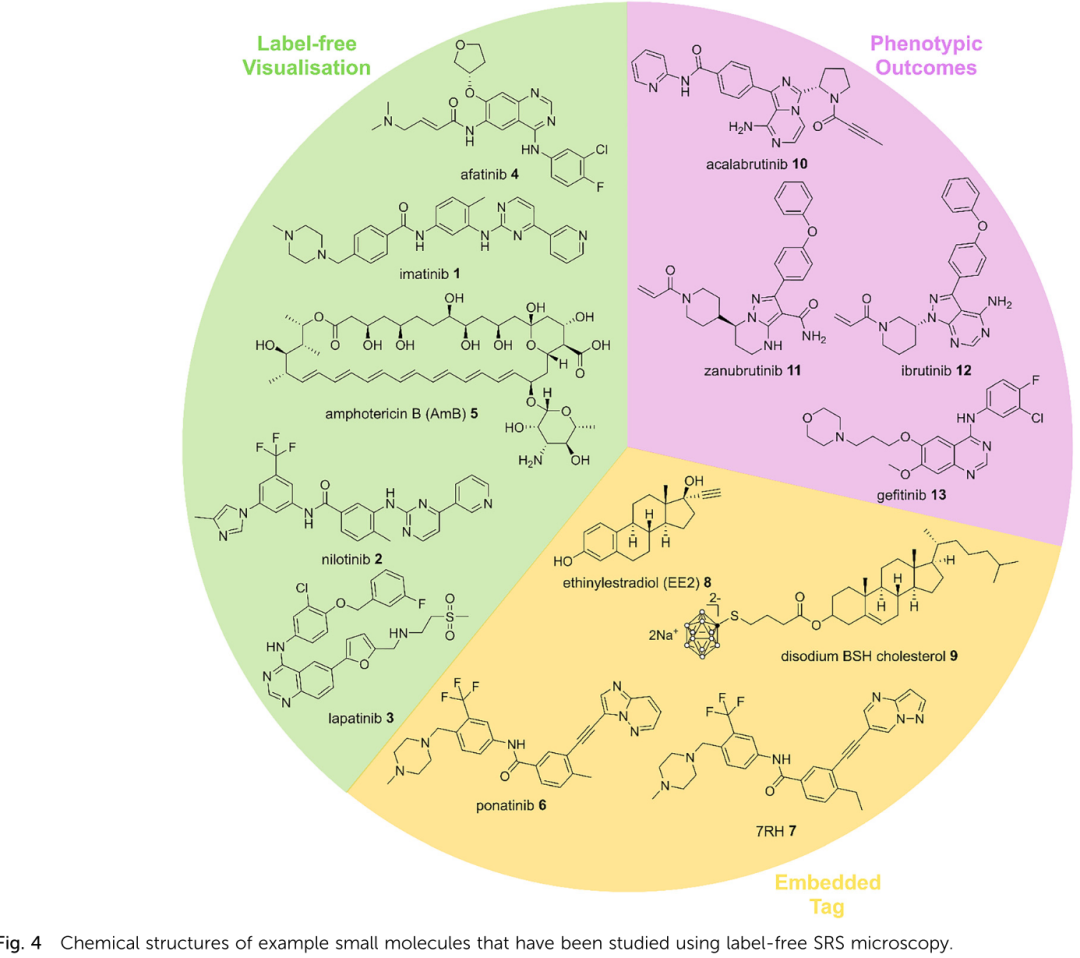
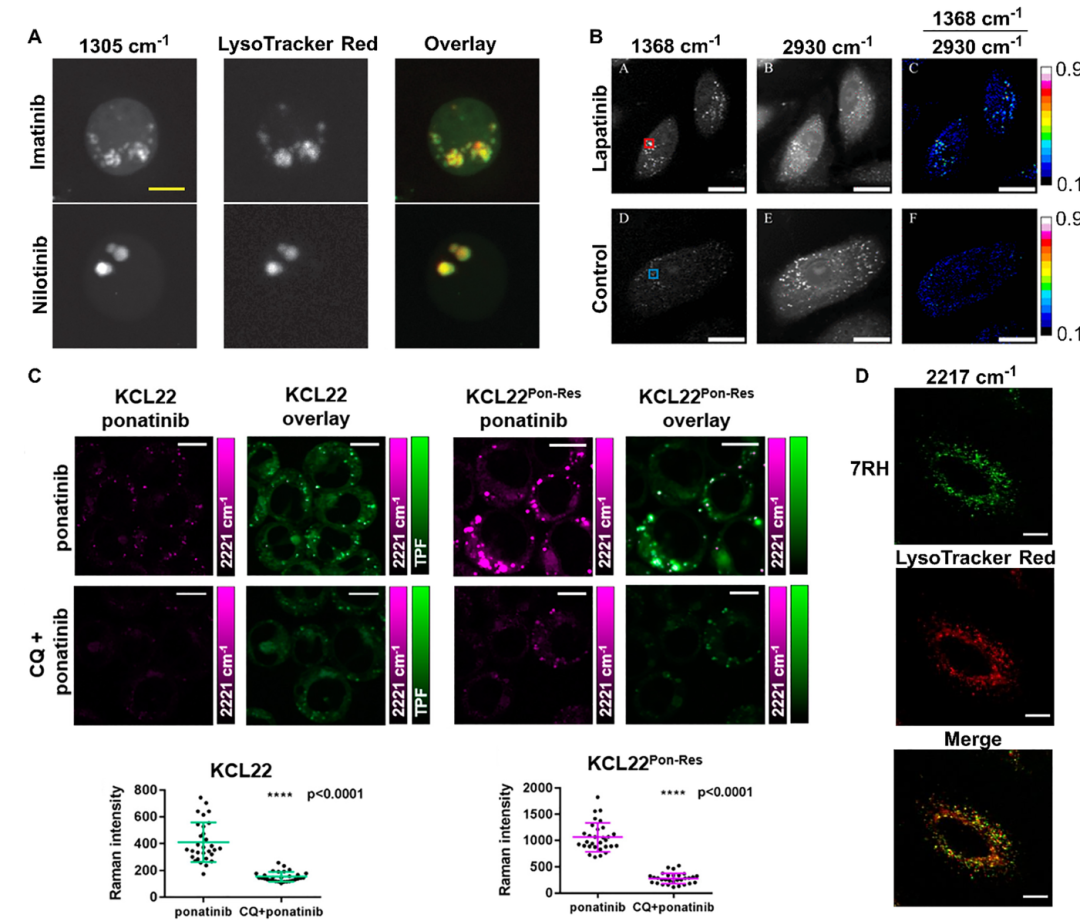
Visualizing Drug-Cell Interactions and Metabolic Outcomes
This section focuses on the “visualization of drug efficacy” aspect: utilizing hyperspectral SRS (including isotope/tag feeding) to capture metabolic disturbances and phenotypic outcomes in cancer cells, fungi, bacteria, etc., after drug treatment in real-time, thus upgrading “drug localization” to simultaneous imaging of “mechanism + effect.” Key points are as follows:
-
Lipid Metabolism (Primarily in Cancer)
-
Cholesterol esters (CE) – prostate/pancreatic/leukemia/kidney cancer cells: PTEN loss → upregulation of PI3K/AKT/mTOR → CE accumulation; SRS 702 cm⁻¹ (cholesterol ring) and 2845 cm⁻¹ (CH₂) quantified, PI3K, AKT, mTOR inhibitors or ACAT-1 inhibitor avasimibe significantly reduced CE, inhibiting metastasis. – Albumin nanoformulation avasimin: SRS confirmed that CE was also cleared after intravenous administration, solving the hydrophobic drug delivery challenge.
-
Lipid droplet desaturation/accumulation – ovarian cancer stem cells: increased ratio of 3002/2900 cm⁻¹ → more unsaturated lipid droplets; associated with spherical drug-resistant phenotypes. – Drug-induced hepatotoxicity model: spectral phasor distinguishes “simple steatosis (DIS)” from “phospholipidosis (DIPL),” used for early toxicity screening. – Electronic pre-resonance SRS: enhanced near 325 nm, distinguishing retinol (1580 cm⁻¹) from triglyceride (1655 cm⁻¹) droplets, revealing increased retinol droplets in resistant strains, suggesting lipid storage promotes resistance.
Fatty Acid Metabolism Tracking
-
Using deuterated palmitic acid/oleic acid-d₃₄, glucose-d₇, or D₂O: SRS 2125–2178 cm⁻¹ (C-D) visualizes uptake and β-oxidation; cisplatin-resistant ovarian cancer cells show “decreased glycolysis, increased exogenous fatty acids”; SCD1 inhibitor CAY10566 reduces unsaturated lipids (3022 cm⁻¹) and sensitizes BRAF inhibitors.
Protein Metabolism and Growth Rate
-
20 types of deuterated amino acids or D₂O: newly synthesized proteins appear with C-D peaks at 2133 cm⁻¹; using d-LIV (leucine + isoleucine + valine-d) or ¹³C-phenylalanine (968 cm⁻¹) ratio imaging, real-time quantification of protein synthesis rates in 2D/3D models; TKIs, microtubule inhibitors, etc., lower C-D/C-H ratios, synchronizing with apoptosis/growth inhibition.
Antimicrobial/Antifungal Metabolic Sensitivity Testing (AST)
-
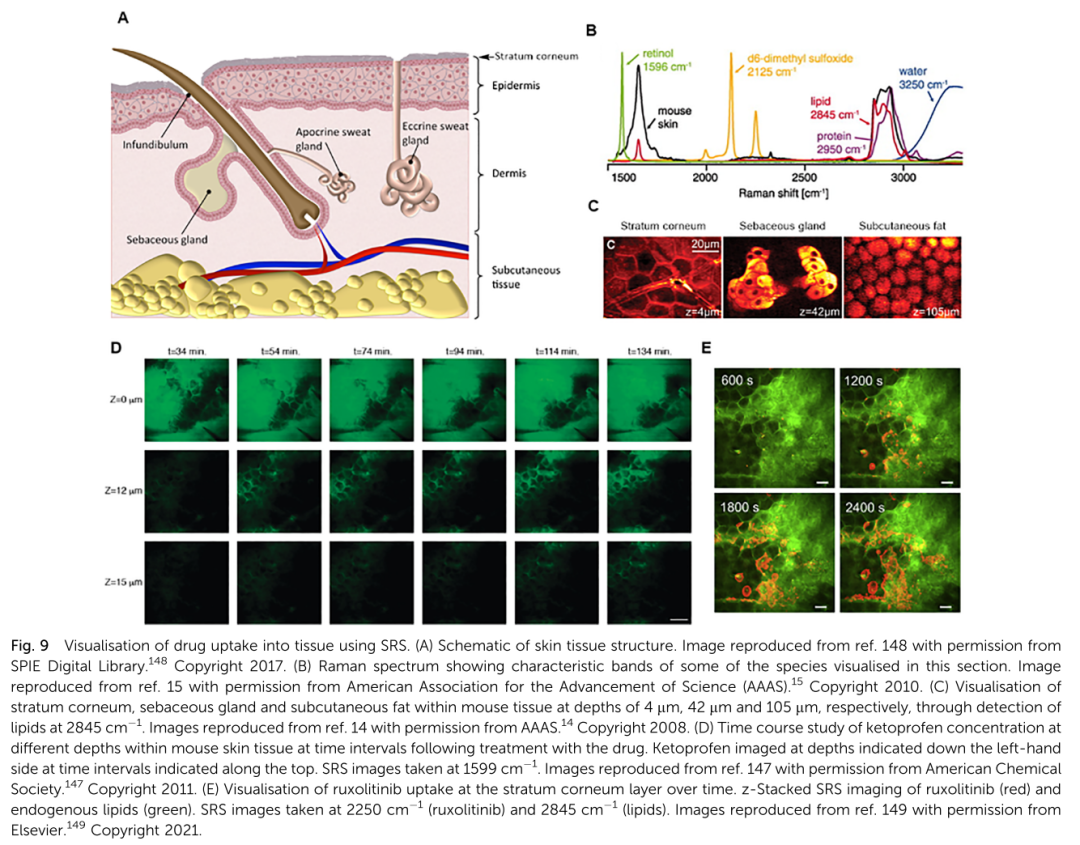
Feeding with glucose-d₇ or D₂O: resistant bacteria/fungi continuously incorporate deuterium into newly synthesized lipids/proteins (C-D peaks), while sensitive strains are inhibited by antibiotics → C-D signals decrease; single-cell MIC readouts within 0.5–2.5 h, shortening the time by 5–10 times compared to traditional 24–48 h.
-
Clinical samples (urine, blood) with 14 antibiotics, various bacteria (E. coli, K. pneumoniae, S. aureus), and fungi (C. albicans) achieved 94–96% consistency; CNN automatically segments bacteria, improving throughput.
Biofilms and Drug Resistance
-
D₂O-SRS shows metabolic heterogeneity of P. aeruginosa biofilms; Van-PEPEA (alkyne-labeled vancomycin) 2218 cm⁻¹ tracks in real-time, penetrating only the outer 15 µm of the biofilm, with deeper bacteria surviving → explaining treatment failures.
Phenotypic Outcome Imaging
-
TKI treatment of mantle cell lymphoma: 2845 cm⁻¹ lipid droplet reduction → associated with apoptosis.
-
TPA-induced mouse epidermal hyperplasia: 2956 cm⁻¹ DNA peak shows increased mitotic figures, quantifying cell cycle changes.
Technical Combinations
-
Combining spectral phasor, MCR, CNN, and ratio imaging achieves “metabolism-structure-efficacy” one-stop quantification; the same sample can be simultaneously analyzed with fluorescence, second harmonic generation, photothermal, and other multimodal techniques.
In summary, this section expands SRS into a single-cell level “drug-metabolism-phenotype” synchronous analysis platform through a three-pronged strategy of “drug localization + metabolic labeling + machine learning,” providing visual quantitative tools for studying anticancer, anti-infection, and toxicity mechanisms.
 Visualizing Drug Delivery to the Skin
This section summarizes representative works of SRS (including hyperspectral, resonance enhancement, rapid tuning, and deep learning advanced modes) in transdermal/transungual drug delivery studies, with core information being: without fluorescent labeling, simultaneously tracking APIs and excipients in intact, live, or ex vivo skin, obtaining penetration depth, concentration-time curves, and mechanistic insights, thus compensating for the traditional tape stripping method’s “low resolution, no spatial, non-live” shortcomings. Key points are as follows:
-
Early Milestones
-
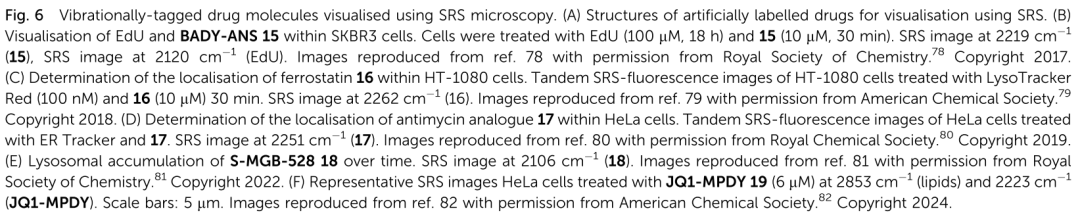
First in vivo imaging of mouse brain/ear: 2845 cm⁻¹ lipids reveal depth stratification of 4–105 µm; 670 cm⁻¹ DMSO follows the “protein channel,” while 1570 cm⁻¹ retinoic acid follows the “lipid channel,” proving the differences in API hydrophilic/hydrophobic pathways.
Video Rates and In Vivo Human Imaging
-
Phase-locked amplification + backscattering collection achieves 100 ns pixel⁻¹, 25 fps real-time recording of retinoic acid (1596 cm⁻¹) entering sebaceous glands along hair follicles; after applying DMSO-d₆ on human arms, the 2120 cm⁻¹ signal enriched around hair shafts, achieving the first visualization of drug delivery in live human skin.
Simultaneous Quantification of API and Excipients
-
Ketoprofen (1599 cm⁻¹) and deuterated propylene glycol (2120 cm⁻¹) ex vivo experiments on mouse ears: SRS layer-by-layer integration yields concentration-depth curves, showing faster permeation of excipients than APIs; evaporation of propylene glycol leads to the crystallization of ibuprofen-d, revealing the impact of excipients on thermodynamic stability.
-
Pig skin, due to a thicker stratum corneum, shows lower permeation rates than mice, indicating species differences.
Antifungal/Anti-dandruff Examples
-
Terbinafine (2230 cm⁻¹) primarily distributes along lipid channels; compared to ketoconazole CBZ (1580 cm⁻¹) and zinc pyrithione ZnPT (1540 cm⁻¹), CBZ penetrates 50–60 µm while ZnPT only 10–20 µm and crystallizes on the surface, explaining clinical efficacy differences.
Human Nails and Microneedles
-
Microneedle rolling + nanoparticle delivery to nails: OMC (1600 cm⁻¹) still co-localizes with Nile Red particles after 3 h, diffusing to 32 µm deep after 7 d; SRS-TPF dual-modal quantifies release kinetics within nails.
3D Phenotyping and Efficacy
-
TPA-induced mouse epidermal hyperplasia: 2956 cm⁻¹ DNA peak shows increased mitotic figures, achieving label-free cell cycle analysis.
-
Ruxolitinib (2250 cm⁻¹) CNN-assisted segmentation of lipophilic/hydrophilic regions, live Z-stacks provide concentration-time curves from 0–60 min; low pH gels disrupt the stratum corneum, significantly accelerating permeation rates, showing the interaction between formulation and barrier.
Signal Enhancement and Speed Improvement
-
Phase modulation PM-SRS removes tissue background, enhancing signal-to-noise ratio by 40×, used for lidocaine (1092 cm⁻¹), loxoprofen (1184 cm⁻¹) deep analysis.
-
Sparse sampling S4RS with rapid switching across 20 bands/s generates spectra for Taz/PEG200 composite formulations, indicating Taz retention in the stratum corneum while PEG rapidly enters sebaceous glands.
Microfluidic-Raman Coupling
-
3D printed microfluidic applicators coupled with SRS achieve instantaneous API delivery and record within seconds, outputting early 0–30 min pharmacokinetic curves, providing a high-throughput platform for formulation screening.
In summary, this section demonstrates that SRS can provide high-resolution, quantitative, real-time data on drug penetration and barrier interactions under “in vivo-ex vivo-human-animal-nail” multi-scale, multi-component (API + excipients) conditions, offering new visualization tools for formulation optimization, efficacy evaluation, and regulatory submissions.
 For literature or to join the cell knowledge exchange group, please add the following (please note: professional + literature/cell knowledge exchange):