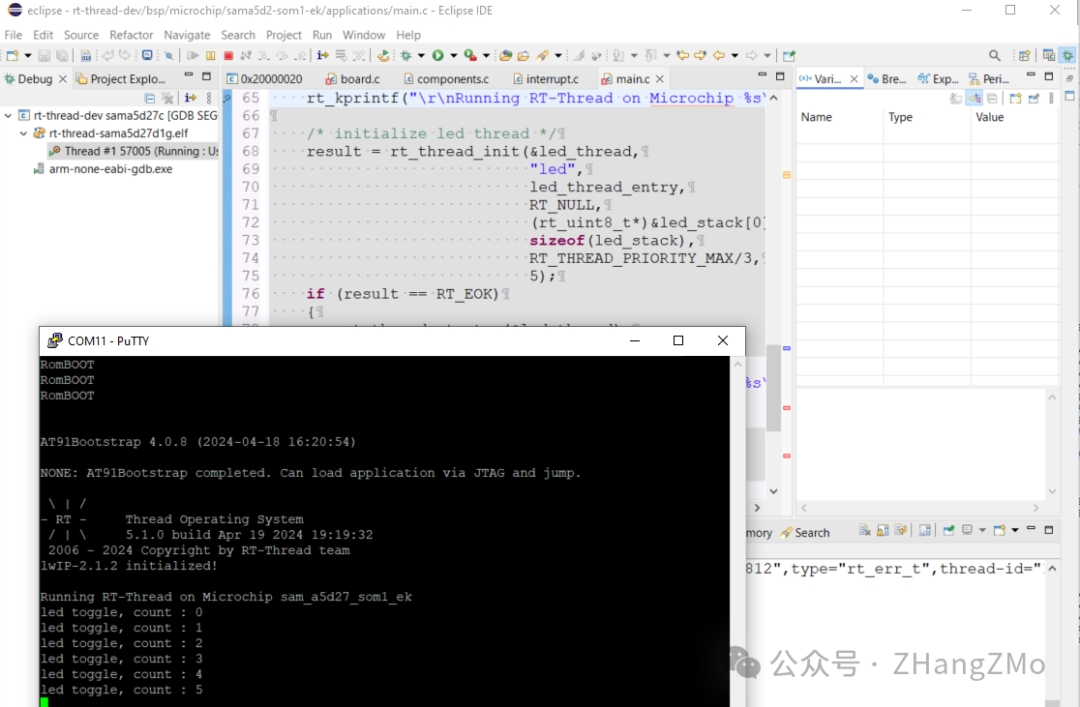
@Debugging RT-Thread on Microchip MPU with JLink in Win10
- Import Project
- Configure Debugging
- Verify Configuration
- Open JLinkGDBServer and Configure
Preparation
-
Downloadat91bootstrap source code -
DownloadEclipse IDE for Embedded C/C++ Developers -
DownloadJLink
Compile at91bootstrap
-
Modify at91bootstrap’s Makefile:
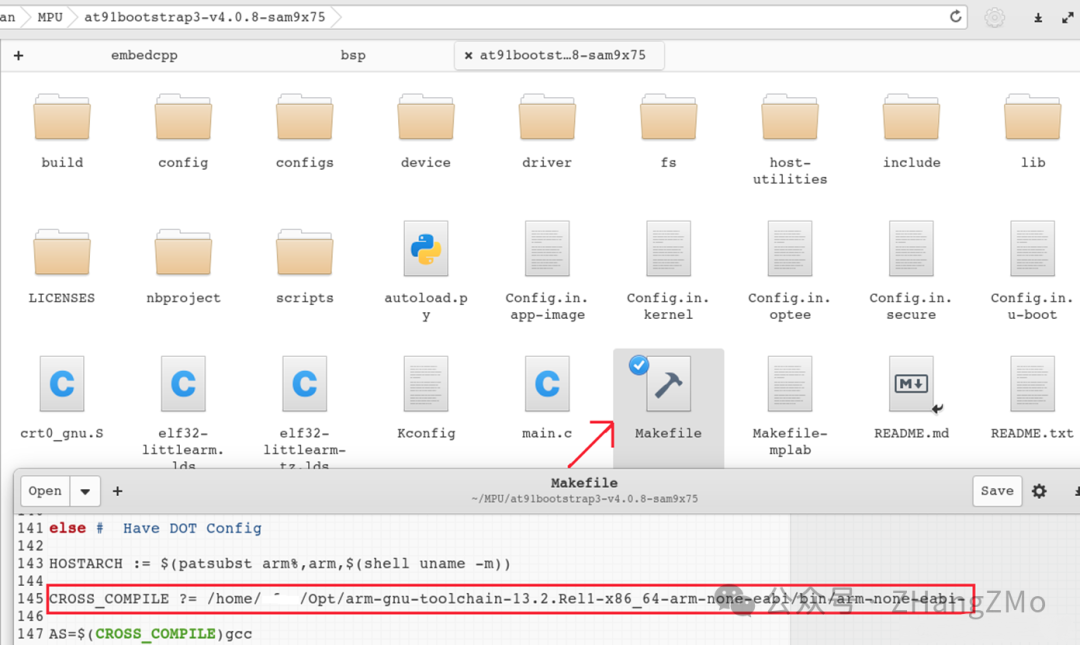
-
Run make sam9x75eb_bkptone_defconfig to configure, then compile:
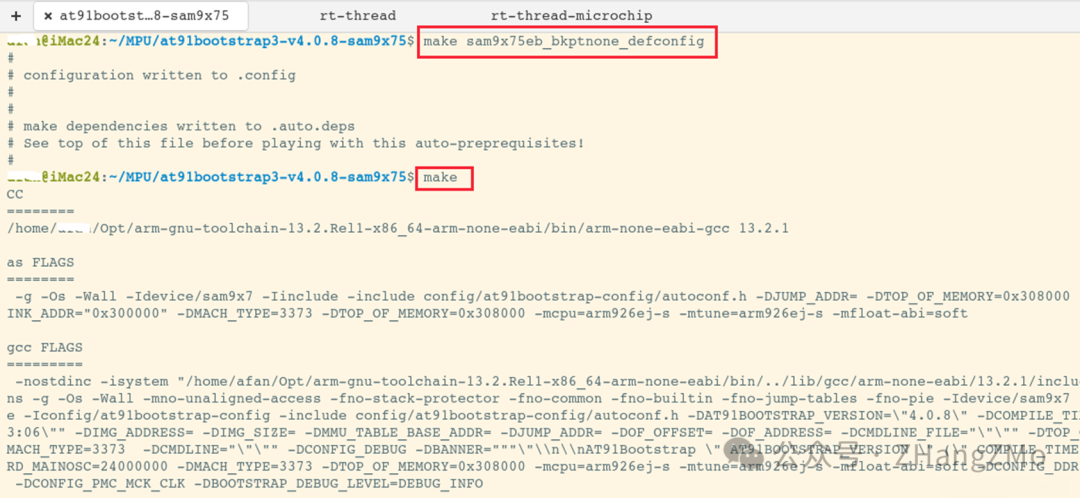
-
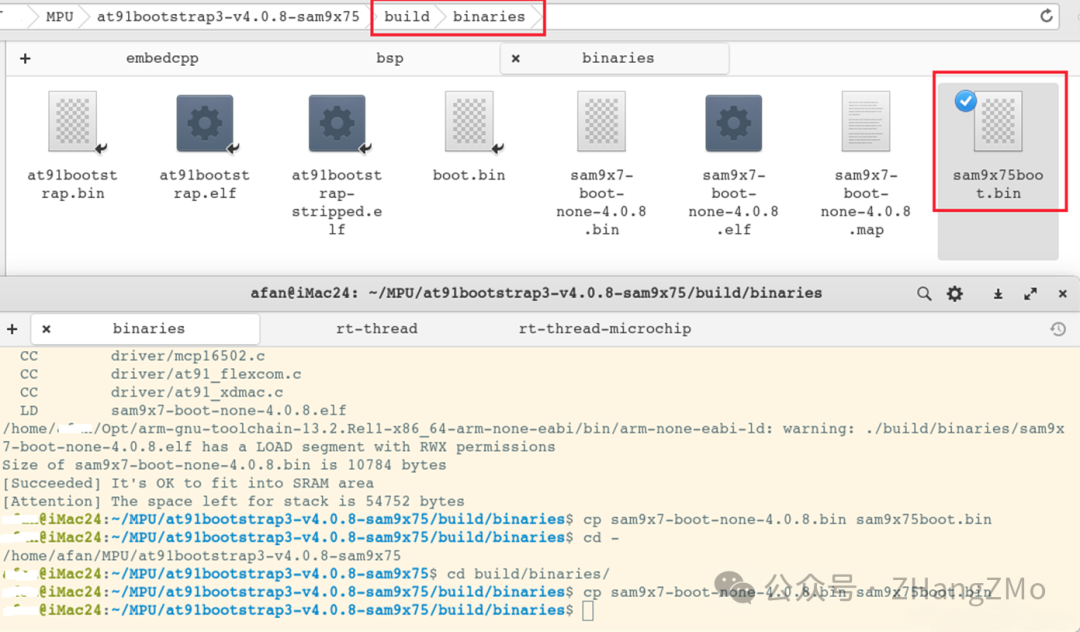
Copy at91bootstrap binary file:
Copy the generated at91bootstrap binary file to the root directory of RT-Thread source code, and in the at91bootstrap/build/binaries directory, execute the cp command to copy it
Configure Eclipse – Example with RT-Thread on Win10
Import Project
UsingEclipse for Embedded C/C++, the specific operation process and simulation configuration are as follows:
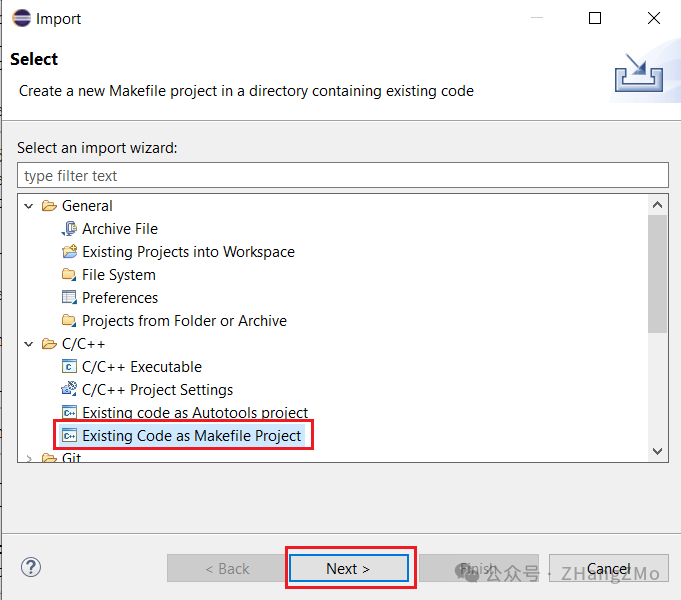
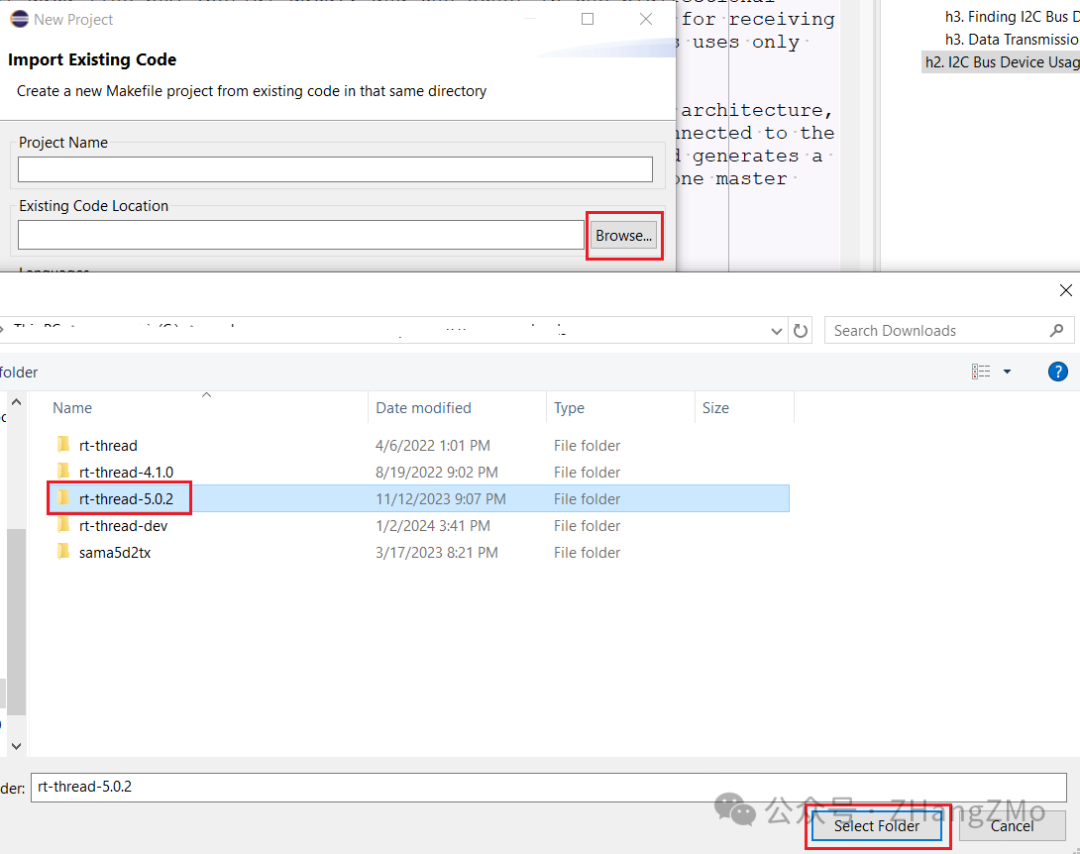
Configure Debugging
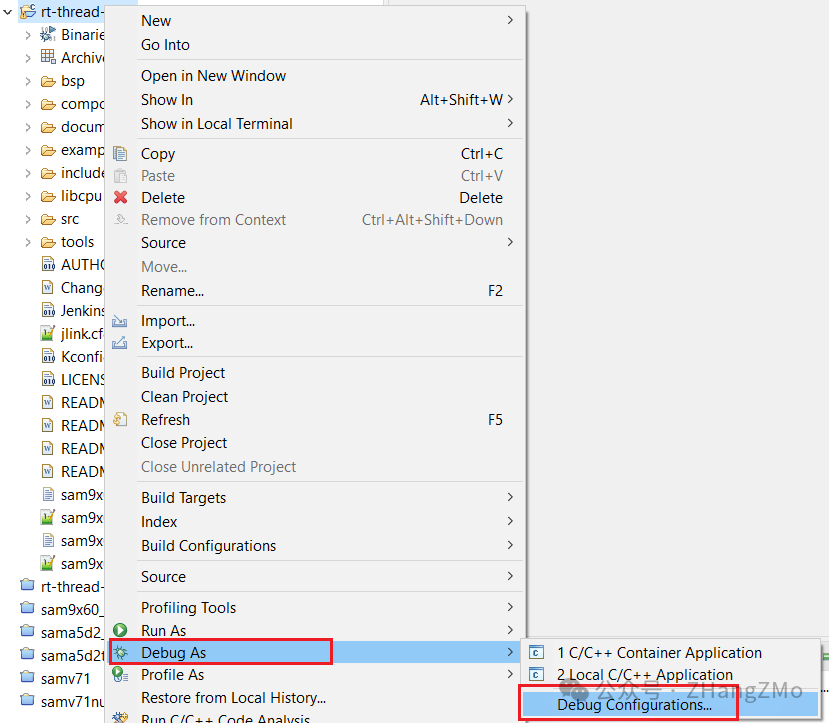
Configure Debugging
-
Select GDB SEGGER J-Link Debugging -
Create a new JLink Debugging configuration -
Rename the Debugging configuration name -
Select the elf file to debug -
Disable automatic compilation
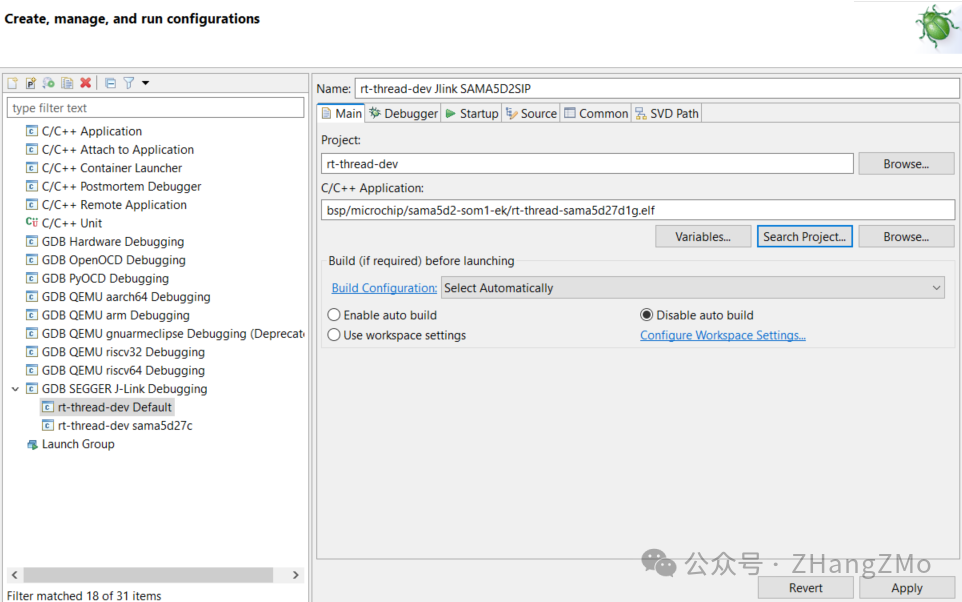
Configure Debugging
-
When setting up the debugging environment on WIN10, just selectGDB Client only -
No need to check Start the J-Link GDB server locally. Note: On WIN10, you need to manually start the J-Link GDB Server. On Linux, this can be checked to automatically start the J-Link GDB server during debugging
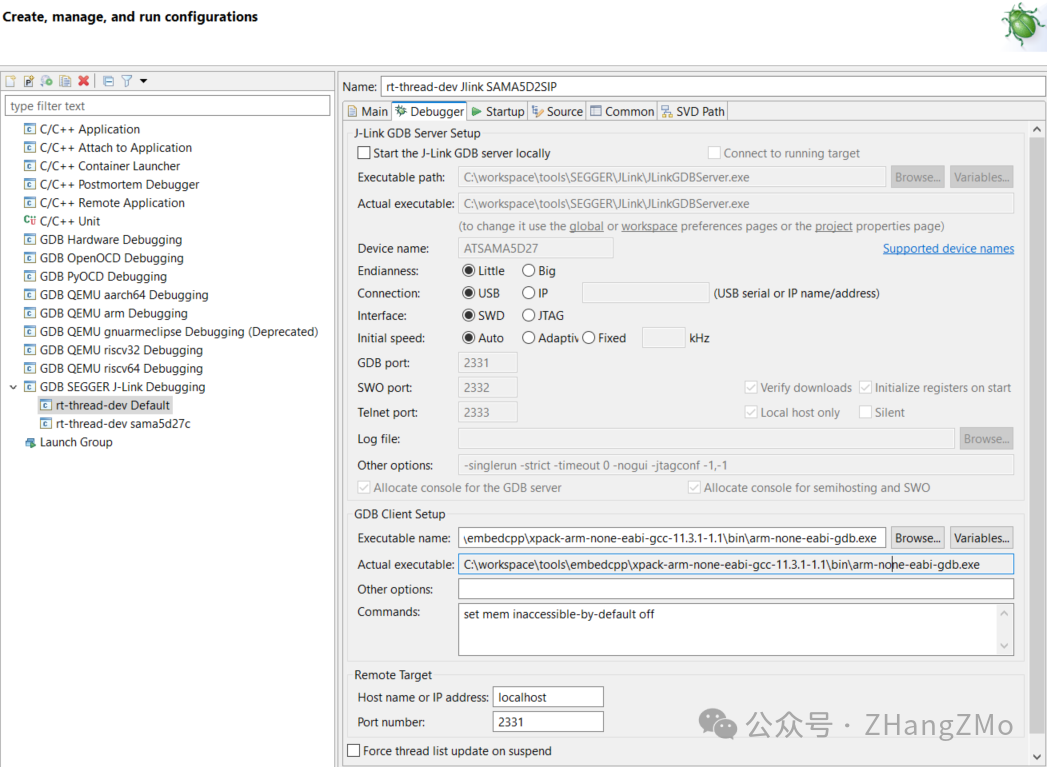
Configure Debugging
-
Manually input the following command to call Jlink.exe, to run the command file, loading and running at91bootstrap before debugging RT-Thread to initialize the MPU board-level hardware, system clock, and DDR controller. -
Finally, click Apply to save. Do not close the Debug Configuration window at this time
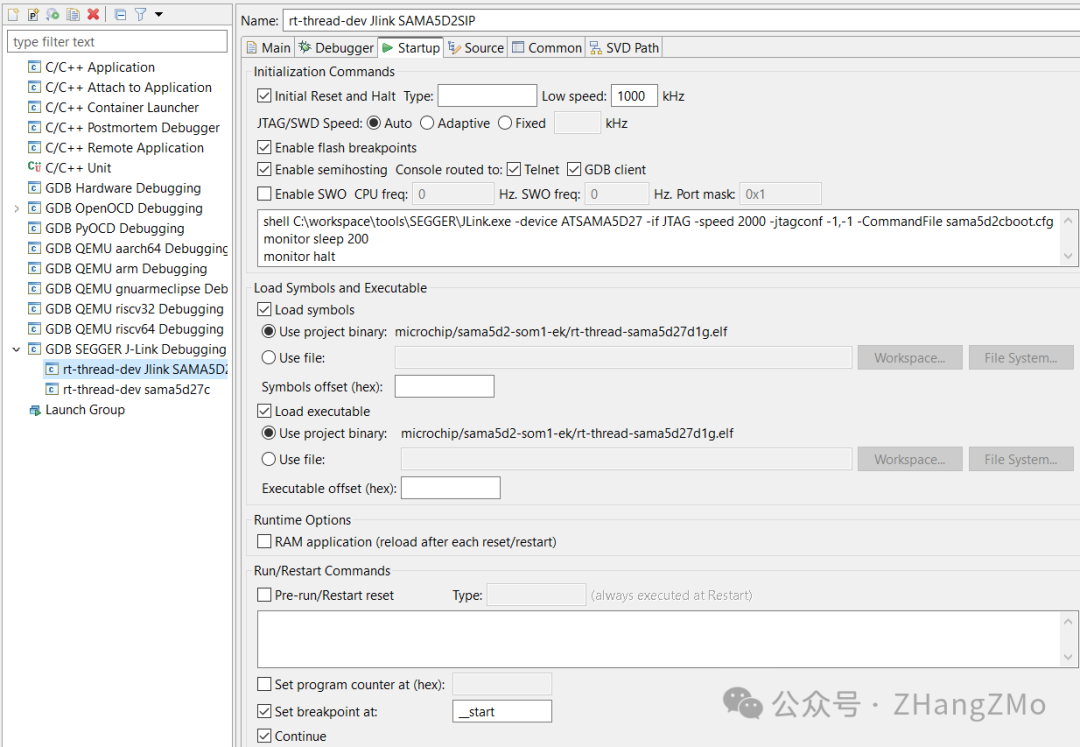
Executed shell command 10. This command tells the JLink.exe program the model of the connected device, communication interface type, communication speed, JTAG configuration, and the last executed command file. 11. After executing the command file, let the simulation debugging sleep for 200ms, which is the time needed for executing at91bootstrap, and finally execute the halt command
shell C:\workspace\tools\SEGGER\JLink.exe -device ATSAMA5D27C-CN -if JTAG -speed 2000 -jtagconf -1,-1 -CommandFile sama5d2cboot.cfg
monitor sleep 200
monitor halt
Note: If WIN11 or the JLink installation path has spaces, you need to add double quotes to the JLink path “”
shell "C:\workspace\tools\SEGGER\JLink.exe"
Verify Configuration
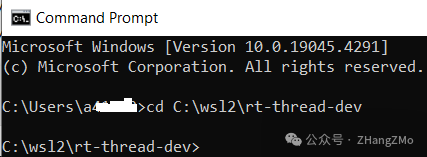
You can manually test whether the commands after configuration are executed correctly during the Eclipse debugging process: On WIN10, execute the cmd command, and enter the command line interface using the cd command to enter the rt-thread source code root directory
Press the onboard NRST button, then press the onboard POWER ON button. Next, run the command required in step 11 in the cmd interface (see effect on next page):
C:\workspace\tools\SEGGER\JLink.exe -device ATSAMA5D27C-CN -if JTAG
-speed 2000 -jtagconf -1,-1 -CommandFile sama5d2cboot.cfg
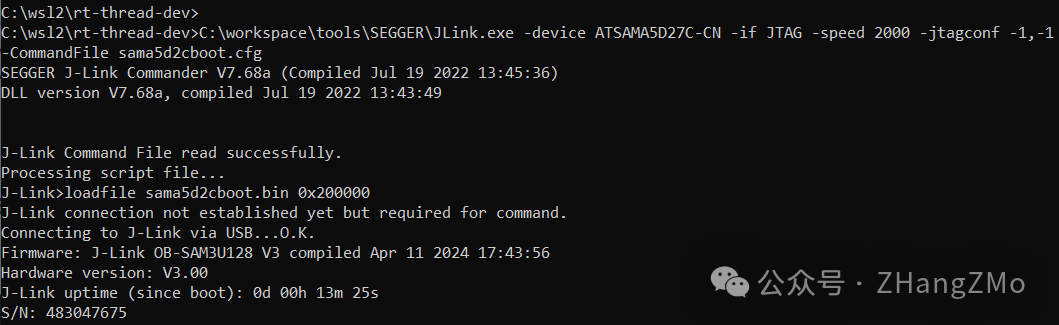
Check the debugging print serial output (select 115200 baud rate)
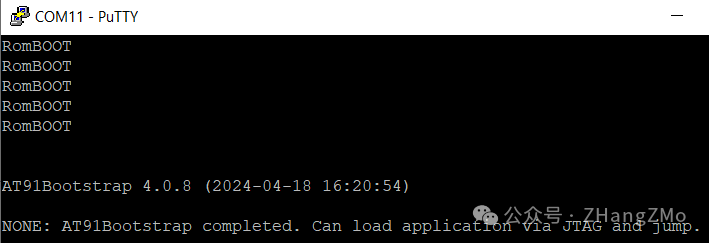
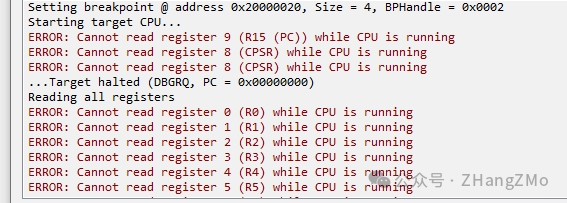
<span>If you can see the above output information on the debugging print serial, it indicates that the JLink execution command can correctly load at91bootstrap into the chip's internal SRAM to run.</span><span>If your JLink installation path has spaces, you need to add double quotes to the JLink path when executing the command in cmd "C:/ Program File/xx", otherwise you will see such error messages on the JLink tool software side:</span>
Open JLinkGDBServer and Configure
-
After opening JLinkGDBServer.exe, execute the configuration as shown in the figure
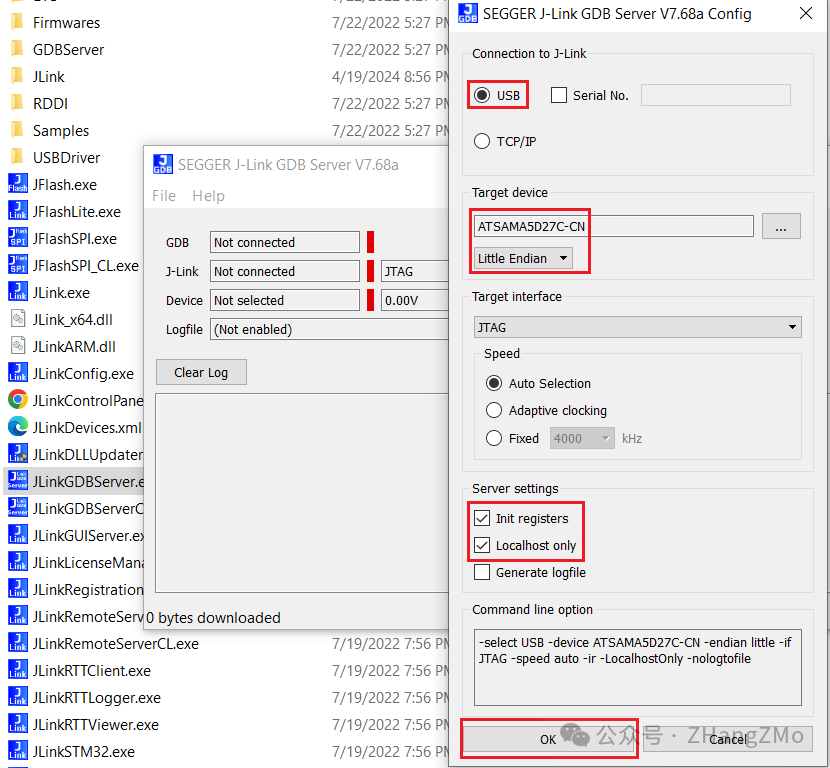
When debugging on WIN10, you can onlymanually start the JLink GDB Server first, as calling it directly in Eclipse may result in not being able to connect to the GDB Server
-
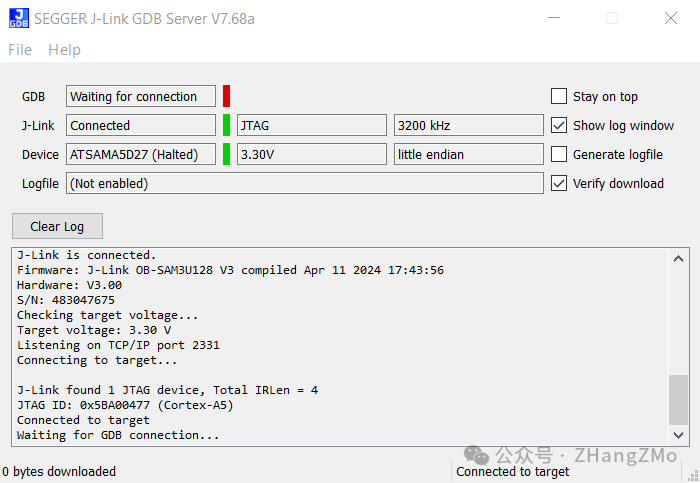
Open JLinkGDBServer and wait for connection <span>If the hardware circuit connection of SAMA5D2-SOM1-EK is correct, JLink GDB Server will connect to the SAMA5D2 device via the JTAG port and prepare for later debugging:</span>
*If prompted to upgrade the onboard JLink firmware of SAMA5D2-SOM1-EK, you can click confirm
-
Start Debugging <span> Click “Debug” to enter debugging mode:</span>
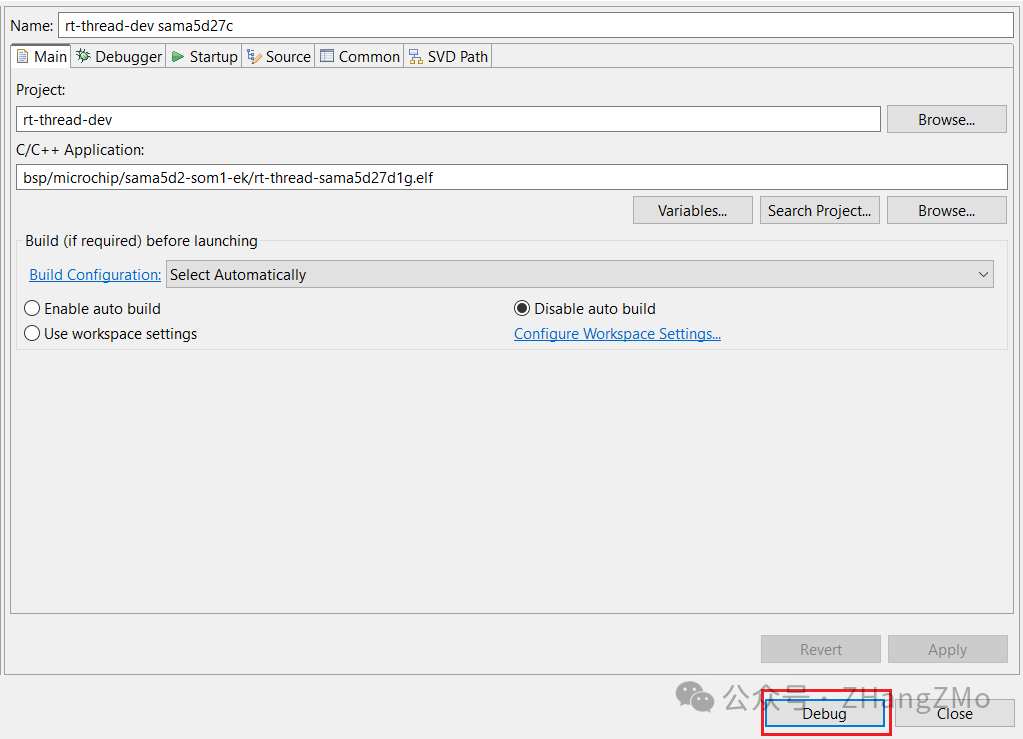
-
View JLink GDB Server output information <span>GDB client and JLink GDB Server have output information, where JLink will print verified OK when loading RT-Thread into external DDR, indicating that the SAMA5D2 hardware is configured correctly:</span>
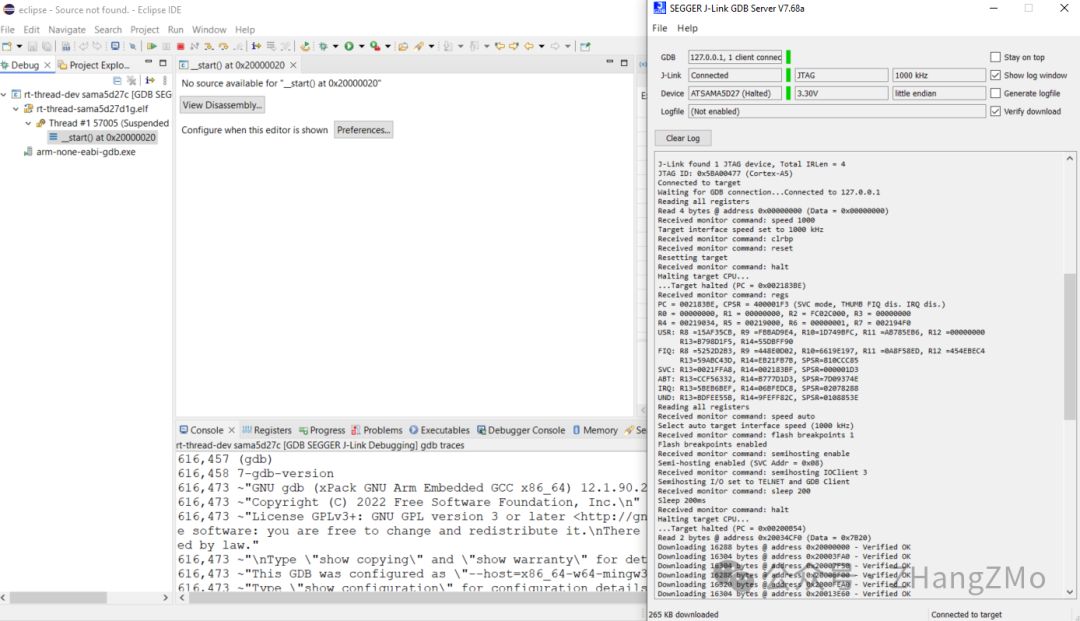
-
Observe the EDBG onboard debugging print output information <span>Open the onboard EDBG debugging output port, select 115200 baud rate, and you can see the following printed information - if there is no at91bootstrap printed information, press the NRST button first, then press the POWER ON button, and repeat the Debug steps:</span>
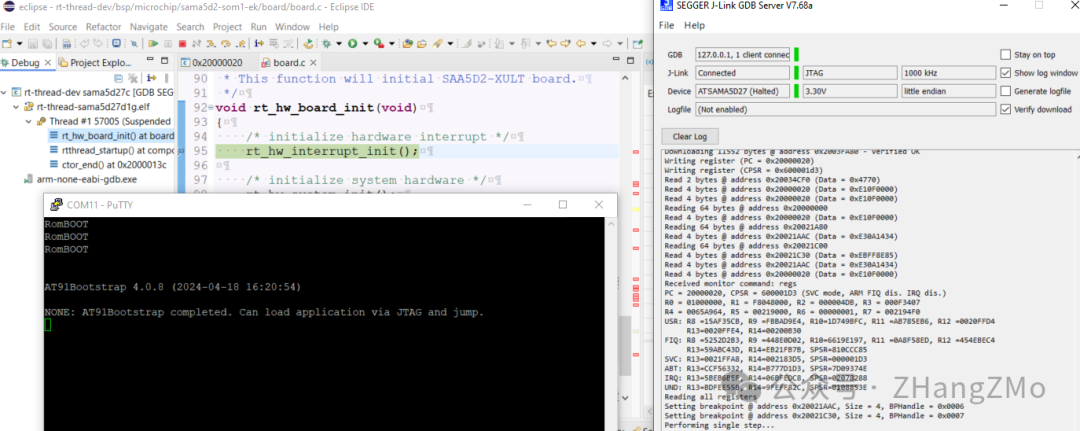
-
EDBG onboard debugging print output information <span>After running at full speed, you can see the printed information of the RT-Thread user LED Task:</span>