STM32 Debugging Steps
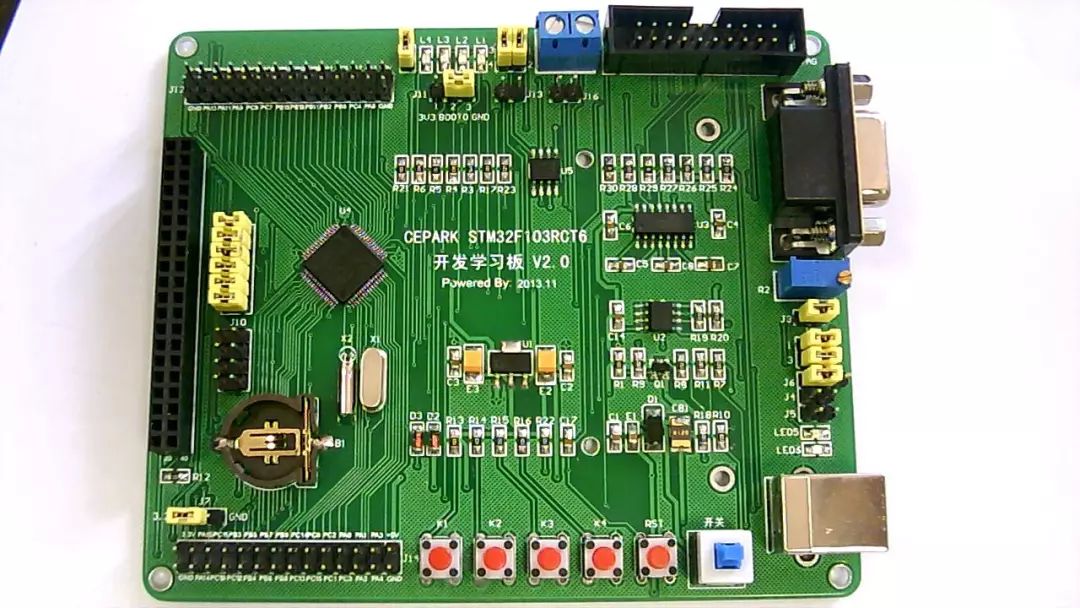
Before debugging, first short-circuit pins 2-3 of J9, short-circuit the right two pins of J4, short-circuit J5, J8, J2’s pins 1-2, and 3-4.
Connect Jlink to the learning board, USB extension cable to the learning board, serial extension cable to the learning board (or USB to serial cable to the learning board).
At this point, the LED lights LED5 and LED6 should be on. If they are not lit, it indicates a problem with the board.
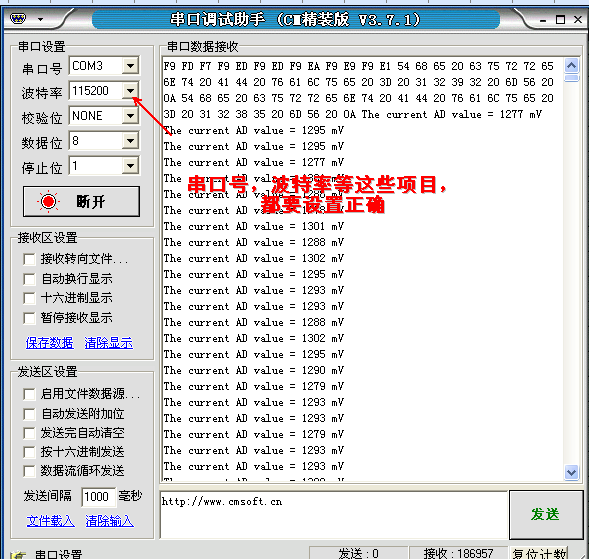
Open the serial assistant and set it as follows:
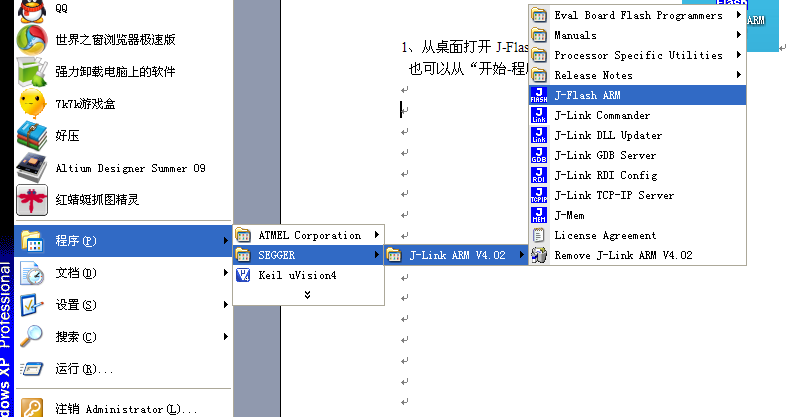
1. Open J-Flash ARM V4.02 from the desktop as shown in the picture.

You can also open J-Flash ARM in the following order.
“Start -> Program -> SEGGER -> J-Link ARM V4.02 -> J-Flash ARM”, as shown below.
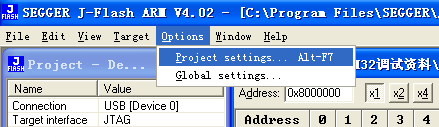
2. After opening J-Flash ARM, first set the chip options by opening Options -> Project settings as shown below.
A window as shown below will appear. Follow the steps shown in the picture to set it up.
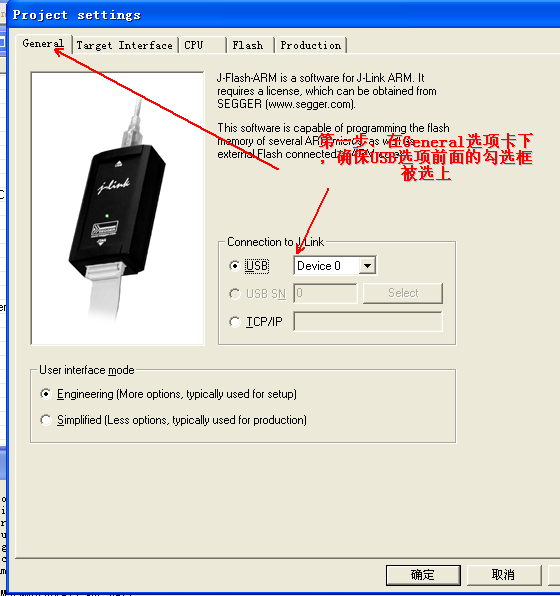
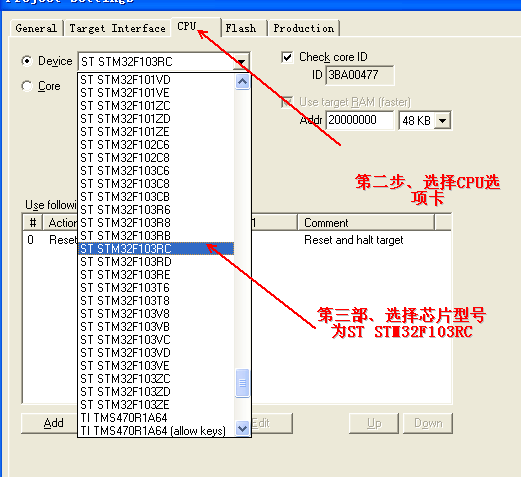
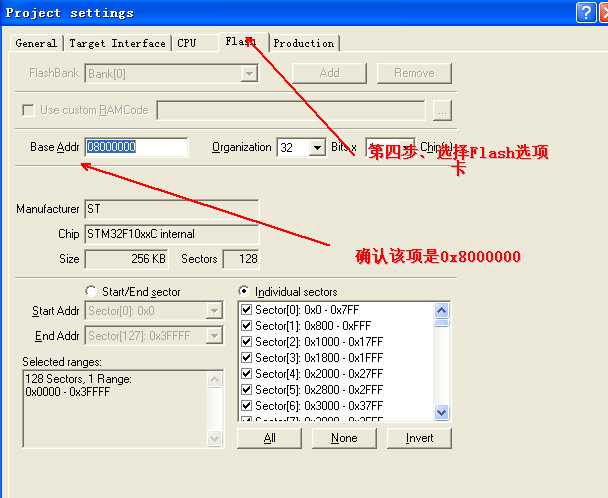
After completing the settings, click “OK” to save the settings.
3. Select the programming file. Click File -> Open, as shown below,
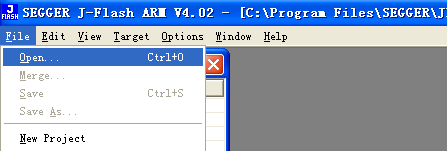
A window as shown below will appear,
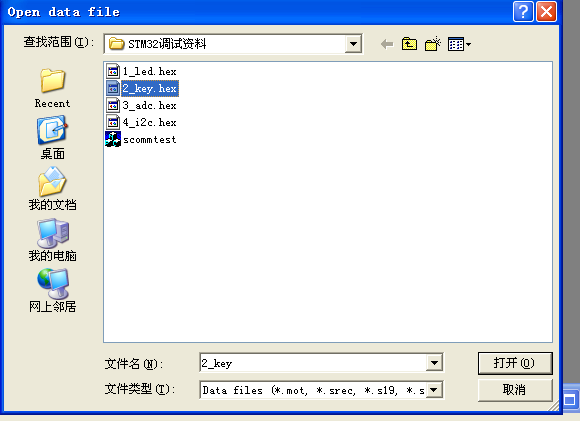
Follow the prompts in the picture below to operate,
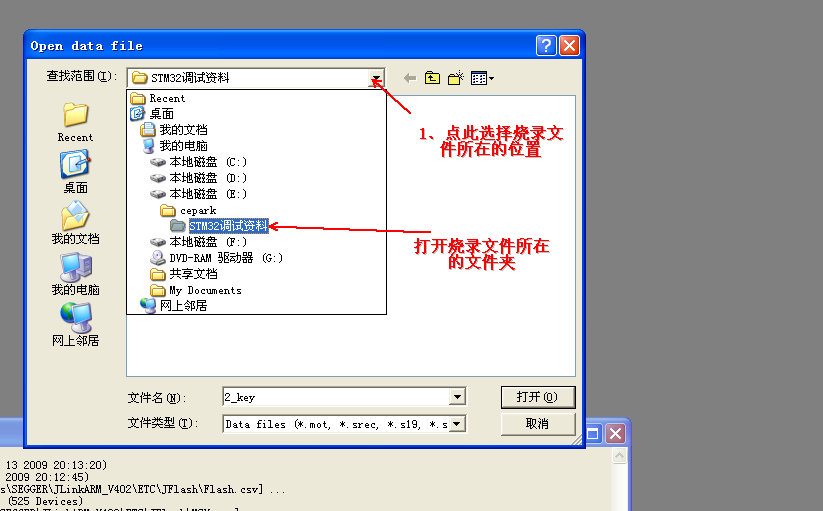
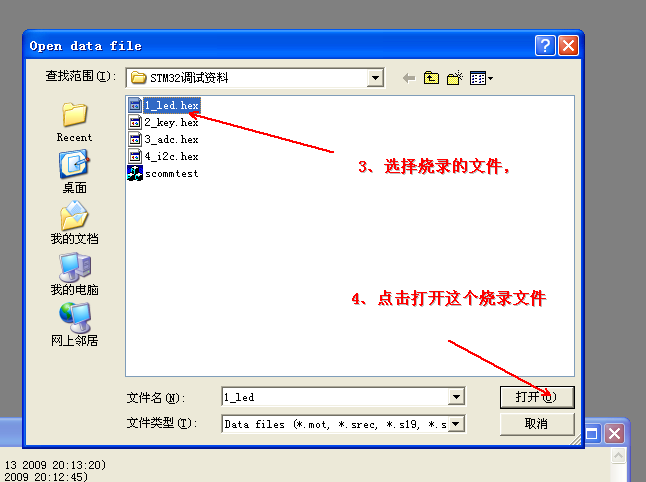
Then the opened file will be displayed as shown below
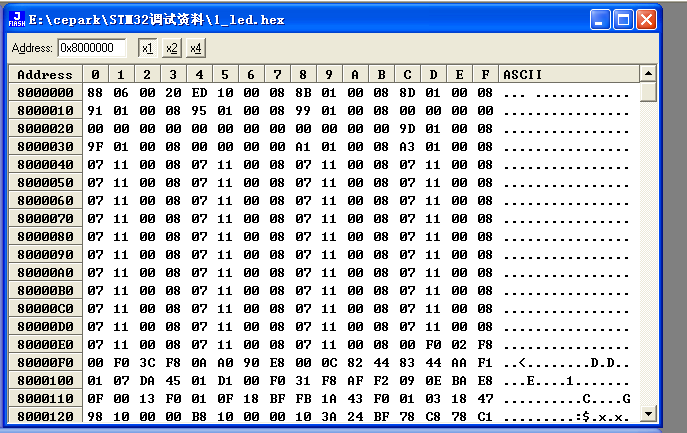
4. If this is the first time connecting jlink to the learning board, follow the operation shown below
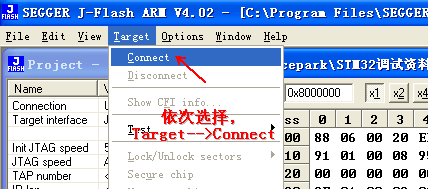
If it is not the first time connecting the learning board, follow the operation shown below
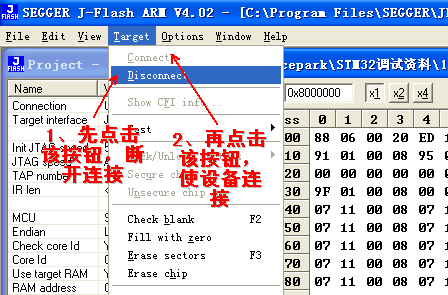
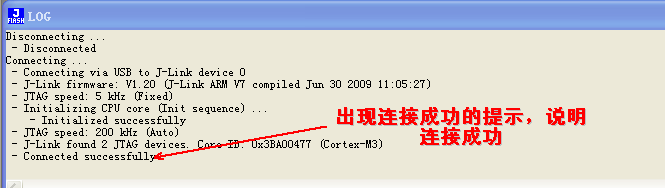
After a successful connection, there will be a prompt as shown below, otherwise it indicates a problem with the connection between the board and jlink
5. Program the firmware by following the operation shown below
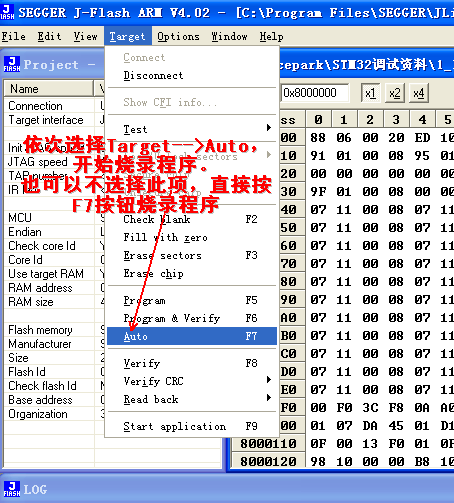
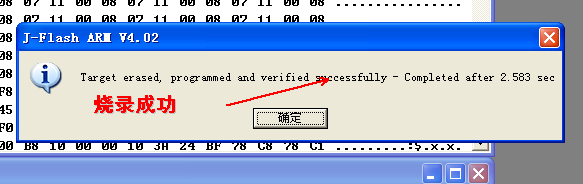
6. After successful programming, press the RST button on the learning board (the button on the far right of the learning board), at this time, all four LEDs (LED1-LED4) will light up, indicating that the program has been successfully programmed, and the soldered LED circuit is also correct.


To facilitate everyone’s learning, you can also follow the WeChat public account of Changxue Electronics and EDA, which pushes relevant knowledge every day. I hope it can help your studies!