Quick Start Guide to MATLAB (Plotting)

Quick Start Guide to MATLAB (Plotting)

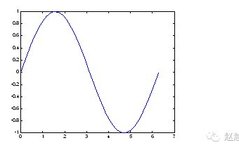
Graphing Basics 1. Basic XY Plane Plotting Commands MATLAB is not only skilled in matrix-related numerical computations but is also suitable for various scientific visualizations. This section will introduce the basic plotting commands in MATLAB for the XY plane and XYZ space, including the plotting, printing, and saving of one-dimensional curves and two-dimensional surfaces. The … Read more

Comprehensive Guide to Matlab File Management Commands

Comprehensive Guide to Matlab File Management Commands

Matlab is a professional software for scientific computing and data analysis, widely used in various fields such as engineering, science, and finance. It helps users perform efficient data visualization, numerical calculations, simulation modeling, etc., providing a complete scientific computing experience. Today, I will introduce the file commands of this tool, hoping to assist everyone. 1. … Read more

What Is The Amazing Software Matlab Banned At HIT?

What Is The Amazing Software Matlab Banned At HIT?

Last year, the ban on Matlab at Harbin Institute of Technology and Harbin Engineering University sparked heated discussions among engineering students (Breaking: Harbin Institute of Technology and Harbin Engineering University banned Matlab software). So what exactly is this amazing software Matlab? How does it benefit us, the materials science professionals? MATLAB is an engineering application … Read more

Introduction to MATLAB Application Scenarios, Desktop Environment, and Learning Paths

Introduction to MATLAB Application Scenarios, Desktop Environment, and Learning Paths

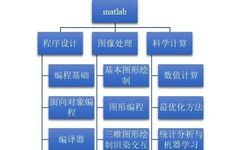
Introduction to MATLAB Learning Paths MATLAB (Matrix Laboratory) is a commercial mathematical software developed by MathWorks, designed for algorithm development, data visualization, data analysis, and numerical computation. It provides comprehensive solutions for many scientific fields. With its characteristics of being easy to learn, concise and efficient code, powerful computational capabilities, strong plotting functions, and extensibility, … Read more

Live Editor: A Powerful Interactive Programming Tool in MATLAB

Live Editor: A Powerful Interactive Programming Tool in MATLAB

When using MATLAB for scientific computing, data analysis, and engineering development, we often need to debug code, visualize results, and document the entire workflow. At this point, MATLAB Live Editor acts like a Swiss Army knife, helping developers seamlessly integrate code, charts, and documentation to create clear and intuitive interactive workflows. If you haven’t tried … Read more

Comprehensive Guide to Drawing Taylor Diagrams with Python, R, and MATLAB

Comprehensive Guide to Drawing Taylor Diagrams with Python, R, and MATLAB

Click to Follow | Making Scientific Research Simpler Star us for easier access to practical tutorials! Introduction A Taylor diagram is a commonly used visualization tool for comparing the performance differences between model simulations and observations. It displays correlation, standard deviation, and root mean square error in one chart, making it a powerful assistant in … Read more

How to Download and Install MATLAB R2024b

How to Download and Install MATLAB R2024b

↑↑↑ FollowPurple Sweet Potato Cake,Pin or Star~ Daily resources are abundant, don’t miss out! Download Software Download Link 1 https://pan.quark.cn/s/034c7f4f79a2 Download Link 2 https://pan.xunlei.com/s/VOBBMJp0tuPo-h3TU_MyfLbwA1?pwd=6v53# Download Link 3 https://pan.baidu.com/s/1pXjDqeZXVwet7oor4MLmZA?pwd=0531 Installation Steps 1. Download 【MATLAB R2024b】 to your local machine, using a non-system default extraction tool, extract to 【MATLAB R2024b】 2. Double-click to open 【Setup】 3. Right-click … Read more

Scientific Computing with Python on Raspberry Pi

Scientific Computing with Python on Raspberry Pi

Translation organized by Python Tribe (python.freelycode.com), no reproduction allowed, sharing is welcome. This article is a guide on how to install a Python scientific computing stack suitable for geospatial analysis on Raspberry Pi 3. The whole process takes only a few minutes. The Raspberry Pi 3 was announced two weeks ago with substantial improvements in … Read more

Displaying Mathematical Formulas in Python with Matplotlib and LaTeX

Displaying Mathematical Formulas in Python with Matplotlib and LaTeX

Hello, welcome to Crossin’s Programming Classroom! For those engaged in scientific research, mathematical formulas are indispensable. However, displaying mathematical formulas in the program’s output can be quite challenging. This article will introduce how to use LaTeX formulas and symbols in Matplotlib, as well as how Python can generate LaTeX mathematical formulas. 1. Using LaTeX formulas … Read more