MATLAB Mathematical Modeling: Summary of Plotting Techniques
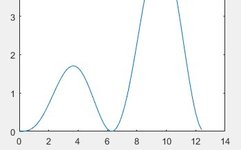
1. Two-Dimensional Data Curve Plotting 1.1 Basic Function for Drawing 2D Curves The plot() function is used to draw linear coordinate curves on a two-dimensional plane. It requires a set of x coordinates and corresponding y coordinates to plot a 2D curve with x and y as the horizontal and vertical axes, respectively. Example: t=0:0.1:2*pi; … Read more