In today’s post, we will mainly introduce several methods for drawing dynamic images in Matlab. First, using the heart shape graph previously introduced as an example, we will explain how to save the drawing process as a GIF dynamic image in Matlab.

1. Drawing GIF Images in Matlab
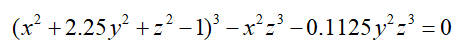
Step 1: Generate 3D Heart Shape Coordinates, the equation for the heart shape in three-dimensional space is:
To solve for the coordinates of all points that satisfy this equation, we first define 101 points along the x, y, and z axes within the range of [-3,3], using meshgrid to obtain 101*101*101 three-dimensional grid point data, and calculate the function value at each grid point
where all val equal to 0 are the coordinates of the heart shape.
Step 2: Draw the Heart Shape Line on the YOZ Parallel Plane, set X to a fixed value, extract all grid points (Y,Z) where val equals 0 on that plane, and draw the heart shape line. Here, we extract points where val equals 0 by extracting contour lines, (Y,Z)=contourc(val(:,X,:),[0,0]), the specific Matlab code for this part is:
for X = 35:67 % Extract values of f(y,z) on the YOZ parallel plane for different X values plane = reshape(val(:,X,:),101,101); % Extract contour lines where val equals 0, i.e., coordinates satisfying f(y,z)=0 c_data = contourc(plane,[0,0]); x_data = X*ones(1,c_data(2,1)); % Draw the heart shape line on the YOZ parallel plane plot3(x_data,c_data(2,2:end),c_data(1,2:end),'r'); axis([30,80,30,80,30,80])axis offEnd
Step 3: Save the Image as a GIF File, in Matlab, you can use imwrite to save the image as a GIF, but you need to save the image data as an indexed image. When saving the first image, you need to create a GIF file, and all subsequent images can be added using the append method. The basic framework for saving a GIF file is:
pic_index = 1; % Record image numberfor i = 1:end plot(data(i)); % Capture the current figure, save it as an RGB image, then convert it to an indexed image [A,map] = rgb2ind(frame2im(getframe),256); if pic_index == 1 imwrite(A,map,'test.gif','gif','Loopcount',inf,'DelayTime',0.2); else imwrite(A,map,'test.gif','gif','WriteMode','append','DelayTime',0.2); end pic_index = pic_index + 1;end
Here, getframe is used to capture the currently drawn image, the frame2im function saves the current figure as an RGB image, and the rgb2ind function converts the RGB image into an indexed image.
An indexed image refers to a data matrix A and a color map matrix Map. The Map is a data array containing three columns and several rows, where each element’s value is a double-precision floating-point number between [0, 1]. Each row of the Map matrix represents the color values for red, green, and blue.
In MATLAB, an indexed image is a “direct mapping” from pixel values to color map values. The pixel color is indexed by the data matrix X pointing to the Map matrix, for example, value 1 points to the first row of the Map matrix, value 2 points to the second row, and so on.
The use of indexed images solves the problem of excessive memory consumption of image data matrices; an RGB image requires a three-dimensional data matrix to represent, while an indexed image only needs a one-dimensional data matrix and a map to represent.
Step 4: Similarly, draw the heart shape lines on the XOY and XOZ parallel planes, and continue saving to the GIF file.
The complete code can be obtained by replying “Dynamic Heart Shape” in the public account.
2. Creating Animated Lines in Matlab
The purpose of drawing dynamic images is generally to display the drawing process or to show images in real-time while serially acquiring data.
To achieve real-time plotting animation, we need to use the animatedline function in Matlab (Note: This function was updated after Matlab version 2014a, and versions prior to 2014a cannot implement this function).
-
an = animatedline creates an animated line with no data and adds it to the current coordinate area;
-
an = animatedline(x,y) creates an animated line with initial data points defined by x and y;
-
an = animatedline(x,y,z) creates a three-dimensional animated line with initial data points defined by x, y, and z;
-
an = animatedline(___,Name,Value) specifies animated line properties using one or more name-value pair arguments. For example, ‘Color’,’r’ sets the line color to red.
Of course, once an animated line is created, to make this line move, we need to continue adding coordinate points to it, which requires the addpoints function.
-
addpoints(an,x,y) adds two-dimensional points to the animated line an;
-
addpoints(an,x,y,z) adds three-dimensional points to the animated line an.
Thus, we can write the basic framework for implementing dynamic lines:
h = animatedline('Color','r','LineWidth',3);for k = 1:length(x) addpoints(h,x(k),y(k)); end
Based on these two functions, we can achieve the dynamic drawing effect shown above, and combined with the GIF file saving method introduced in the first section, we can also output the drawing process as a GIF file.
t = 0:0.1:2*pi;x = 16*(sin(t)).^3;y = 13*cos(t)-5*cos(2*t)-2*cos(3*t)-cos(4*t);axis off;set(gcf,'color',[1 1 1]);[A,map] = rgb2ind(frame2im(getframe),256);imwrite(A,map,'xin2.gif','LoopCount',65535,'DelayTime',0.1);h = animatedline('Color','r','LineWidth',3);for k = 1:length(x) addpoints(h,x(k),y(k)); axis([-20,20,-20,20]) [A,map] = rgb2ind(frame2im(getframe),256); imwrite(A,map,'xin2.gif','WriteMode','append','DelayTime',0.1);end
3. Looping Animation in Matlab
The movie function can create movie animations, allowing the results of a single run to be saved for multiple playbacks, and can also generate AVI video files for independent use outside of Matlab.
Before creating animations with the movie function, you need to use the moviein function to save the drawn figure data, creating a sufficiently large matrix to accommodate the frames based on the current drawing.
Once a series of animation frames have been created, the movie function can be used to run the movie animation at a specified speed and number of times. The calling format for the movie function is:
-
movie(M) plays the animation frames in matrix M once;
-
movie(M,n) plays the animation frames in matrix M n times;
-
movie(M,n,fps) plays the animation frames in matrix M n times at a speed of fps frames per second.
Next, we will demonstrate the effect of the movie function using the dynamic changes of a three-dimensional surface as an example.
x = -6:0.1:6;y = -6:0.1:6;[X,Y] = meshgrid(x,y);r = sqrt(X.^2 + Y.^2);Z = sin(r)./(r + eps);p = surf(X,Y,Z);set(p,'LineStyle','None');axis([-6,6,-6,6,-1,1])%axis off%theAxes = axis;M = moviein(20);filename = '动画.gif';for j = 0.1:0.1:10 p = surf(X,Y,sin(j*pi)*Z); axis([-6,6,-6,6,-1,1]) axis off; set(p,'LineStyle','None'); M(:,end+1) = getframe; % Output as GIF [A,map] = rgb2ind(frame2im(getframe),256); if j == 0.1 imwrite(A,map,filename,'gif', 'Loopcount',inf,'DelayTime',0.1); else imwrite(A,map,filename,'gif','WriteMode','append','DelayTime',0.1); endend% Loop 2 times to display animationmovie(M,2)
This article introduces several basic functions for drawing animations in Matlab. Based on these basic functions, combined with image processing techniques, more rich animation effects can be created.
Advanced Matlab Tutorial | Extracting Brightness from Black and White Photos to Create Color Images
Matlab Beginner Tutorial | Long-Term Investment Compound Interest Problem
Matlab Beginner Tutorial | 001 Volume of a Sphere Problem
Installation Tutorial | MATLAB 2016b~2018b Installation Tutorial