Hello everyone, this is IoT Heart. GDB is a debugging tool frequently used by Linux developers, and I believe most readers are familiar with using the gdb command to debug programs. So, are you curious:Why can gdb debug our programs? In this article, we will explore this.1. What is GDB? GDB is a debugger for programs written in languages such as C and C++. It can control the execution of programs, set breakpoints, view and modify variables, inspect stack information, and perform disassembly operations. It also supports multithreading and remote debugging, helping developers quickly locate and fix errors in their programs.2. How GDB Works GDB is a debugger implemented based on the ptrace system call, which monitors and controls the execution flow of the target process through the ptrace system call. We refer to the gdb program as the debugger and the program to be debugged as the target program. GDB and the target program have a parent-child relationship, where the gdb process is the parent process of the target process. We can understand this intuitively with a diagram, as shown in Figure 1.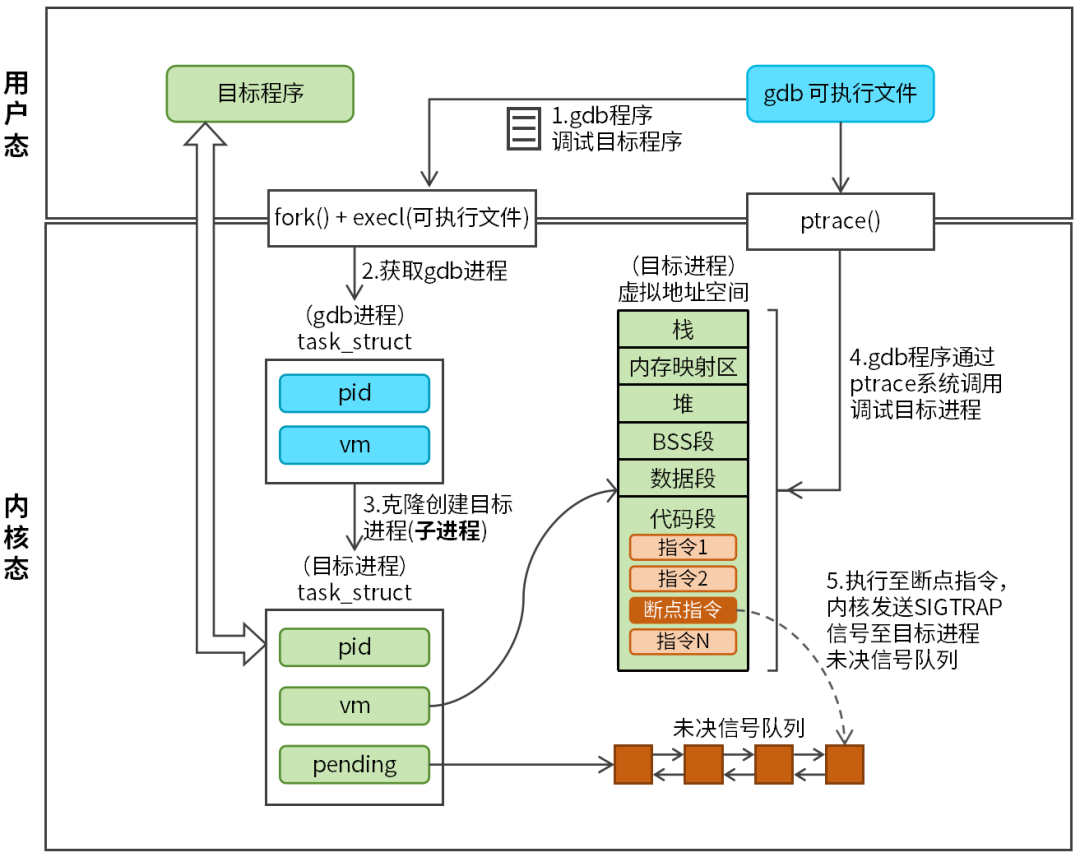 Figure 1 Working Principle of GDB When the user executes the gdb <executable file> command, the gdb program calls the fork and execl system calls to create the target process (child process). After the target process is successfully created, it needs to call the ptrace function to request the parent process (gdb program) to take over, as follows:
ptrace(PTRACE_TRACEME, 0, NULL, NULL);After the gdb program takes over the target process, gdb can control the target process through the ptrace system call. Therefore, understanding the working principle of gdb hinges on understanding the ptrace system call. Ptrace is a powerful system call in the Linux system, primarily used for process tracing and debugging. It allows one process (called the tracer or debugger) to monitor and control another process (called the tracee or target process), read and modify its registers and memory, and intercept system calls. The prototype of the ptrace function is as follows:
#include <sys/ptrace.h>
long ptrace(enum __ptrace_request op, pid_t pid,
         void *addr, void *data);
Parameter descriptions:
- request: Specifies the operation to be performed, common operations are shown in Table 1:
Table 1 Request Parameters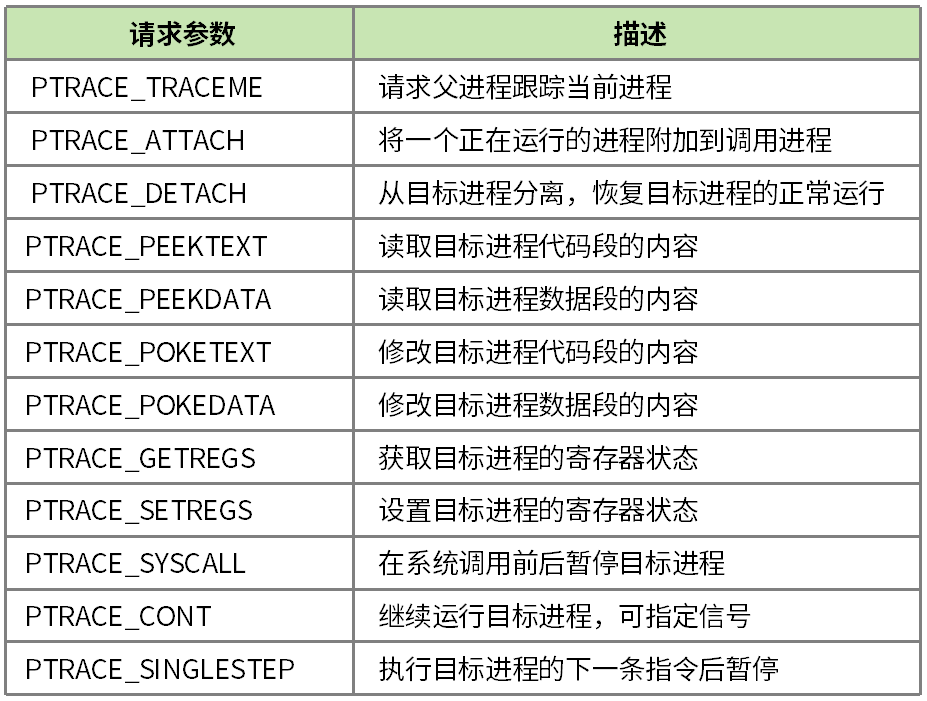
- pid: The process ID of the target process.
- addr: The memory address of the target process, used for read or write operations.
- data: The purpose of data varies depending on the request operation.
Return value: long type, the specific meaning varies according to different request operations:
-
PTRACE_PEEKTEXT and PTRACE_PEEKDATA: The return value is the content read from memory.
-
Other operations: 0 indicates success, -1 indicates failure.
Regarding the use of ptrace, we will explain it through practical examples, but for now, let’s discuss another important concept: SIGTRAP Signal.
3. SIGTRAP Signal
The SIGTRAP signal has the number 5. When the program reaches a breakpoint set by the debugger, the operating system sends a SIGTRAP signal to the program. The debugger captures this signal to pause the program’s execution, allowing the developer to inspect the program’s state, such as variable values and call stacks.
When the target process is not being traced by the debugger, the kernel’s default handling of the SIGTRAP signal is to terminate the program. Conversely, if the kernel is tracking the target process, it will pause the target process, and the debugger can capture the current state of the target process using the waitpid system call.
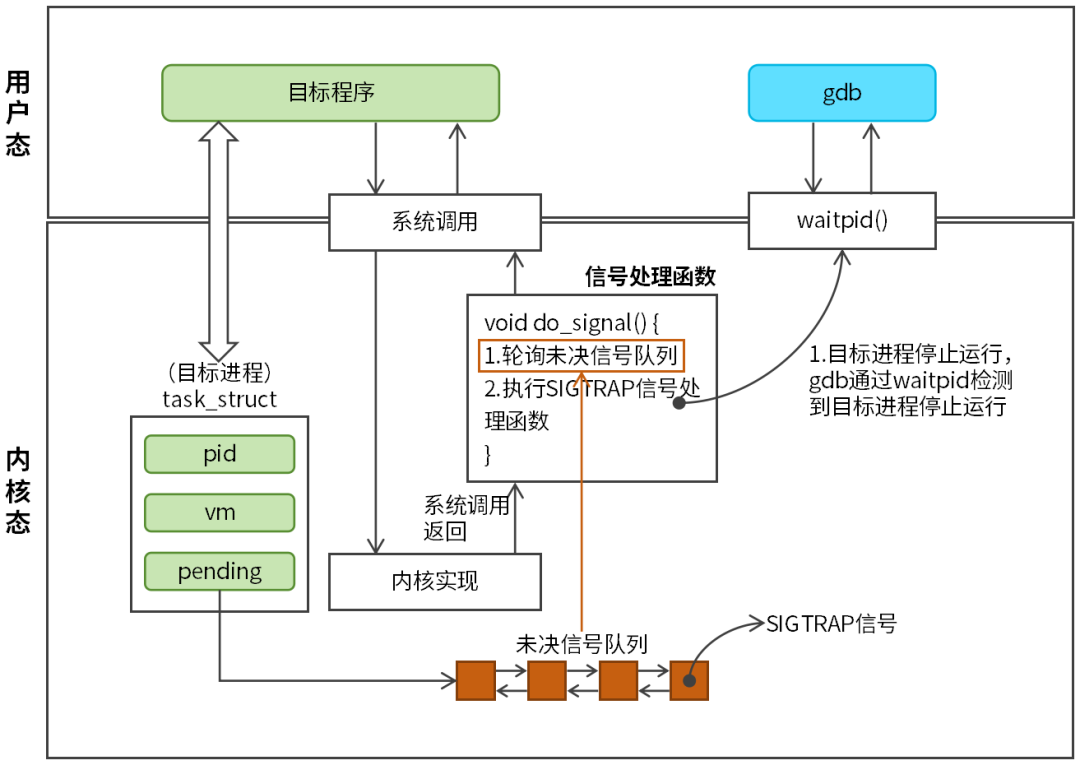 Figure 2 SIGTRAP Signal Handling Process As shown in Figure 2, when the target process executes to the breakpoint instruction or when the target process is single-stepped, the Linux kernel sends a SIGTRAP signal to the target process. The SIGTRAP signal is inserted into the target process’s pending signal queue. The handling of the SIGTRAP signal is similar to that of other signals; when the target program switches from kernel mode to user mode, the return process calls the do_signal signal handling function, which polls the pending signal queue of the target process, retrieves the pending signal from the queue, and executes the signal handling function. The SIGTRAP signal handling function pauses the target process, and the debugger can capture the target process’s halt using the waitpid function. The purpose of the SIGTRAP signal is to pause the target process and notify the debugger. This allows the debugger to implement features such as breakpoints and single-stepping based on the SIGTRAP signal.4. Setting Breakpoints in the Target Program Setting breakpoints and single-stepping are two core functions of the debugger. To further understand the gdb debugger, we will implement these two functions based on the ptrace system call. In simple terms, setting a breakpoint involves inserting a breakpoint instruction (0xCC) at a specified location in the target process’s code segment. When the target process executes the breakpoint instruction, the kernel sends a SIGTRAP signal to the target process’s pending signal queue. The SIGTRAP signal causes the target process to pause execution. At this point, the user will observe that the program stops running at the breakpoint. The principle of setting a breakpoint is illustrated in Figure 3.
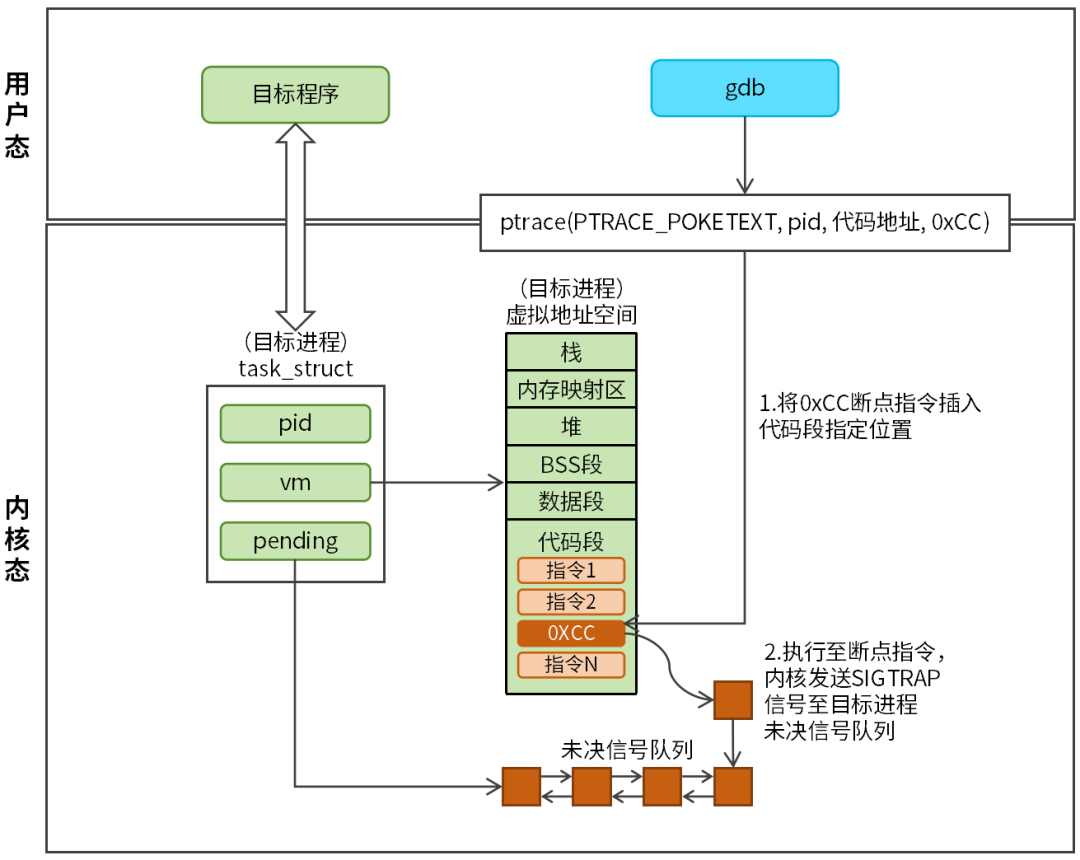 Figure 3 Setting Breakpoints in the Target Program with Ptrace The function call for setting a breakpoint is as follows:
ptrace(PTRACE_POKETEXT, pid, code_address, 0xCC)The request is PTRACE_POKETEXT, pid is set to the target process’s pid, the code_address is the specified address in the target process’s code segment, and the breakpoint instruction is 0xCC. The code address cannot be arbitrary; it must be a valid address, which can usually be directly specified using the function name, or by usingPTRACE_PEEKTEXT to first obtain the code address, and then insert the breakpoint instruction at that location. The debugger calls the ptrace function to set the breakpoint, and the kernel first retrieves the target process’s task_struct structure, then finds the target’s virtual address space code segment through the task_struct structure, and writes the breakpoint instruction to the specified location in the code segment. An example code for setting a breakpoint is as follows:
#include<stdio.h>
#include<stdlib.h>
#include<string.h>
#include<sys/ptrace.h>
#include<sys/types.h>
#include<sys/wait.h>
#include<unistd.h>
#include<sys/user.h>
#include<elf.h>

#define INT3 0xCC // Breakpoint instruction

void breakpoint_func(){ // Function address as breakpoint address
    printf("Child continue\n");
}

int breakpoint_test(){
    pid_t child = fork();
    if (child == 0) { // Child process (target process)
        // Target process is being traced by the debugger
        ptrace(PTRACE_TRACEME, 0, NULL, NULL);
        // Target process stops running
        raise(SIGSTOP);
        printf("before breakpoint\n");
        // Execute to the breakpoint instruction
        breakpoint_func();
        printf("after breakpoint\n");
        return 0;
    } else {
        wait(NULL); // Wait for the target process to pause
        // Get the breakpoint address
        void *breakpoint_addr = (void *)breakpoint_func;
        printf("sizeof(long)=%lu\n", sizeof(long));
        // Get the target process's breakpoint address code instruction, 8 bytes at a time on a 64-bit system
        long orig = ptrace(PTRACE_PEEKTEXT, child, breakpoint_addr, NULL);
        if (orig == -1) {
            perror("ptrace PEEKTEXT failed");
            return -1;
        }
        // Insert the breakpoint instruction (0xCC) using bitwise OR
        if (ptrace(PTRACE_POKETEXT, child, breakpoint_addr, (orig & ~0xFF) | INT3) == -1) {
            perror("ptrace POKETEXT failed");
            return -1;
        }
        // Target process continues running
        ptrace(PTRACE_CONT, child, NULL, NULL);
        // Handle SIGTRAP signal, waiting for the breakpoint instruction to execute
        int status;
        pid_t ret = waitpid(child, &status, WUNTRACED | WCONTINUED);
        if (ret == -1) {
            perror("waitpid failed");
            return -1;
        }

        if (WIFSTOPPED(status)) {
            printf("Child stopped by signal %d\n", WSTOPSIG(status));
        }
        // Sleep for 2 seconds to observe if the breakpoint is effective
        sleep(2);
        // Target process continues running
        ptrace(PTRACE_CONT, child, NULL, NULL);
        wait(NULL);
        printf("Child process exited\n");
    }

    return 0;
}

int main(int argc, char **argv){
    breakpoint_test();
    return 0;
}
5. Single-Stepping the Target Program Single-stepping refers to pausing the target program after executing each instruction. The kernel sends a SIGTRAP signal to the target process’s pending signal queue. The handling of the SIGTRAP signal is the same as that for breakpoints. The principle of single-stepping is illustrated in Figure 4.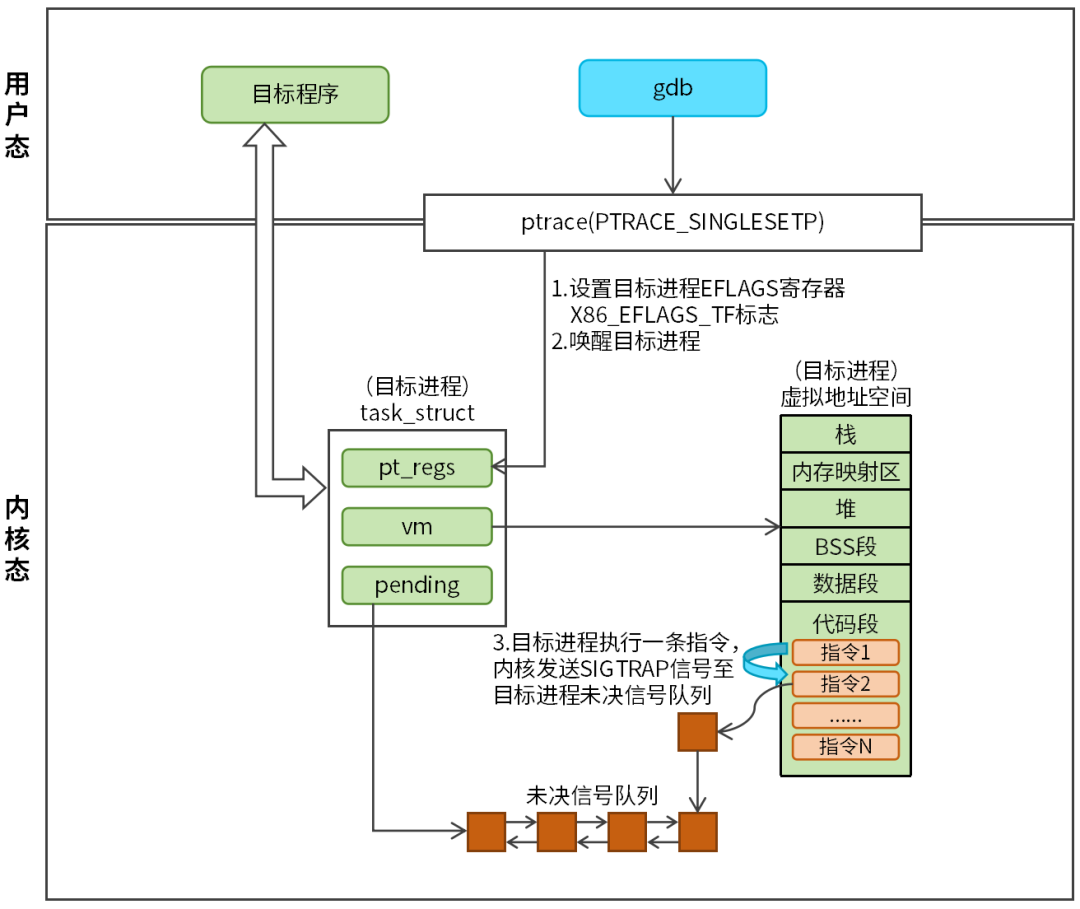 Figure 4 Single-Stepping with Ptrace The function call for single-stepping is as follows:
ptrace(PTRACE_SINGLESTEP, child, 0, 0);The request is PTRACE_SINGLESTEP, and pid is set to the target process’s pid. Single-stepping requires hardware support. The debugger calls the ptrace function to control the target process’s single-stepping, and the kernel sets the single-step flag in the corresponding register of the target process, such as the X86_EFLAGS_TF flag in the EFLAGS register for X86. Once the single-step flag is set, the target process will pause after executing one instruction, and the kernel will send a SIGTRAP signal to the target process’s pending signal queue. An example code for single-stepping is as follows:
int singlestep_test(){
    pid_t child = fork();
    if (child == 0) { // Child process (target process)
        printf("Child process, PID: %d\n", getpid());
        ptrace(PTRACE_TRACEME, 0, NULL, NULL);
        raise(SIGSTOP);
        printf("1111111111111111111\n");
        printf("2222222222222222222\n");
        printf("3333333333333333333\n");
        printf("4444444444444444444\n");
    } else {
        while (1) { // Loop to control the target process's single-stepping
            // Each single-step interval is 100 milliseconds for observation
            usleep(100 * 1000);
            // Target process single-stepping
            ptrace(PTRACE_SINGLESTEP, child, 0, 0);
            int status;
            // Handle SIGTRAP signal
            waitpid(child, &status, WUNTRACED);
            if (WIFEXITED(status)) {
                printf("Child exited with status %d\n", WEXITSTATUS(status));
                break;
            }
        }
    }
}

int main(int argc, char **argv){
    singlestep_test();
    return 0;
}
Conclusion: The gdb debugger is a very useful tool. We often focus on how to use gdb commands, but know little about the working principles of gdb. I hope this article is helpful to you.