Python 3.14 has established many of its key features, and in my opinion, it is a core version that will last for many years to come. This version sets the benchmark for the Python debugging ecosystem of the era. This article will discuss the epic improvements within the Python world.
Content
When debugging Python code in our daily work, we often encounter a problem: we need to sample the current state of the Python Runtime to further debug our Python process.
The common methods are mainly two:
- Triggering through eBPF + UProbe and other means.
- Directly reading memory blocks through Syscalls like
<span>process_vm_readv</span>.
Both methods share a core issue: how do we parse the data in memory?
Using this example, we can see how we used to approach this problem many years ago.
#define PAGE_SIZE (1<<12)
#define KASAN_STACK_ORDER 0
#define THREAD_SIZE_ORDER (2 + KASAN_STACK_ORDER)
#define THREAD_SIZE  ((__u64)(PAGE_SIZE << THREAD_SIZE_ORDER))
#define TOP_OF_KERNEL_STACK_PADDING ((__u64)0)

conststatic u32 ZERO = 0;

struct PyTypeObject {
    char _[24];
    char *tp_name;
};

struct PyObject {
    char _[8];
    struct PyTypeObject *ob_type;
};

struct PyVarObject {
    struct PyObject ob_base;
    char _[8];
};

struct PyASCIIObject {
 __u8 _[16];
 __u64 length;
 __u8 __[24];
};

struct _PyStr {
    struct PyASCIIObject ascii;
    char buf[100];
};

struct PyCodeObject {
    char _[104];
    struct _PyStr *co_filename;
    struct _PyStr *co_name;
};

struct PyFrameObject {
    struct PyVarObject ob_base;
    struct PyFrameObject *f_back;
    struct PyCodeObject *f_code;
    char _[60];
    int f_lineno;
};

struct event {
 __u64 rip;
 __u8 user_mode;
 __s8 python_stack_depth;
 __u64 filename_len[20];
 __u64 funcname_len[20];
unsignedchar filename[20][100];
unsignedchar funcname[20][100];
};

struct {
 __uint(type, BPF_MAP_TYPE_PERCPU_ARRAY);
 __uint(max_entries, 1);
 __type(key, u32);
 __type(value, struct event);
} events SEC(".maps");

struct {
 __uint(type, BPF_MAP_TYPE_RINGBUF);
 __uint(max_entries, 1<<29);
} ringbuf SEC(".maps");

SEC("perf_event/cpython310")
int perf_event_cpython310(struct bpf_perf_event_data *ctx)
{
 __u64 rsp;
struct event *event;
struct PyFrameObject *frame;

 event = bpf_map_lookup_elem(&events, &ZERO);
if (!event)
return0;

 rsp = ctx->regs.sp;
 event->rip = ctx->regs.ip;
 event->user_mode = !!(ctx->regs.cs && 3);

if (!event->user_mode) {
struct task_struct *task = (struct task_struct *)bpf_get_current_task();
  __u64 __ptr = (__u64)BPF_CORE_READ(task, stack);
  __ptr += THREAD_SIZE - TOP_OF_KERNEL_STACK_PADDING;
struct pt_regs *pt_regs = ((struct pt_regs *)__ptr) - 1;

  rsp = BPF_CORE_READ(pt_regs, sp);
  event->rip = BPF_CORE_READ(pt_regs, ip);
 }

char name[5];
bool found = false;

for (int i = 0; i < 200; i++) {
  bpf_probe_read_user(&frame, sizeof(frame), (void *)rsp + 8*i);
if (!frame)
   continue;

char *tp_name = BPF_PROBE_READ_USER(frame, ob_base.ob_base.ob_type, tp_name);
  bpf_probe_read_user(&name, sizeof(name), (void *)tp_name);
if (bpf_strncmp(name, 5, "frame") == 0) {
   found = true;
   break;
  }
 }

if (!found) {
  event->python_stack_depth = -1;
  bpf_ringbuf_output(&ringbuf, event, sizeof(*event), 0);
return0;
 }

for (int i = 0; i < 20; i++) {
  event->python_stack_depth = i;
  BPF_PROBE_READ_USER_INTO(&event->filename_len[i], frame, f_code, co_filename, ascii.length);
  BPF_PROBE_READ_USER_INTO(&event->filename[i], frame, f_code, co_filename, buf);
  BPF_PROBE_READ_USER_INTO(&event->funcname_len[i], frame, f_code, co_name, ascii.length);
  BPF_PROBE_READ_USER_INTO(&event->funcname[i], frame, f_code, co_name, buf);
  frame = BPF_PROBE_READ_USER(frame, f_back);
if (!frame)
   break;
 }

 bpf_ringbuf_output(&ringbuf, event, sizeof(*event), 0);
return0;
}

char __license[] SEC("license") = "Dual MIT/GPL";
The core code above is quite minimal; the main logic is to manually simulate the critical <span>PyFrameObject</span> structure in Python, and then continuously search in memory to match the features.
Other tools like PySpy follow a similar approach.
The core issue with this method is that the ABI of Python can change with each version, so we need to constantly adapt to different versions (for example, PySpy maintains different <span>PyFrameObject</span> structures from 3.7 to 3.12).
Is there a better way to handle this problem? Or can we locate more effectively?
Yes, Python developers know that there is a global variable in Python called <span>_PyRuntime</span>, which is of type <span>pyruntimestate</span>, and its layout is roughly as follows:
struct pyruntimestate {

    _Py_DebugOffsets debug_offsets;

    int _initialized;
    int preinitializing;
    int preinitialized;
    int core_initialized;
    int initialized;
    PyThreadState *_finalizing;
    unsignedlong _finalizing_id;
    struct pyinterpreters {
        PyMutex mutex;
        PyInterpreterState *head;

        PyInterpreterState *main;
        int64_t next_id;
    } interpreters;

    unsignedlong main_thread;
    PyThreadState *main_tstate;

    _PyXI_global_state_t xi;

    struct _pymem_allocators allocators;
    struct _obmalloc_global_state obmalloc;
    struct pyhash_runtime_state pyhash_state;
    struct _pythread_runtime_state threads;
    struct _signals_runtime_state signals;

    Py_tss_t autoTSSkey;
    Py_tss_t trashTSSkey;

    PyWideStringList orig_argv;

    struct _parser_runtime_state parser;

    struct _atexit_runtime_state atexit;
    struct _import_runtime_state imports;
    struct _ceval_runtime_state ceval;
    struct _gilstate_runtime_state {
        int check_enabled;
        PyInterpreterState *autoInterpreterState;
    } gilstate;
    struct _getargs_runtime_state {
        struct _PyArg_Parser *static_parsers;
    } getargs;
    struct _fileutils_state fileutils;
    struct _faulthandler_runtime_state faulthandler;
    struct _tracemalloc_runtime_state tracemalloc;
    struct _reftracer_runtime_state ref_tracer;

    _PyRWMutex stoptheworld_mutex;
    struct _stoptheworld_state stoptheworld;

    PyPreConfig preconfig;
    Py_OpenCodeHookFunction open_code_hook;
    void *open_code_userdata;
    struct {
        PyMutex mutex;
        struct _Py_AuditHookEntry *head;
    } audit_hooks;

    struct _py_object_runtime_state object_state;
    struct _Py_float_runtime_state float_state;
    struct _Py_unicode_runtime_state unicode_state;
    struct _types_runtime_state types;
    struct _Py_time_runtime_state time;

#if defined(__EMSCRIPTEN__) && defined(PY_CALL_TRAMPOLINE)
    int (*emscripten_count_args_function)(PyCFunctionWithKeywords func);
#endif
    struct _Py_cached_objects cached_objects;
    struct _Py_static_objects static_objects;

    PyInterpreterState _main_interpreter;

};
Sharp-eyed readers will notice that we have a core piece of code:
    struct pyinterpreters {
        PyMutex mutex;
        PyInterpreterState *head;

        PyInterpreterState *main;
        int64_t next_id;
    } interpreters;
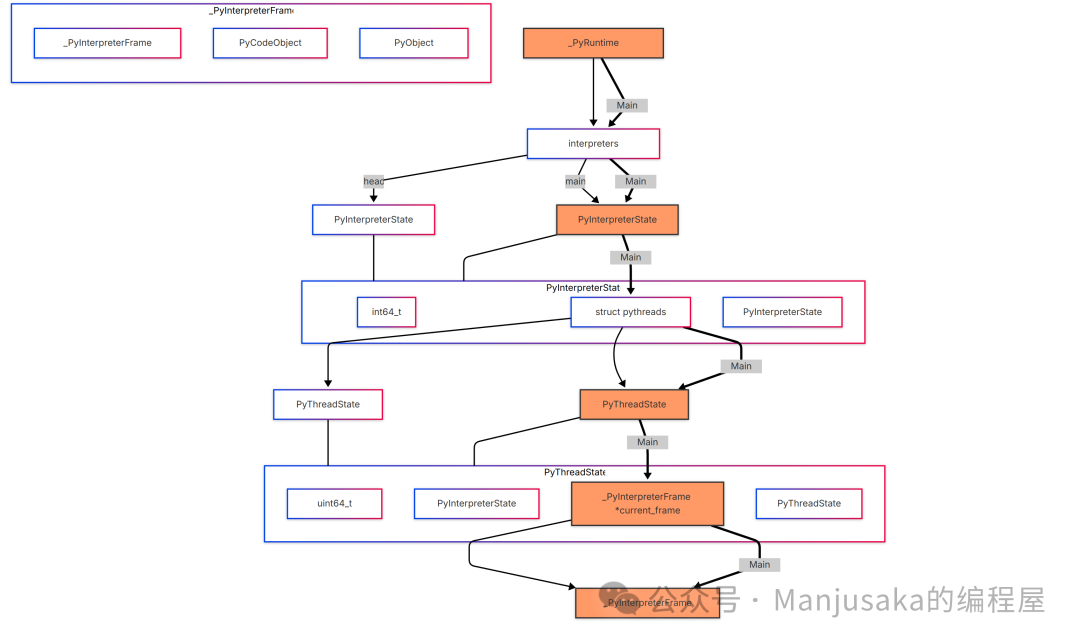
This maintains a linked list of <span>PyInterpreterState</span>, allowing us to obtain the current Frame through <span>PyInterpreterState</span>, and the ThreadState within it to get the current thread state.
    struct pythreads {
        uint64_t next_unique_id;
        /* The linked list of threads, newest first. */
        PyThreadState *head;
        _PyThreadStateImpl *preallocated;
        /* The thread currently executing in the __main__ module, if any. */
        PyThreadState *main;
        /* Used in Modules/_threadmodule.c. */
        Py_ssize_t count;
        /* Support for runtime thread stack size tuning.
           A value of 0 means using the platform's default stack size
           or the size specified by the THREAD_STACK_SIZE macro. */
        /* Used in Python/thread.c. */
        size_t stacksize;
    } threads;
And the <span>PyThreadState</span> structure and the core <span>struct _PyInterpreterFrame *current_frame</span> is the frame state we need. The entire process is roughly as follows:
Now, let’s solve the first problem: how do we obtain the address of <span>_PyRuntime</span> in memory?
We can abstract this problem into the simplest C code below:
#include <stdio.h>

int abc=3;

int main() {
    printf("abc: %p\n", &abc);
    return 0;
}
How do we get the address of abc? Those who have written C might realize that we can use the <span>__attribute__((section()))</span> syntax to place it in a specific section.
#include <stdio.h>

int abc __attribute__((section(".my_section"))) = 3;

int main() {
    printf("abc: %p\n", &abc);
    return 0;
}
We compile and use <span>readelf</span> to parse the binary.
╰─ readelf -S ./a.out| grep my_section
  [25] .my_section       PROGBITS         0000000000004018  00003018
We can see that we have obtained a relative address. Subsequently, we can traverse the ELF to find the address of the <span>abc</span> variable.
Similarly, in Python, there is a piece of code:
#define GENERATE_DEBUG_SECTION(name, declaration)     \
   _GENERATE_DEBUG_SECTION_WINDOWS(name)            \
   _GENERATE_DEBUG_SECTION_APPLE(name)              \
   declaration                                      \
   _GENERATE_DEBUG_SECTION_LINUX(name)

// Please note that section names are truncated to eight bytes
// on Windows!
#if defined(MS_WINDOWS)
#define _GENERATE_DEBUG_SECTION_WINDOWS(name)                       \
   _Pragma(Py_STRINGIFY(section(Py_STRINGIFY(name), read, write))) \
   __declspec(allocate(Py_STRINGIFY(name)))
#else
#define _GENERATE_DEBUG_SECTION_WINDOWS(name)
#endif

#if defined(__APPLE__)
#define _GENERATE_DEBUG_SECTION_APPLE(name) \
   __attribute__((section(SEG_DATA "," Py_STRINGIFY(name))))      \
   __attribute__((used))
#else
#define _GENERATE_DEBUG_SECTION_APPLE(name)
#endif

#if defined(__linux__) && (defined(__GNUC__) || defined(__clang__))
#define _GENERATE_DEBUG_SECTION_LINUX(name) \
   __attribute__((section("." Py_STRINGIFY(name))))               \
   __attribute__((used))
#else
#define _GENERATE_DEBUG_SECTION_LINUX(name)
#endif

GENERATE_DEBUG_SECTION(PyRuntime, _PyRuntime) = _PyRuntimeState_INIT(_PyRuntime, _Py_Debug_Cookie);
_Py_COMP_DIAG_POP
Thus, we can conveniently obtain the address of PyRuntime in memory.
Now, the second question is: how do we obtain the address through the call chain we introduced earlier?
Many might first think of maintaining different version data structures to get the specific address. But is there a simpler way to handle this? The answer is yes.
Sharp-eyed readers may have noticed that we have a field called <span>debug_offsets</span> in <span>pyruntimestate</span>. Let’s see how we initialize this field:
#define _Py_DebugOffsets_INIT(debug_cookie) { \
    .cookie = debug_cookie, \
    .version = PY_VERSION_HEX, \
    .free_threaded = _Py_Debug_Free_Threaded, \
    .runtime_state = { \
        .size = sizeof(_PyRuntimeState), \
        .finalizing = offsetof(_PyRuntimeState, _finalizing), \
        .interpreters_head = offsetof(_PyRuntimeState, interpreters.head), \
    }, \
    .interpreter_state = { \
        .size = sizeof(PyInterpreterState), \
        .id = offsetof(PyInterpreterState, id), \
        .next = offsetof(PyInterpreterState, next), \
        .threads_head = offsetof(PyInterpreterState, threads.head), \
        .threads_main = offsetof(PyInterpreterState, threads.main), \
        .gc = offsetof(PyInterpreterState, gc), \
        .imports_modules = offsetof(PyInterpreterState, imports.modules), \
        .sysdict = offsetof(PyInterpreterState, sysdict), \
        .builtins = offsetof(PyInterpreterState, builtins), \
        .ceval_gil = offsetof(PyInterpreterState, ceval.gil), \
        .gil_runtime_state = offsetof(PyInterpreterState, _gil), \
        .gil_runtime_state_enabled = _Py_Debug_gilruntimestate_enabled, \
        .gil_runtime_state_locked = offsetof(PyInterpreterState, _gil.locked), \
        .gil_runtime_state_holder = offsetof(PyInterpreterState, _gil.last_holder), \
    }, \
    .thread_state = { \
        .size = sizeof(PyThreadState), \
        .prev = offsetof(PyThreadState, prev), \
        .next = offsetof(PyThreadState, next), \
        .interp = offsetof(PyThreadState, interp), \
        .current_frame = offsetof(PyThreadState, current_frame), \
        .thread_id = offsetof(PyThreadState, thread_id), \
        .native_thread_id = offsetof(PyThreadState, native_thread_id), \
        .datastack_chunk = offsetof(PyThreadState, datastack_chunk), \
        .status = offsetof(PyThreadState, _status), \
    }, \
    .interpreter_frame = { \
        .size = sizeof(_PyInterpreterFrame), \
        .previous = offsetof(_PyInterpreterFrame, previous), \
        .executable = offsetof(_PyInterpreterFrame, f_executable), \
        .instr_ptr = offsetof(_PyInterpreterFrame, instr_ptr), \
        .localsplus = offsetof(_PyInterpreterFrame, localsplus), \
        .owner = offsetof(_PyInterpreterFrame, owner), \
        .stackpointer = offsetof(_PyInterpreterFrame, stackpointer), \
    }, \
    .code_object = { \
        .size = sizeof(PyCodeObject), \
        .filename = offsetof(PyCodeObject, co_filename), \
        .name = offsetof(PyCodeObject, co_name), \
        .qualname = offsetof(PyCodeObject, co_qualname), \
        .linetable = offsetof(PyCodeObject, co_linetable), \
        .firstlineno = offsetof(PyCodeObject, co_firstlineno), \
        .argcount = offsetof(PyCodeObject, co_argcount), \
        .localsplusnames = offsetof(PyCodeObject, co_localsplusnames), \
        .localspluskinds = offsetof(PyCodeObject, co_localspluskinds), \
        .co_code_adaptive = offsetof(PyCodeObject, co_code_adaptive), \
    }, \
    .pyobject = { \
        .size = sizeof(PyObject), \
        .ob_type = offsetof(PyObject, ob_type), \
    }, \
    .type_object = { \
        .size = sizeof(PyTypeObject), \
        .tp_name = offsetof(PyTypeObject, tp_name), \
        .tp_repr = offsetof(PyTypeObject, tp_repr), \
        .tp_flags = offsetof(PyTypeObject, tp_flags), \
    }, \
    .tuple_object = { \
        .size = sizeof(PyTupleObject), \
        .ob_item = offsetof(PyTupleObject, ob_item), \
        .ob_size = offsetof(PyTupleObject, ob_base.ob_size), \
    }, \
    .list_object = { \
        .size = sizeof(PyListObject), \
        .ob_item = offsetof(PyListObject, ob_item), \
        .ob_size = offsetof(PyListObject, ob_base.ob_size), \
    }, \
    .set_object = { \
        .size = sizeof(PySetObject), \
        .used = offsetof(PySetObject, used), \
        .table = offsetof(PySetObject, table), \
        .mask = offsetof(PySetObject, mask), \
    }, \
    .dict_object = { \
        .size = sizeof(PyDictObject), \
        .ma_keys = offsetof(PyDictObject, ma_keys), \
        .ma_values = offsetof(PyDictObject, ma_values), \
    }, \
    .float_object = { \
        .size = sizeof(PyFloatObject), \
        .ob_fval = offsetof(PyFloatObject, ob_fval), \
    }, \
    .long_object = { \
        .size = sizeof(PyLongObject), \
        .lv_tag = offsetof(PyLongObject, long_value.lv_tag), \
        .ob_digit = offsetof(PyLongObject, long_value.ob_digit), \
    }, \
    .bytes_object = { \
        .size = sizeof(PyBytesObject), \
        .ob_size = offsetof(PyBytesObject, ob_base.ob_size), \
        .ob_sval = offsetof(PyBytesObject, ob_sval), \
    }, \
    .unicode_object = { \
        .size = sizeof(PyUnicodeObject), \
        .state = offsetof(PyUnicodeObject, _base._base.state), \
        .length = offsetof(PyUnicodeObject, _base._base.length), \
        .asciiobject_size = sizeof(PyASCIIObject), \
    }, \
    .gc = { \
        .size = sizeof(struct _gc_runtime_state), \
        .collecting = offsetof(struct _gc_runtime_state, collecting), \
    }, \
    .gen_object = { \
        .size = sizeof(PyGenObject), \
        .gi_name = offsetof(PyGenObject, gi_name), \
        .gi_iframe = offsetof(PyGenObject, gi_iframe), \
        .gi_frame_state = offsetof(PyGenObject, gi_frame_state), \
    }, \
    .debugger_support = { \
        .eval_breaker = offsetof(PyThreadState, eval_breaker), \
        .remote_debugger_support = offsetof(PyThreadState, remote_debugger_support),  \
        .remote_debugging_enabled = offsetof(PyInterpreterState, config.remote_debug),  \
        .debugger_pending_call = offsetof(_PyRemoteDebuggerSupport, debugger_pending_call),  \
        .debugger_script_path = offsetof(_PyRemoteDebuggerSupport, debugger_script_path),  \
        .debugger_script_path_size = MAX_SCRIPT_PATH_SIZE, \
    }, \
}
We can see that we use the classic macro <span>offsetof</span> to write the offsets of commonly used fields relative to the structure into <span>debug_offsets</span>. The <span>debug_offsets</span> will always exist as the first field in <span>pyruntimestate</span>, and its frequency of change is relatively low, so we can use <span>debugger_support</span> to obtain the offsets of different addresses to get the final data we want.
With this approach, we can actually do many interesting things. In fact, the official Python team has proposed PEP 768 – Safe external debugger interface for CPython here, which allows users to remotely inject a debugging code into a Python process.
Let’s take a look at the core implementation of this PEP.
A new structure has been added to the previously mentioned ThreadState:
typedef struct _remote_debugger_support {
    int32_t debugger_pending_call;
    char debugger_script_path[MAX_SCRIPT_PATH_SIZE];
} _PyRemoteDebuggerSupport;
During execution, if <span>debugger_pending_call</span> is set to 1, we will execute the script in <span>debugger_script_path</span>.
int _PyRunRemoteDebugger(PyThreadState *tstate)
{
    const PyConfig *config = _PyInterpreterState_GetConfig(tstate->interp);
    if (config->remote_debug == 1
         && tstate->remote_debugger_support.debugger_pending_call == 1)
    {
        tstate->remote_debugger_support.debugger_pending_call = 0;

        // Immediately make a copy in case of a race with another debugger
        // process that's trying to write to the buffer. At least this way
        // we'll be internally consistent: what we audit is what we run.
        constsize_t pathsz
            = sizeof(tstate->remote_debugger_support.debugger_script_path);

        char *path = PyMem_Malloc(pathsz);
        if (path) {
            // And don't assume the debugger correctly null terminated it.
            memcpy(
                path,
                tstate->remote_debugger_support.debugger_script_path,
                pathsz);
            path[pathsz - 1] = '\0';
            if (*path) {
                run_remote_debugger_script(path);
            }
            PyMem_Free(path);
        }
    }
    return0;
}
Now the question arises: how do we inject the corresponding values into the target Python process? Let’s take a look at the implementation in <span>remote_debugging.c</span>.
The entry function is <span>_PySysRemoteDebug_SendExec</span>.
int
_PySysRemoteDebug_SendExec(int pid, int tid, constchar *debugger_script_path)
{
#if !defined(Py_SUPPORTS_REMOTE_DEBUG)
    PyErr_SetString(PyExc_RuntimeError, "Remote debugging is not supported on this platform");
    return-1;
#elif !defined(Py_REMOTE_DEBUG)
    PyErr_SetString(PyExc_RuntimeError, "Remote debugging support has not been compiled in");
    return-1;
#else

    PyThreadState *tstate = _PyThreadState_GET();
    const PyConfig *config = _PyInterpreterState_GetConfig(tstate->interp);
    if (config->remote_debug != 1) {
        PyErr_SetString(PyExc_RuntimeError, "Remote debugging is not enabled");
        return-1;
    }

    proc_handle_t handle;
    if (init_proc_handle(&handle, pid) < 0) {
        return-1;
    }

    int rc = send_exec_to_proc_handle(&handle, tid, debugger_script_path);
    cleanup_proc_handle(&handle);
    return rc;
#endif
}
The preceding code consists of some routine checks. Now let’s look at the <span>send_exec_to_proc_handle</span> function.
static int
send_exec_to_proc_handle(proc_handle_t *handle, int tid, const char *debugger_script_path)
{
    uintptr_t runtime_start_address;
    struct _Py_DebugOffsets debug_offsets;

    if (read_offsets(handle, &runtime_start_address, &debug_offsets)) {
        return-1;
    }

    uintptr_t interpreter_state_list_head = (uintptr_t)debug_offsets.runtime_state.interpreters_head;

    uintptr_t interpreter_state_addr;
    if (0 != read_memory(
            handle,
            runtime_start_address + interpreter_state_list_head,
            sizeof(void*),
            &interpreter_state_addr))
    {
        return-1;
    }

    if (interpreter_state_addr == 0) {
        PyErr_SetString(PyExc_RuntimeError, "Can't find a running interpreter in the remote process");
        return-1;
    }

    int is_remote_debugging_enabled = 0;
    if (0 != read_memory(
            handle,
            interpreter_state_addr + debug_offsets.debugger_support.remote_debugging_enabled,
            sizeof(int),
            &is_remote_debugging_enabled))
    {
        return-1;
    }

    if (is_remote_debugging_enabled != 1) {
        PyErr_SetString(
            PyExc_RuntimeError,
            "Remote debugging is not enabled in the remote process");
        return-1;
    }

    uintptr_t thread_state_addr;
    unsignedlong this_tid = 0;

    if (tid != 0) {
        if (0 != read_memory(
                handle,
                interpreter_state_addr + debug_offsets.interpreter_state.threads_head,
                sizeof(void*),
                &thread_state_addr))
        {
            return-1;
        }
        while (thread_state_addr != 0) {
            if (0 != read_memory(
                    handle,
                    thread_state_addr + debug_offsets.thread_state.native_thread_id,
                    sizeof(this_tid),
                    &this_tid))
            {
                return-1;
            }

            if (this_tid == (unsignedlong)tid) {
                break;
            }

            if (0 != read_memory(
                    handle,
                    thread_state_addr + debug_offsets.thread_state.next,
                    sizeof(void*),
                    &thread_state_addr))
            {
                return-1;
            }
        }

        if (thread_state_addr == 0) {
            PyErr_SetString(
                PyExc_RuntimeError,
                "Can't find the specified thread in the remote process");
            return-1;
        }
    } else {
        if (0 != read_memory(
                handle,
                interpreter_state_addr + debug_offsets.interpreter_state.threads_main,
                sizeof(void*),
                &thread_state_addr))
        {
            return-1;
        }

        if (thread_state_addr == 0) {
            PyErr_SetString(PyExc_RuntimeError, "Can't find the main thread in the remote process");
            return-1;
        }
    }

    // Ensure our path is not too long
    if (debug_offsets.debugger_support.debugger_script_path_size <= strlen(debugger_script_path)) {
        PyErr_SetString(PyExc_ValueError, "Debugger script path is too long");
        return-1;
    }

    uintptr_t debugger_script_path_addr = (uintptr_t)(
        thread_state_addr +
        debug_offsets.debugger_support.remote_debugger_support +
        debug_offsets.debugger_support.debugger_script_path);
    if (0 != write_memory(
            handle,
            debugger_script_path_addr,
            strlen(debugger_script_path) + 1,
            debugger_script_path))
    {
        return-1;
    }

    int pending_call = 1;
    uintptr_t debugger_pending_call_addr = (uintptr_t)(
        thread_state_addr +
        debug_offsets.debugger_support.remote_debugger_support +
        debug_offsets.debugger_support.debugger_pending_call);
    if (0 != write_memory(
            handle,
            debugger_pending_call_addr,
            sizeof(int),
            &pending_call))
    {
        return-1;
    }

    uintptr_t eval_breaker;
    if (0 != read_memory(
            handle,
            thread_state_addr + debug_offsets.debugger_support.eval_breaker,
            sizeof(uintptr_t),
            &eval_breaker))
    {
        return-1;
    }

    eval_breaker |= _PY_EVAL_PLEASE_STOP_BIT;

    if (0 != write_memory(
            handle,
            thread_state_addr + (uintptr_t)debug_offsets.debugger_support.eval_breaker,
            sizeof(uintptr_t),
            &eval_breaker))
    {
        return-1;
    }

    return0;
}
The logic of this function is quite clear: it retrieves the target address offsets using <span>read_offsets</span>, reads different addresses using <span>read_memory</span>, and after some processing, writes into the target process using <span>write_memory</span>.
The <span>read_offsets</span> function is the core function we previously mentioned regarding how to use the debugging information provided by Python. Let’s take a look at its implementation on Linux.
static int
read_offsets(
    proc_handle_t *handle,
    uintptr_t *runtime_start_address,
    _Py_DebugOffsets* debug_offsets
) {
    if (_Py_RemoteDebug_ReadDebugOffsets(handle, runtime_start_address, debug_offsets)) {
        return -1;
    }
    if (ensure_debug_offset_compatibility(debug_offsets)) {
        return -1;
    }
    return 0;
}
The core function here is <span>_Py_RemoteDebug_ReadDebugOffsets</span>. Let’s take a look at its implementation.
static int
_Py_RemoteDebug_ReadDebugOffsets(
    proc_handle_t *handle,
    uintptr_t *runtime_start_address,
    _Py_DebugOffsets* debug_offsets
) {
    *runtime_start_address = _Py_RemoteDebug_GetPyRuntimeAddress(handle);
    if (!*runtime_start_address) {
        if (!PyErr_Occurred()) {
            PyErr_SetString(
                PyExc_RuntimeError, "Failed to get PyRuntime address");
        }
        return-1;
    }
    size_t size = sizeof(struct _Py_DebugOffsets);
    if (0 != _Py_RemoteDebug_ReadRemoteMemory(handle, *runtime_start_address, size, debug_offsets)) {
        return-1;
    }
    return0;
}
We notice that the core here is to first obtain the address of <span>PyRuntime</span>. Now let’s look at the implementation of <span>_Py_RemoteDebug_GetPyRuntimeAddress</span>.
static uintptr_t
_Py_RemoteDebug_GetPyRuntimeAddress(proc_handle_t* handle)
{
    uintptr_t address;
    address = search_linux_map_for_section(handle, "PyRuntime", "python");
    if (address == 0) {
        // Error out: 'python' substring covers both executable and DLL
        PyErr_SetString(PyExc_RuntimeError, "Failed to find the PyRuntime section in the process.");
    }
    return address;
}

static uintptr_t
search_linux_map_for_section(proc_handle_t *handle, const char* secname, const char* substr)
{
    char maps_file_path[64];
    sprintf(maps_file_path, "/proc/%d/maps", handle->pid);

    FILE* maps_file = fopen(maps_file_path, "r");
    if (maps_file == NULL) {
        PyErr_SetFromErrno(PyExc_OSError);
        return0;
    }

    size_t linelen = 0;
    size_t linesz = PATH_MAX;
    char *line = PyMem_Malloc(linesz);
    if (!line) {
        fclose(maps_file);
        PyErr_NoMemory();
        return0;
    }

    uintptr_t retval = 0;
    while (fgets(line + linelen, linesz - linelen, maps_file) != NULL) {
        linelen = strlen(line);
        if (line[linelen - 1] != '\n') {
            // Read a partial line: realloc and keep reading where we left off.
            // Note that even the last line will be terminated by a newline.
            linesz *= 2;
            char *biggerline = PyMem_Realloc(line, linesz);
            if (!biggerline) {
                PyMem_Free(line);
                fclose(maps_file);
                PyErr_NoMemory();
                return0;
            }
            line = biggerline;
            continue;
        }

        // Read a full line: strip the newline
        line[linelen - 1] = '\0';
        // and prepare to read the next line into the start of the buffer.
        linelen = 0;

        unsignedlong start = 0;
        unsignedlong path_pos = 0;
        sscanf(line, "%lx-%*x %*s %*s %*s %*s %ln", &start, &path_pos);

        if (!path_pos) {
            // Line didn't match our format string.  This shouldn't be
            // possible, but let's be defensive and skip the line.
            continue;
        }

        constchar *path = line + path_pos;
        constchar *filename = strrchr(path, '/');
        if (filename) {
            filename++;  // Move past the '/'
        } else {
            filename = path;  // No directories, or an empty string
        }

        if (strstr(filename, substr)) {
            retval = search_elf_file_for_section(handle, secname, start, path);
            if (retval) {
                break;
            }
        }
    }

    PyMem_Free(line);
    fclose(maps_file);

    return retval;
}
Here we can see that <span>_Py_RemoteDebug_GetPyRuntimeAddress</span> calls <span>search_linux_map_for_section</span> to obtain the current address of <span>PyRuntime</span>, and <span>search_linux_map_for_section</span> traverses the memory segments in <span>/proc/${pid}/maps</span> to find the specific address.
Now let’s look at the implementation of <span>search_elf_file_for_section</span>.
search_elf_file_for_section(
proc_handle_t *handle,
constchar* secname,
uintptr_t start_address,
constchar *elf_file)
{
if (start_address == 0) {
return0;
}
uintptr_t result = 0;
void* file_memory = NULL;
int fd = open(elf_file, O_RDONLY);
if (fd < 0) {
PyErr_SetFromErrno(PyExc_OSError);
gotoexit;
}
struct stat file_stats;
if (fstat(fd, &file_stats) != 0) {
PyErr_SetFromErrno(PyExc_OSError);
gotoexit;
}
file_memory = mmap(NULL, file_stats.st_size, PROT_READ, MAP_PRIVATE, fd, 0);
if (file_memory == MAP_FAILED) {
PyErr_SetFromErrno(PyExc_OSError);
gotoexit;
}
Elf_Ehdr* elf_header = (Elf_Ehdr*)file_memory;
Elf_Shdr* section_header_table = (Elf_Shdr*)(file_memory + elf_header->e_shoff);
Elf_Shdr* shstrtab_section = §ion_header_table[elf_header->e_shstrndx];
char* shstrtab = (char*)(file_memory + shstrtab_section->sh_offset);
Elf_Shdr* section = NULL;
for (int i = 0; i < elf_header->e_shnum; i++) {
char* this_sec_name = shstrtab + section_header_table[i].sh_name;
// Move 1 character to account for the leading "."
this_sec_name += 1;
if (strcmp(secname, this_sec_name) == 0) {
section = §ion_header_table[i];
break;
}
}
Elf_Phdr* program_header_table = (Elf_Phdr*)(file_memory + elf_header->e_phoff);
// Find the first PT_LOAD segment
Elf_Phdr* first_load_segment = NULL;
for (int i = 0; i < elf_header->e_phnum; i++) {
if (program_header_table[i].p_type == PT_LOAD) {
first_load_segment = &program_header_table[i];
break;
}
}
if (section != NULL && first_load_segment != NULL) {
uintptr_t elf_load_addr = first_load_segment->p_vaddr
- (first_load_segment->p_vaddr % first_load_segment->p_align);
result = start_address + (uintptr_t)section->sh_addr - elf_load_addr;
}
exit:
if (file_memory != NULL) {
munmap(file_memory, file_stats.st_size);
}
if (fd >= 0 && close(fd) != 0) {
PyErr_SetFromErrno(PyExc_OSError);
}
return result;
}
This code is a bit complex, so let’s break it down.
First, the function declaration:
search_elf_file_for_section(
        proc_handle_t *handle,
        const char* secname,
        uintptr_t start_address,
        const char *elf_file)
This function is used to search for a specific section in an ELF file. The parameters include: process handle, section name to search for, starting address (the mapped position of the file in the process space), and the ELF file path.
int fd = open(elf_file, O_RDONLY);
if (fd < 0) {
    PyErr_SetFromErrno(PyExc_OSError);
    goto exit;
}
Open the ELF file in read-only mode. If it fails, set a Python exception and jump to exit handling.
file_memory = mmap(NULL, file_stats.st_size, PROT_READ, MAP_PRIVATE, fd, 0);
if (file_memory == MAP_FAILED) {
    PyErr_SetFromErrno(PyExc_OSError);
    goto exit;
}
Map the file content into memory in read-only and private mode, starting from the file header. If it fails, set an exception and exit.
Elf_Ehdr* elf_header = (Elf_Ehdr*)file_memory;
Elf_Shdr* section_header_table = (Elf_Shdr*)(file_memory + elf_header->e_shoff);
Cast the file header to the ELF file header structure and find the location of the section header table, which is at the file offset e_shoff.
Elf_Shdr* shstrtab_section = §ion_header_table[elf_header->e_shstrndx];
char* shstrtab = (char*)(file_memory + shstrtab_section->sh_offset);
Elf_Shdr* section = NULL;
for (int i = 0; i < elf_header->e_shnum; i++) {
char* this_sec_name = shstrtab + section_header_table[i].sh_name;
// Move 1 character to account for the leading "."
this_sec_name += 1;
if (strcmp(secname, this_sec_name) == 0) {
section = §ion_header_table[i];
break;
}
}
Get the section string table (which contains the names of all sections) and locate it using e_shstrndx. At the same time, traverse all sections to find the matching section name. Note that we need to skip the leading ‘.’ in the section name.
Elf_Phdr* program_header_table = (Elf_Phdr*)(file_memory + elf_header->e_phoff);
// Find the first PT_LOAD segment
Elf_Phdr* first_load_segment = NULL;
for (int i = 0; i < elf_header->e_phnum; i++) {
    if (program_header_table[i].p_type == PT_LOAD) {
        first_load_segment = &program_header_table[i];
        break;
    }
}
Find the program header table and search for the first PT_LOAD type segment, which defines the base address when the program is loaded.
if (section != NULL && first_load_segment != NULL) {
    uintptr_t elf_load_addr = first_load_segment->p_vaddr
        - (first_load_segment->p_vaddr % first_load_segment->p_align);
    result = start_address + (uintptr_t)section->sh_addr - elf_load_addr;
}
If the target section and the first LOAD segment are found, calculate the runtime address of the target section:
- Calculate the ELF file’s loading base address (considering alignment).
- Target address = mapped starting address in the process + section’s virtual address – ELF loading base address.
Through this process, we can ultimately obtain the address of <span>_PyRuntime</span>, and based on this, do some interesting work, including PEP 768.
Conclusion
Python 3.14 has officially formed a relatively stable ABI for process information in a semi-formalized manner, allowing our debugging tools to perform non-intrusive debugging and observation of Python processes more effectively. PEP 768 is an effective product of this process. Tools like Remote PDB debug, based on PEP 768, have already been merged into the branch.
It can be said that starting from Python 3.14, the debugging tools and methods for Python will be greatly enriched and enhanced. I recommend everyone to upgrade as soon as it is released.
That’s about it.