Previously, we introduced kprobes in the Linux kernel, which is a dynamic tracing technology specifically for the Linux kernel space. In this article, we will introduce a similar technology called uprobes (User Space Probe), which, as the name suggests, focuses on dynamic tracing in the Linux user space. It allows developers to set probes at any location in user-space programs to collect runtime information, aiding in user-space debugging and performance analysis.Using uprobes in a Linux system does not require us to install additional tools; we can utilize the interfaces provided by the debugfs filesystem, which is one reason I appreciate uprobes. Another advantage is that tracking programs with uprobes does not require writing code; you only need to execute a few commands.
To enable the uprobes feature, you need to configure CONFIG_UPROBE_EVENTS=y during kernel compilation. Before using uprobe, you also need to ensure that the debugfs filesystem is mounted. If it is not mounted, you can use the following command to mount it.
mount -t debugfs nodev /sys/kernel/debugIn simple terms, using uprobes involves four steps:
-
Add probe points through /sys/kernel/tracing/uprobe_events.
-
Enable the probe points through /sys/kernel/tracing/events/uprobes/<EVENT>/enable.
-
Run the target program to trigger the probe points.
-
View the tracing results through /sys/kernel/debug/tracing/trace.
To add a uprobe probe point to debugfs, you need to write a string that conforms to a specific format to the (pseudo) file: /sys/kernel/tracing/uprobe_events. The rules are as follows:
-
p[:[GRP/][EVENT]] PATH:OFFSET [FETCHARGS]: Set uprobe.
-
r[:[GRP/][EVENT]] PATH:OFFSET [FETCHARGS]: Set return uprobe (uretprobe).
-
-:[GRP/][EVENT]: Clear uprobe or uretprobe events.
The fields in brackets are optional, and their meanings are as follows:
-
GRP: Group name (default is “uprobes”), optional.
-
EVENT: Event name (if omitted, generated based on PATH+OFFSET), optional.
-
PATH: Path of the executable file or library, mandatory.
-
OFFSET: Offset where the probe point is inserted, mandatory.
-
FETCHARGS: Parameters for the probe point, optional.
The main parameter types for uprobe are as follows:
-
%REG: Get register values, such as %di, %si, %dx, etc.
-
@ADDR: Get the content of a user-space memory address.
-
$stackN: Get the N-th item from the stack (N≥0), which can be used to obtain parameters from the stack.
-
$retval: Get the return value (only for return probes), which can also be obtained from register %ax.
-
$comm: Get the current process name.
Next, we will demonstrate how to use uprobes with a simple example.
First, we write a simple program to serve as the target for tracing. The code below calls the add function to compute the sum of two numbers and return the result. Our goal is to trace the calls to the add function and its exit, capturing the parameters for each call and the return value upon exit.
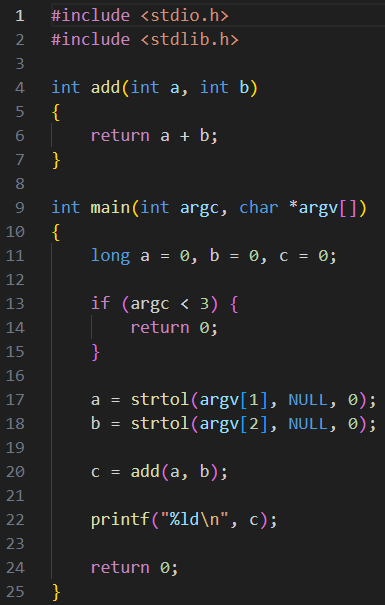
Compile this program to obtain the executable file mytest. To use uprobes with debugfs, we first need to obtain the address of the function we want to trace. We can use the nm command to view the address of the add function in the executable file mytest. Here, we find that the address of the add function is 0x1169.
 Knowing the address of the add function, we can construct the string to add the uprobe. The command to add a uprobe at the entry point of the add function is as follows. The path to the executable file can be absolute or relative (provided that the command to add the uprobe is executed in the directory where the program is located).
echo 'p:add_entry ./mytest:0x1169 %di %si' > /sys/kernel/debug/tracing/uprobe_events Since we also want to capture the return value when the add function exits, we need to add a uretprobe for that function. The command is as follows; note that we need to use append (>>), otherwise the previously added add_entry probe will be overwritten.
echo 'r:add_exit ./mytest:0x1169 %ax' >> /sys/kernel/debug/tracing/uprobe_events After adding the add_entry and add_exit probes, we can use cat to check uprobe_events to confirm that these two probes exist.
Once the probes are added, use the following command to enable all currently added probes.
echo 1 > /sys/kernel/debug/tracing/events/uprobes/enableYou can also selectively enable probes, for example, only enabling the add_entry probe.
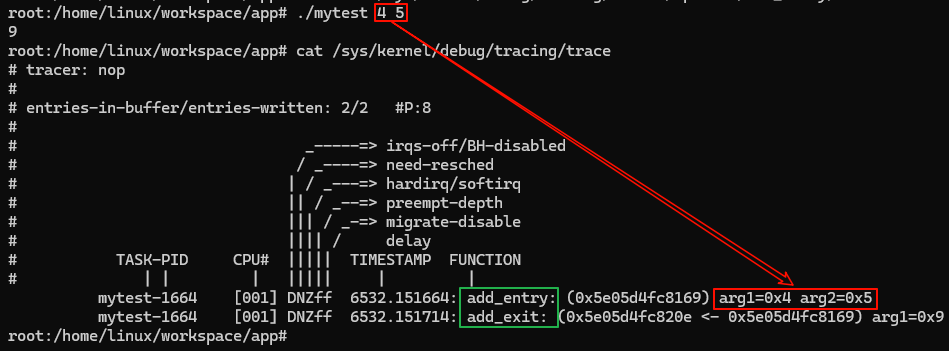
echo 1 > /sys/kernel/debug/tracing/events/uprobes/add_entry/enableAfter enabling the probes, you can run the program, at which point the probes will be triggered, and you can view the tracing results. From the results below, it can be seen that both the add_entry and add_exit probes were triggered, successfully capturing their parameters.
After completing the experiment, remember to clear the probes. You must first disable the probes before clearing them; otherwise, you will encounter a “Device or resource busy” error.
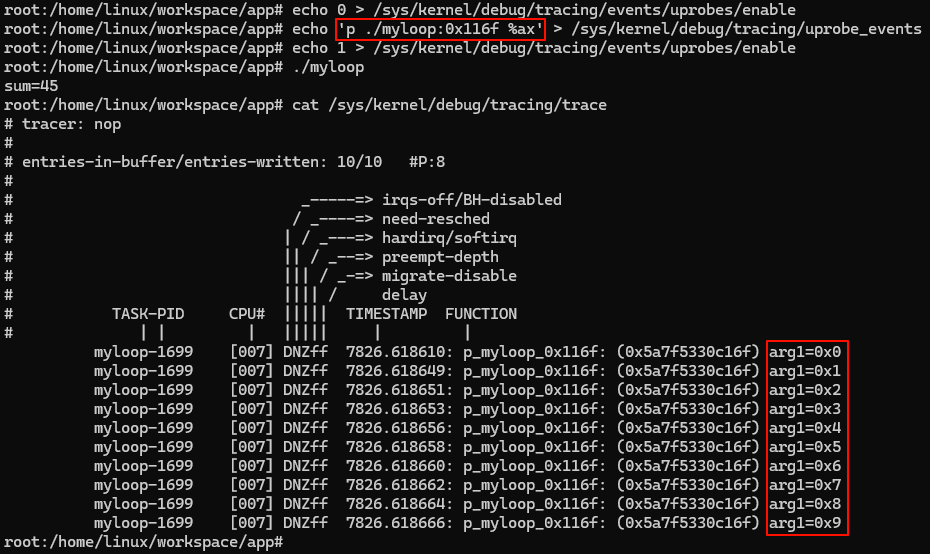
echo 0 > /sys/kernel/debug/tracing/events/uprobes/enableecho > /sys/kernel/debug/tracing/uprobe_eventsIn addition to adding probes at the entry and exit of functions, uprobes can also add probes in the middle of functions, but this requires familiarity with the assembly code of the function. For example, in the program below, we want to track the changes in the loop index of the summation for loop.
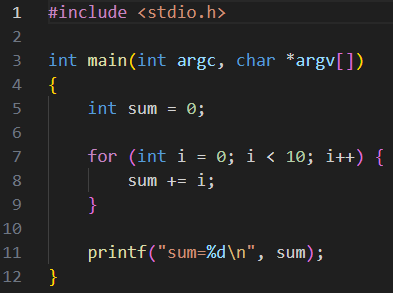
After compiling this program, we need to disassemble it. Below is the result of disassembly using objdump. Upon analysis, we find that the loop index of the for loop is placed in register eax at the instruction just before the offset 0x116f, so placing a probe at 0x116f will allow us to capture the value of the loop index.
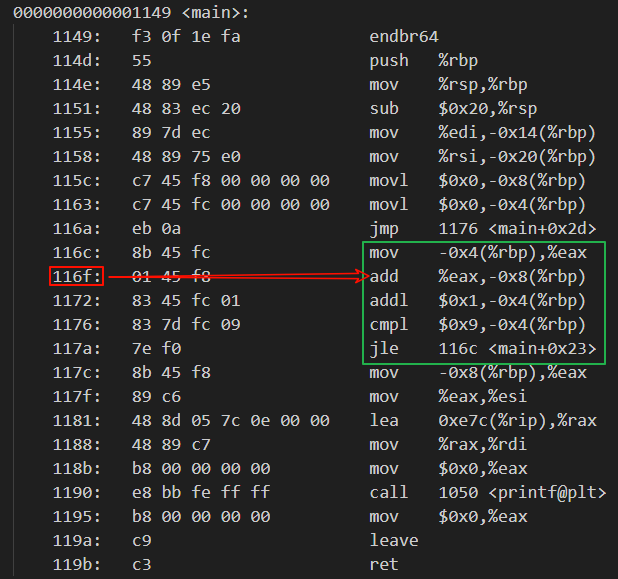
We can add probes in the following manner to track the changes in the loop index during each iteration of the for loop.
 In fact, in addition to these more primitive methods, uprobes can also be used in conjunction with perf or eBPF, making it more convenient, such as not having to calculate the probe addresses manually.By mastering uprobes, developers can gain a deeper understanding of application behavior, enabling them to more effectively resolve complex issues and optimize system performance.