




Mount Lushan




2023 Lushan Taohuayuan Station Advanced Software Debugging Workshop
LINUX Platform
Advanced Debugging and Optimization
There is an overwhelming amount of information about LINUX, and there are many ways to learn it. How can we achieve significant improvement in a relatively short time?
The “2023 Advanced Software Debugging Workshop Lushan Taohuayuan Station” will explore the best answers to this question with all LINUX enthusiasts. Following the principles of being lively and interesting, and closely combining theory with practice, this workshop uniquely chooses the culturally rich Lushan scenic area to create a unique immersive learning experience through closed training; using the sword of debugging to navigate the complex world of LINUX; with the spirit of exploration, we will delve into the core mechanisms of the LINUX system, seeking one principle at a time, advancing step by step.
This workshop will be taught by Zhang Yinkui, the author of “Software Debugging” and “GeDu Assembly”.
The entire workshop aims to achieve three main objectives:
01/
Deep Understanding of the LINUX Operating System
Infrastructure and Core Mechanisms
02/
Learning Tools and Methods for Developing LINUX Programs (Kernel Modules
and Application Programs)
03/
Learning Debugging Tools on the LINUX Platform
and Methods for Debugging Typical Problems
Time
March 17-19, 2023 (Friday to Sunday)
Three days and two nights of closed training, discussing and debating
Location
Lushan Taohuayuan Scenic Area
Format
Lectures, Practical Exercises, and Q&A Discussions
Target Audience
Software engineers, project leaders, and technical managers engaged in development or testing on the Linux platform
Organizer
GeDu Information Technology (Shanghai) Co., Ltd., High-end Debugging Website
Part One 1 hour
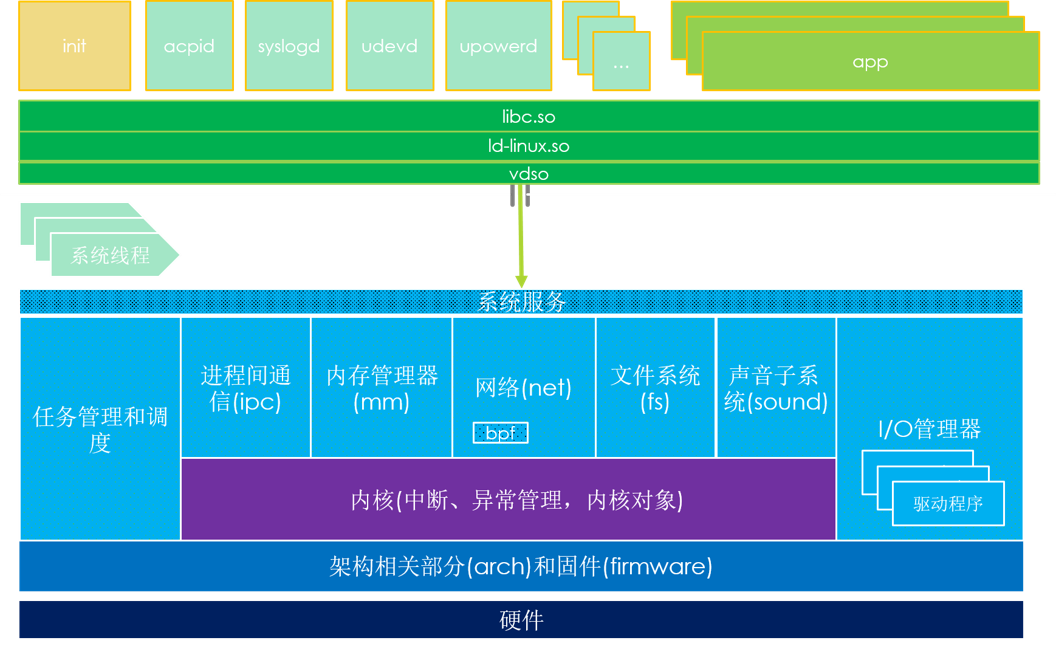
Overview of LINUX
Key Points: GNU, distributions, Trinity, the two forces driving Linux, kernel source code tree, key components of the two major spaces, system calls, strace, vdso, GNU, glibc, kernel parameters, observing the current kernel’s compilation options, kernel documentation.
Part Two 1 hour
GDB Essentials
Key Points: Born for freedom, the legend of Richard Stallman, the birth of GDB, GDB versions, GDB architecture and working principles, ptrace, command types, command syntax, commonly used commands, debugging symbols, DWARF, symbol files, downloading Ubuntu’s symbol packages and source code, ELF structure, readelf, methods for finding symbols, stack backtrace (bt), software breakpoints, hardware breakpoints, complex breakpoint commands, controlling threads.
Part Three 1 hour
Application Crashes and Dumps
Key Points: Signal overview, signal masking, setting signal handlers, understanding ancient exception handling methods, setjmp, longjmp, segmentation faults, examples of segmentation faults, core files, ulimit, core_pattern, Ubuntu’s error collection mechanism, aport, analyzing core files, local analysis, cross-machine analysis, best practices for analyzing core files.
Practice 1 0.5 hour
Debugging with GDB
Background services crashing due to segmentation faults
Important background services (Daemon) in Linux randomly crash, digging deep into the cause, surprisingly related to the C language specifications, making you deeply aware of a major difference between C and C++, experiencing the famous header file trap; familiarizing with the following tools and main skills: GDB, GCC, map, dmesg, debugging Linux applications, disassembly, inserting code JIT debugging; reviewing the following knowledge points: virtual memory, paging mechanisms, page tables, page faults, segmentation faults, null pointers, AT&T assembly and Intel assembly, calling conventions.
Part Four 1.5 hours
Using the Code Gun and NanoCode
Debugging the LINUX Kernel
Key Points: Challenges of kernel debugging, fundamentals of CoreSight technology, basic usage of the code gun, loading symbols, observing kernel modules, setting breakpoints, call stacks, observing processes and threads, commonly used kernel debugging commands.
Practice 2
Using Hardware Debuggers
Mastering the LINUX Kernel
Using the code gun hardware debugger to debug the GDK8 system, carefully exploring the wild LINUX kernel.
Part Five 1.5 hours
File Systems
Key Points: “Everything is a file”, file system architecture, components, file operations, device file systems, using kernel debuggers to help understand file systems, EXT FS, Reiser FS, four core objects, pseudo file systems, proc fs (principles, key codes, important applications, meminfo, maps, etc.), sysfs, debug fs.
Practice 3
Using LINUX Dual Machine Kernel
Debugging the Mystery of Handle Confusion
When the application communicates with the driver, the driver always receives incorrect data, which is printed for observation, surprisingly it is log information sent to the driver, using KGDB to analyze the communication process between the application layer program and the driver, analyzing the reason for data confusion, understanding the virtual file system, Linux drivers, sysfs, standard files, and other theoretical aspects.
Part Six 1.5 hours
Task Management
Key Points: Processes and threads, LWP, task structures, dual use, process attributes, thread structures, kernel mode stacks, methods for finding kernel mode stacks, kernel mode stack overflow; scheduling queues, observing queue lengths, thread priorities, thread schedulers, methods for calculating time slices for each task, algorithms for selecting the currently running task, strace, advanced usage of the ps command, pstree, top, using strace for simple tuning.
Part Seven 1.5 hours
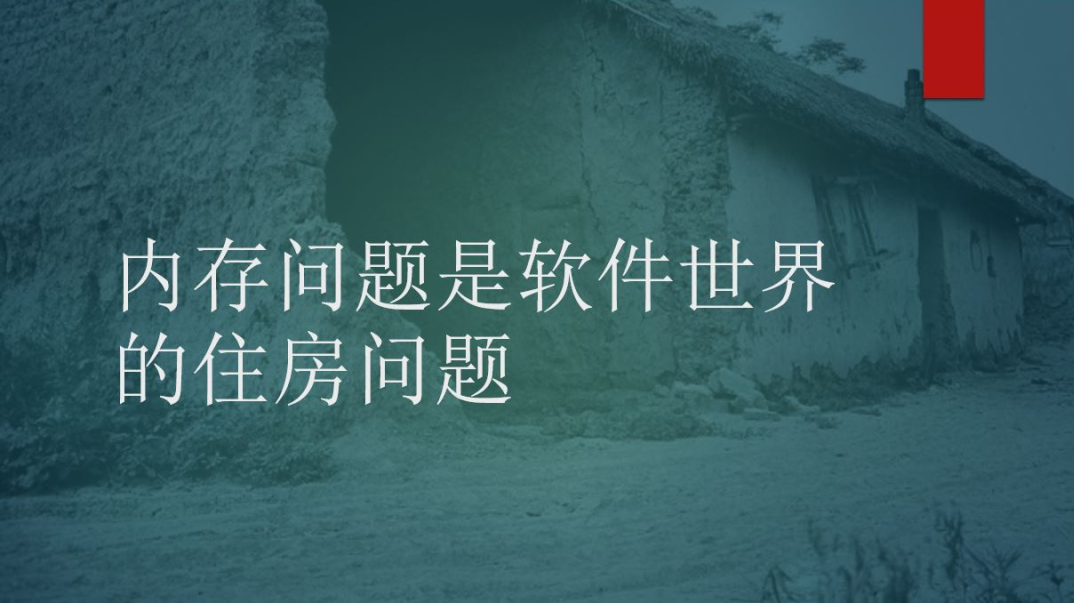
Memory Management (Part One)
Key Points: Physical memory, from core to DRAM, NUMA, page, pfn, page table management, TLB, MMU, page faults, observing page faults, virtual memory, swap partitions, anonymous and non-anonymous swaps, process address space, vma, maps, vmstat, active and inactive memory, kernel pools, observing memory usage from /proc/meminfo, in-depth analysis of meminfo information.
Practice 4
Dialog with the Memory Manager
Writing and modifying kernel drivers (LKM), loading drivers, allocating memory in various ways, and observing changes in memory overhead through different methods, understanding the principles of memory allocation, key terms, and learning the usage of various observation tools.
Part Eight 1.5 hours
Memory Management (Part Two)
Key Points: User space heap, ptmalloc, arena, heap, layout of the main arena, creation of auxiliary arenas, heap block structure, allocation strategies, bin, organization of bins, allocation process, release process, heap-related errors, fault debugging, valgrind, working principles of valgrind, Address Sanitizer (ASan), working principles of ASan, shadow records, checking processes, additional overhead.
Practice 5
Using valgrind
Debugging Typical Heap Errors
The heap is fragile and cannot withstand many tests (overflows, multiple releases, wild pointers…), and the most powerful weapon to solve these problems in Linux is valgrind, using the GeMalloc program personally written by Old Lei as a sample, simulating various heap errors, and capturing them one by one using valgrind.
Part Nine 1.5 hours
Kernel Module and Driver Development
Key Points: Loadable Kernel Modules (LKM), init and exit, three types of devices, character devices, block devices, network devices, softirq and tasklets, pnp, udevinfo, system calls, communication with applications, ioctl, file read/write, typical device driver analysis eMMC, SD, USB (controller, HUB, device, data transfer).
Part Ten 1 hour
System Crashes
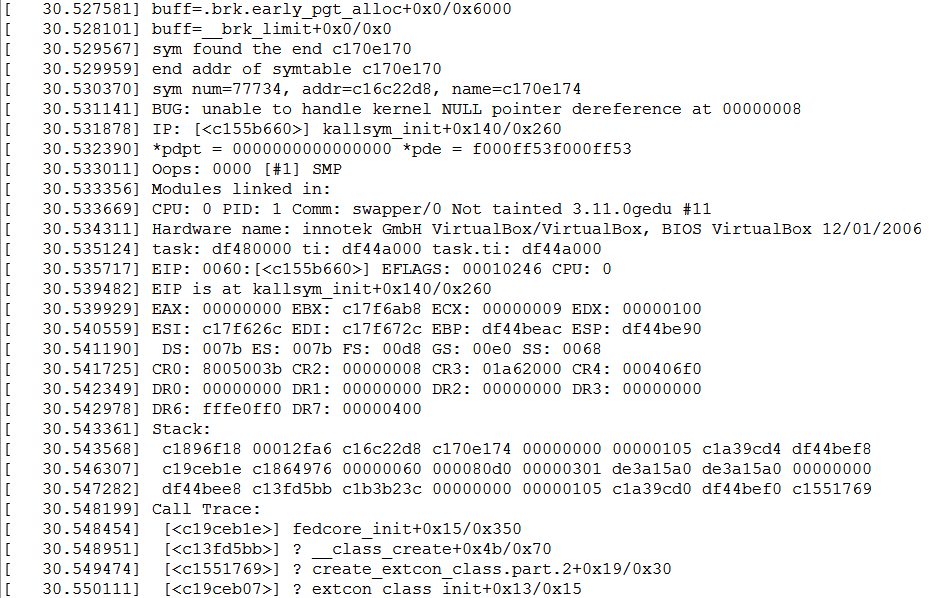
Key Points: OOPS and Panic, Panic information format, Die, implementation code under ARCH, the most common Panic, detailed interpretation of Oops information.
Practice 6
Analyzing the Causes of System Panic
Triggering kernel Oops and Panic through LKM (kernel mode stack overflow, segmentation faults, and NMI watchdog timeout), understanding Oops output, analyzing kernel Panic projects, and parsing the whole process.
Part Eleven 1 hour
Kernel Messages
Key Points: Kernel debugging facilities, printk, vprintk_emit, message levels, message header structures, structured information output, facility, logger, syslog, console, syslogd, /dev/kmsg, implicit locks, dynamic control of message output, structured messages, application of structured messages in PnP.
Part Twelve 1.5 hours
Tuning and Event Tracing
(ftrace and perf)
Key Points: Two basic methods for testing performance, Sampling, Instrumentation, background of tracing mechanisms, brief history of ftrace, working principles of ftrace, tracing points, file system interface, user markers, enabling tracing, reading trace data, Kernshark, observing thread time slices being preempted, observing interrupt handling processes, perf, typical usage of perf, selecting CPU counters, perf usage examples (statistical sources of page faults).
Instructor Introduction
”
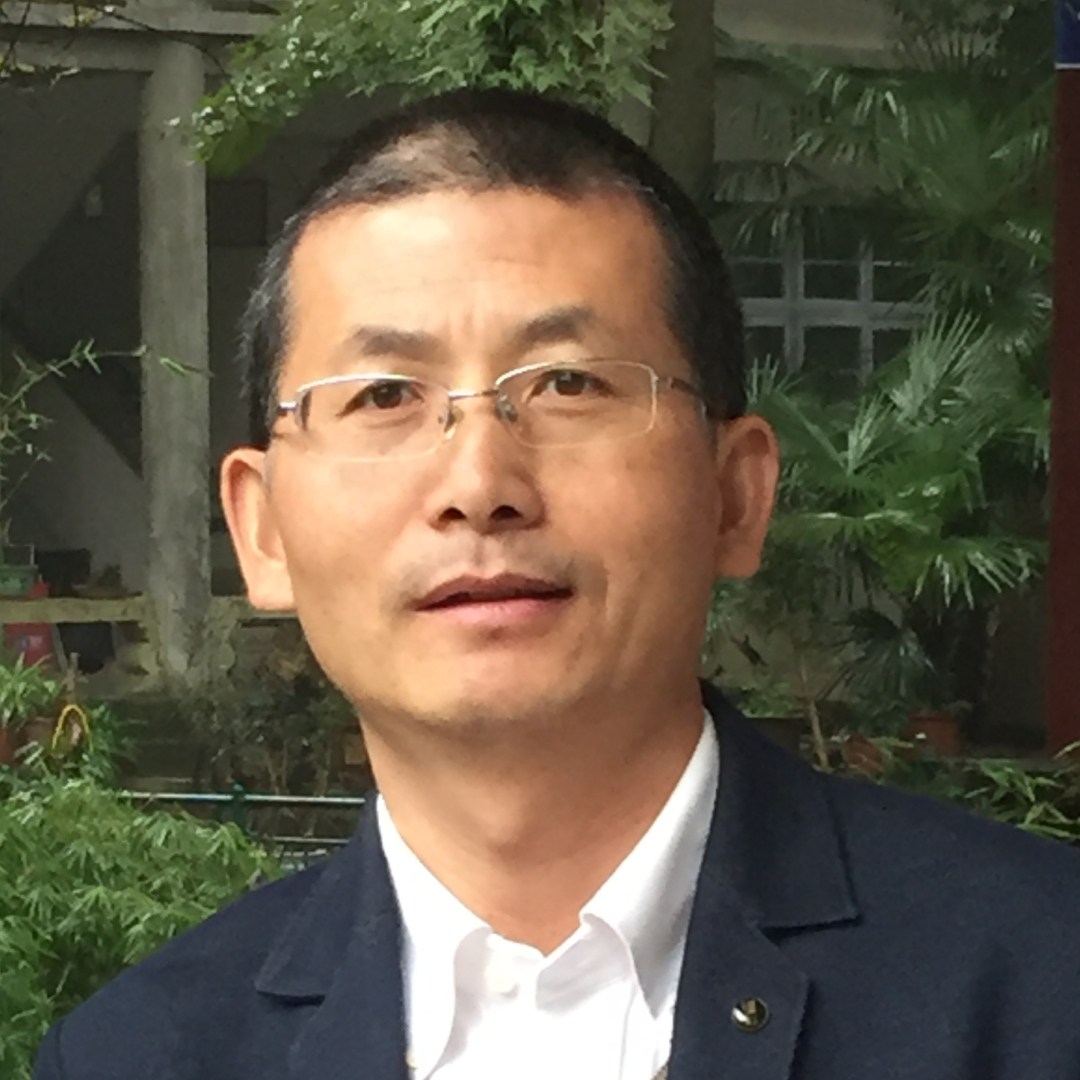
Zhang Yinkui (Raymond Zhang)
Nicknamed “Old Lei of GeDu”, graduated in 1996 from Shanghai Jiao Tong University with a degree in Information and Control Engineering. He has worked in the software industry for over 20 years, spending more than half of that time at Intel’s Shanghai Research and Development Center, working in various departments including PASD, DEG, CPG, PCCG, and VPG. In his spare time, he enjoys writing and participating in various technical conferences, having published millions of words discussing various software issues, among which articles like “Viewing Alibaba’s Software Legion in Debuggers” are widely circulated. Since 2015, he has been awarded Microsoft’s Most Valuable Professional (MVP) globally. He is the author of “Software Debugging” and “GeDu Assembly” and has previously contributed to the “Sword of Debugging” column in Programmer Magazine.
He has held positions as a development engineer, software architect, development manager, and project manager in several multinational companies, with in-depth research on IA-32 architecture, operating system kernels, drivers, virtualization technology, cloud computing, software optimization, and especially software debugging. Since 2005, he has been publicly teaching courses on “Windows Kernel and Advanced Debugging” and has given lectures on topics such as “Evolution of Windows Vista Kernel”, “Sword of Debugging” (Global Software Warfare Research Summit), “Understanding and Reflecting on the Power of Debuggers” (CSDN SD2.0 Conference), “Windows Boot Process”, and “How to Diagnose and Debug Blue Screen Errors” (the last three lectures are part of Microsoft’s “In-depth Research on Windows Internal Principles Series”). He has also translated (or co-translated) works such as “Modern x86 Assembly Language Programming”, “21st Century Robotics”, “The Creation of NT and the Future’s Deadly Rush”, “Principles of Data Mining”, “Machine Learning”, and “Artificial Intelligence: Structure and Strategies for Solving Complex Problems”.
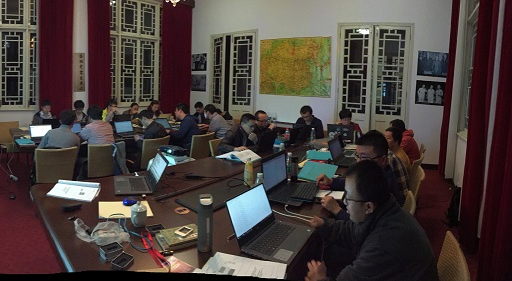
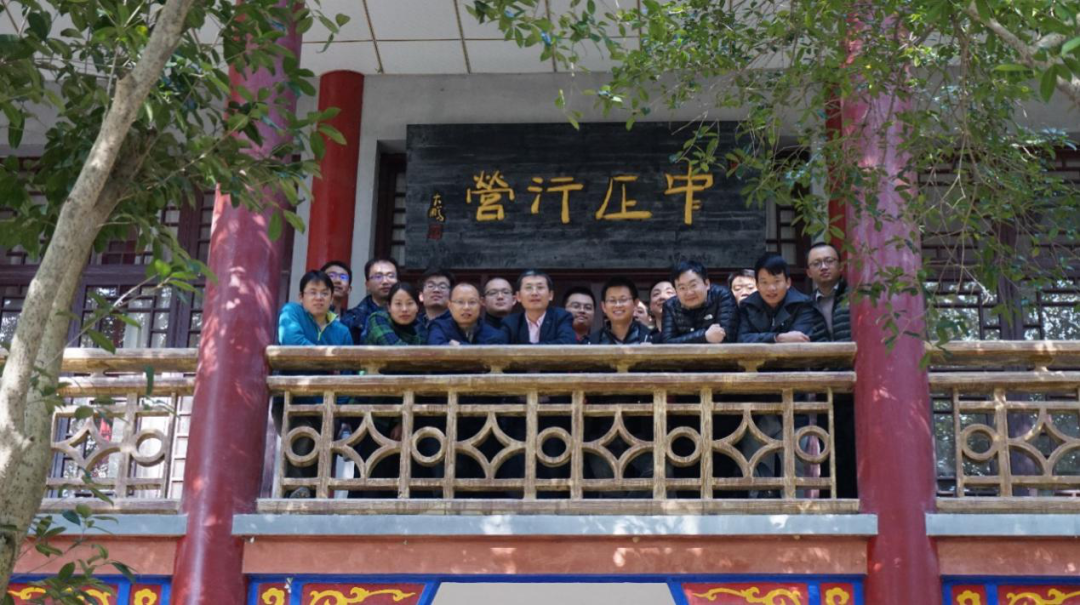
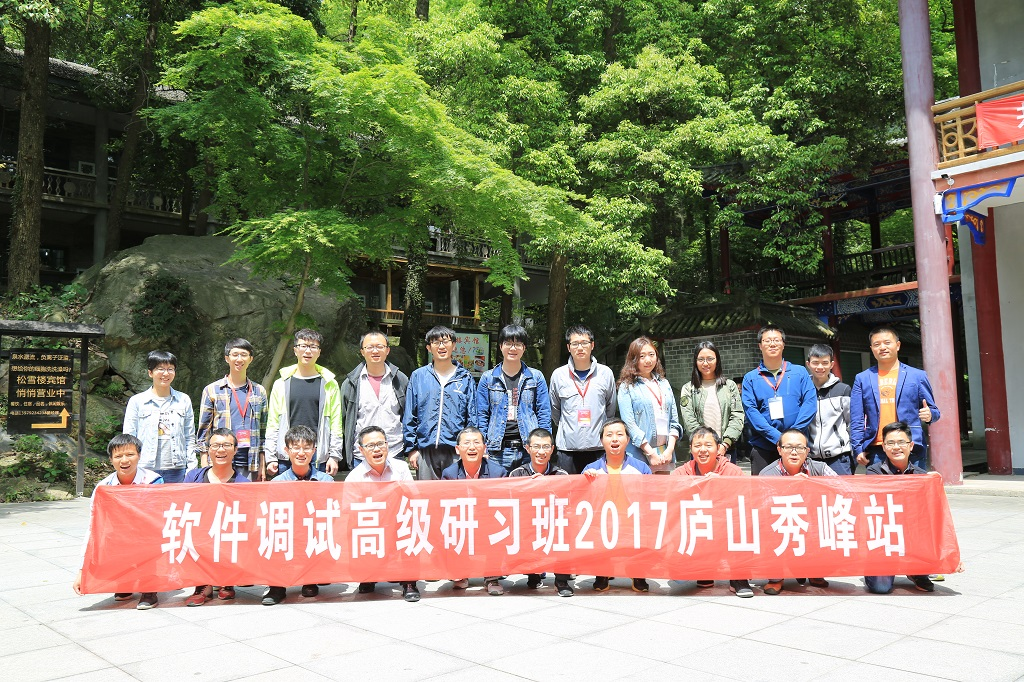
Appendix 1: Photos from Previous Workshops
01
02
03
04

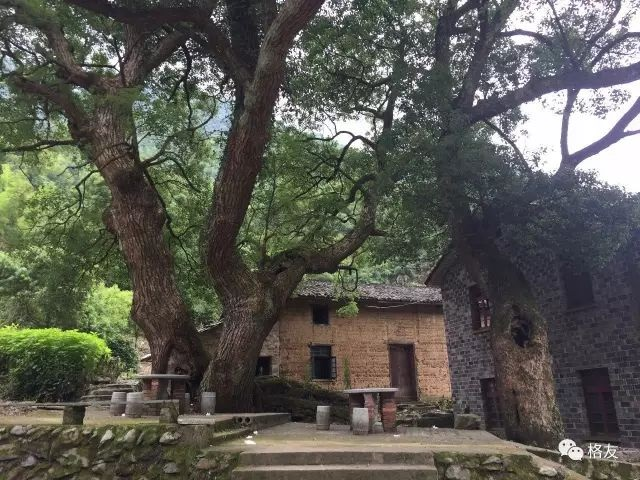
Appendix 2: Some Sceneries of Lushan Taohuayuan Scenic Area
01
02

Appendix 3: Registration and Fees
Standard Fee: 6200 yuan / per person
Includes:
-
A set of hardware debugger based on ARM CoreSight technology
-
A set of GDK8 development kit containing ARMv8 SoC and Ubuntu system
-
Preview copy of “A Brief History of Software” signed by the author
-
Accommodation, meals (breakfast, lunch, and dinner), and snacks during the workshop
-
Entrance ticket to Lushan Taohuayuan Scenic Area (for students and others eligible for free admission, this part of the fee is non-refundable and non-reducible)
-
Accident insurance during the workshop
-
Printed lecture notes

Not Included:
-
Transportation costs to and from Lushan and other expenses beyond the above fees
Discount Terms:
-
If 6 people from the same unit register, one person’s fee will be waived.
-
Registering 15 days before the workshop starts can enjoy a 10% discount.
-
Students or individuals self-funding to participate should contact course consultants for information on discount prices (which vary depending on the registration time).
Registration or Inquiry
Taylor
Email: [email protected]
WeChat: 16622192370
QQ: 1468084390
Lisa
Email: [email protected]
WeChat: 13801874134
QQ: 545417515
Company Payment Information
Account Name: GeDu Information Technology (Shanghai) Co., Ltd.
Bank: China Merchants Bank Co., Ltd. Shanghai Pujiang Branch
Account Number: 1219 3085 8010 501

About Shengge Academy
Shengge Academy is a knowledge sharing platform under GeDu Technology, based on the educational philosophy of “GeWu ZhiZhi”. Following the idea of inheriting the essence of traditional culture, Shengge Academy strives to closely integrate the essence of traditional culture with modern technology, explaining modern technology through traditional culture and humanistic feelings, and using modern technology to disseminate traditional culture.
Access Methods
Mobile End: Search “Shengge Academy” in WeChat Mini Program
Computer End: Download the Nano Code Community Edition client
https://nanocode.cn/#/download

GeDu Friends Official Account

Shengge Academy Mini Program
Previous Highlights Recommendation
Interesting is Tasty
There is a kind of love called Taohuayuan
Practical FreeRTOS UsageFault Exception
Analysis of HDMI Hot Plug Process Based on DRM Framework