Click the “Yudao Source Code” above and select “Set as Favorite”
What does it matter if it’s the old or the new wave?
The wave that can surf is the good wave!
Every day at 10:33 we update articles, losing a bit of hair every day…
Quality Source Code Column
-
Original | The Super God Path of Java 2021, very intense~
-
Open-source projects with detailed comments in Chinese
-
RPC framework Dubbo source code analysis
-
Network application framework Netty source code analysis
-
Message middleware RocketMQ source code analysis
-
Database middleware Sharding-JDBC and MyCAT source code analysis
-
Job scheduling middleware Elastic-Job source code analysis
-
Distributed transaction middleware TCC-Transaction source code analysis
-
Eureka and Hystrix source code analysis
-
Java concurrency source code
Source: juejin.cn/post/
7114540497187635208
- Introduction
- Usage Scenarios
- Installation
- Common Commands
- Others
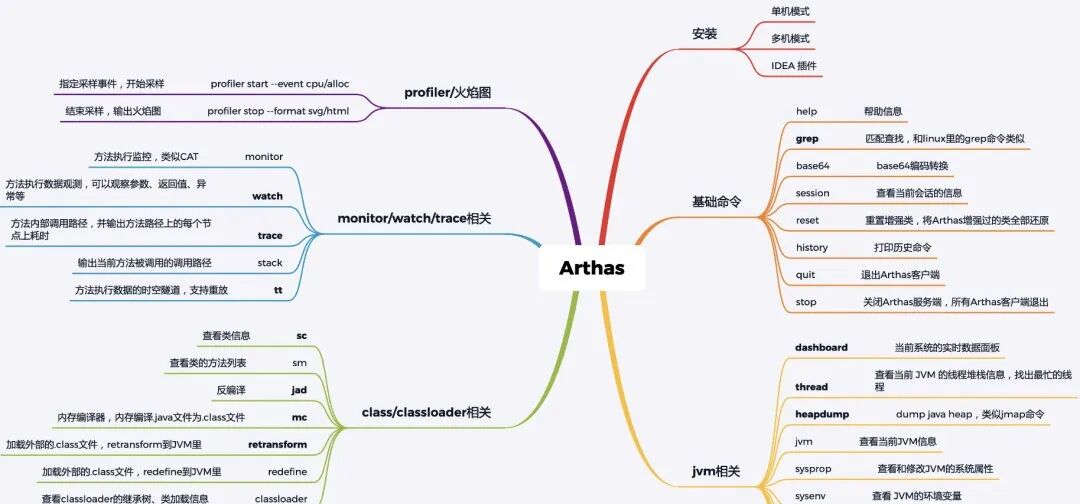
Introduction
Arthas is an open-source Java diagnostic tool from Alibaba that dynamically tracks Java code; it monitors JVM status in real-time and can easily troubleshoot JVM-related issues without interrupting program execution. It supports JDK 6+, and is compatible with Linux/Mac/Windows. This tool is really useful and very easy to get started with, highly recommended.
A backend management system + user mini-program implemented based on Spring Boot + MyBatis Plus + Vue & Element, supporting RBAC dynamic permissions, multi-tenancy, data permissions, workflows, third-party login, payment, SMS, e-commerce, and other functions.
- Project address: https://gitee.com/zhijiantianya/ruoyi-vue-pro
- Video tutorial: https://doc.iocoder.cn/video/
Usage Scenarios
- Which jar package is this class loaded from? Why are various class-related exceptions being thrown?
- Why is the code I modified not being executed? Did I forget to commit? Is the branch wrong?
- If I encounter a problem that cannot be debugged online, do I have to add logs and redeploy?
- There is a problem with data processing for a certain user online, but I cannot debug online, and I cannot reproduce it offline!
- Is there a global view to see the system’s operational status?
- Is there a way to monitor the real-time running status of the JVM?
Next, let’s learn the basic usage of Arthas around these six questions.
A backend management system + user mini-program implemented based on Spring Cloud Alibaba + Gateway + Nacos + RocketMQ + Vue & Element, supporting RBAC dynamic permissions, multi-tenancy, data permissions, workflows, third-party login, payment, SMS, e-commerce, and other functions.
- Project address: https://gitee.com/zhijiantianya/yudao-cloud
- Video tutorial: https://doc.iocoder.cn/video/
Installation
Execute the command below to download
wget https://alibaba.github.io/arthas/arthas-boot.jar
Start it using java -jar
java -jar arthas-boot.jar

[INFO] Found existing java process, please choose one and hit RETURN.
* [1]: 79952 cn.test.MobileApplication
  [2]: 93872 org.jetbrains.jps.cmdline.Launcher
Then enter the number to select the application you want to monitor and press Enter.
You can also download the related arthas jar here: http://repository.sonatype.org/service/local/artifact/maven/redirect?r=central-proxy&g=com.taobao.arthas&a=arthas-packaging&e=zip&c=bin&v=LATEST
Common Commands
Current version v3.1.4
[arthas@79952]$ version
3.1.4
1. stack
Outputs the call path of the current method being called.
Often we know a method is being executed, but there are many places calling it, and we don’t know who is calling it; at this point, you need the stack command.
| Parameter Name | Parameter Description |
|---|---|
| class-pattern | Class name expression matching |
| method-pattern | Method name expression matching |
[arthas@79952]$ stack com.baomidou.mybatisplus.extension.service.IService getOne
Press Q or Ctrl+C to abort.
Affect(class-cnt:202 , method-cnt:209) cost in 10761 ms.
ts=2019-11-13 11:49:13;thread_name=http-nio-8801-exec-6;id=2d;is_daemon=true;priority=5;TCCL=org.springframework.boot.web.embedded.tomcat.TomcatEmbeddedWebappClassLoader@a6c54c3
    @com.baomidou.mybatisplus.extension.service.impl.ServiceImpl.getOne()
        at com.baomidou.mybatisplus.extension.service.IService.getOne(IService.java:230)
        ...... ......
        at cn.test.mobile.controller.order.OrderController.getOrderInfo(OrderController.java:500)
You can see that line 500 of OrderController.java calls this getOne interface.
Note that this command needs to be called before it will trigger logs; similar commands include watch, trace, etc.
2. jad
Decompiles the source code of the specified loaded class.
Sometimes, after a version is released, the code does not execute; is the code the latest? At this point, you can use jad to decompile the corresponding class.
jad cn.test.mobile.controller.order.OrderController
Only compile the specified method
jad cn.test.mobile.controller.order.OrderController getOrderInfo

ClassLoader:
@RequestMapping(value={"getOrderInfo"}, method={RequestMethod.POST})
public Object getOrderInfo(HttpServletRequest request, @RequestBody Map map) {
    ResponseVo responseVo = new ResponseVo();
    ... ... ...  ...
3. sc
Short for “Search-Class”, view information about classes loaded by the JVM. Sometimes, you only remember part of the class name; you can use sc to get the full name. When you encounter the error “ClassNotFoundException” or “ClassDefNotFoundException”, you can use this command to verify.
| Parameter Name | Parameter Description |
|---|---|
| class-pattern | Class name expression matching |
| method-pattern | Method name expression matching |
| [d] | Outputs detailed information about the current class, including the original file source of the class, class declaration, loaded ClassLoader, etc. If a class is loaded by multiple ClassLoaders, it will appear multiple times. |
Fuzzy search
sc *OrderController*
cn.test.mobile.controller.order.OrderController
Print detailed information about the class sc -d
sc -d cn.test.mobile.controller.order.OrderController

 class-info        cn.test.mobile.controller.order.OrderController
 code-source       /F:/IDEA-WORKSPACE-TEST-qyb/trunk/BE/mobile/target/classes/
 name              cn.test.mobile.controller.order.OrderController
 isInterface       false
 isAnnotation      false
 isEnum            false
 isAnonymousClass  false
 isArray           false
 isLocalClass      false
 isMemberClass     false
 isPrimitive       false
 isSynthetic       false
 simple-name       OrderController
 modifier          public
 annotation        org.springframework.web.bind.annotation.RestController,org.springframework.web.bind.annotation.Requ
                   estMapping
 interfaces
 super-class       +-cn.test.mobile.controller.BaseController
                     +-java.lang.Object
 class-loader      +-sun.misc.Launcher$AppClassLoader@18b4aac2
                     +-sun.misc.Launcher$ExtClassLoader@480bdb19
 classLoaderHash   18b4aac2
Correspondingly, there is also sm (“Search-Method”), which views the method information of loaded classes.
View methods in String
sm java.lang.String
java.lang.String <init>([BII)V
java.lang.String <init>([BLjava/nio/charset/Charset;)V
java.lang.String <init>([BLjava/lang/String;)V
java.lang.String <init>([BIILjava/nio/charset/Charset;)V
java.lang.String <init>([BIILjava/lang/String;)V
... ... ... ...
View detailed information about toString in String
sm -d java.lang.String toString
declaring-class  java.lang.String
 method-name      toString
 modifier         public
 annotation
 parameters
 return           java.lang.String
 exceptions
 classLoaderHash  null
4. watch
Can monitor a method’s input parameters and return values.
Some issues occur online that cannot be reproduced locally; at this point, this command is useful.
| Parameter Name | Parameter Description |
|---|---|
| class-pattern | Class name expression matching |
| method-pattern | Method name expression matching |
| express | Observation expression |
| condition-express | Condition expression |
| [b] | Observe “before method call” |
| [e] | Observe “after method exception” |
| [s] | Observe “after method return” |
| [f] | Observe “after method ends” (normal return and exception return), “default option” |
| [E] | Enable regular expression matching, default is wildcard matching |
| [x:] | Specify the output result’s property traversal depth, default is 1 |
Observe the output parameters and return values of getOrderInfo, where the output parameters are the input parameters after the method ends.
watch cn.test.mobile.controller.order.OrderController getOrderInfo "{params,returnObj}" -x 2

Press Q or Ctrl+C to abort.
Affect(class-cnt:1 , method-cnt:1) cost in 456 ms.
ts=2019-11-13 15:30:18; [cost=18.48307ms] result=@ArrayList[
    @Object[][  # This is the output parameter, params
        @RequestFacade[org.apache.catalina.connector.RequestFacade@1d81dbd7],
        @LinkedHashMap[isEmpty=false;size=2], # Change the traversal depth x to 3 to see the values in the map
    ],
    @ResponseVo[ # This is the return value returnObj
        log=@Logger[Logger[cn.test.db.common.vo.ResponseVo]],
        success=@Boolean[true],
        message=@String[Ok],
        count=@Integer[0],
        code=@Integer[1000],
        data=@HashMap[isEmpty=false;size=1],
    ],
]
Observe the input parameters and return values of getOrderInfo
watch cn.test.mobile.controller.order.OrderController getOrderInfo "{params,returnObj}" -x 3 -b

Press Q or Ctrl+C to abort.
Affect(class-cnt:1 , method-cnt:1) cost in 93 ms.
ts=2019-11-13 15:37:38; [cost=0.012479ms] result=@ArrayList[
    @Object[][
        @RequestFacade[
            request=@Request[org.apache.catalina.connector.Request@d04e652],
            sm=@StringManager[org.apache.tomcat.util.res.StringManager@7ae7a97b],
        ],
        @LinkedHashMap[
            @String[payNo]:@String[190911173713755288],
            @String[catalogId]:@String[6],
        ],
    ],
    null,# -b is to observe before method call, so there is no return value yet
]
If you need to capture exceptions, use throwExp, such as {params,returnObj,throwExp}
5. trace
Outputs the internal call path of a method, along with the time taken at each node along the path.
This command can help identify which methods are performance-intensive, thus finding the code that causes performance defects; this time also includes the time taken by arthas to execute.
| Parameter Name | Parameter Description |
|---|---|
| class-pattern | Class name expression matching |
| method-pattern | Method name expression matching |
| condition-express | Condition expression |
| [E] | Enable regular expression matching, default is wildcard matching |
[n:] |
Number of command executions |
#cost |
Method execution time |
Output the call path of getOrderInfo
trace -j cn.test.mobile.controller.order.OrderController getOrderInfo

Press Q or Ctrl+C to abort.
Affect(class-cnt:1 , method-cnt:1) cost in 92 ms.
---ts=2019-11-13 15:46:59;thread_name=http-nio-8801-exec-4;id=2b;is_daemon=true;priority=5;TCCL=org.springframework.boot.web.embedded.tomcat.TomcatEmbeddedWebappClassLoader@a6c54c3
    ---[15.509011ms] cn.test.mobile.controller.order.OrderController:getOrderInfo()
        +---[0.03584ms] cn.test.db.common.vo.ResponseVo:<init>() #472
        +---[0.00992ms] java.util.HashMap:<init>() #473
        +---[0.02176ms] cn.test.mobile.controller.order.OrderController:getUserInfo() #478
        +---[0.024ms] java.util.Map:get() #483
        +---[0.00896ms] java.lang.Object:toString() #483
        +---[0.00864ms] java.lang.Integer:parseInt() #483
        +---[0.019199ms] com.baomidou.mybatisplus.core.conditions.query.QueryWrapper:<init>() #500
        +---[0.135679ms] com.baomidou.mybatisplus.core.conditions.query.QueryWrapper:allEq() #500
        +---[12.476072ms] cn.test.db.service.IOrderMediaService:getOne() #500
        +---[0.0128ms] java.util.HashMap:put() #501
        +---[0.443517ms] cn.test.db.common.vo.ResponseVo:setSuccess() #503
        `---[0.03488ms] java.util.Map:put() #504
Output the call path of getOrderInfo, filtering out methods in the JDK where the cost is greater than 10ms; -j filters out JDK methods, so you can see that the output is much less.
trace -j cn.test.mobile.controller.order.OrderController getOrderInfo '#cost > 10'

Press Q or Ctrl+C to abort.
Affect(class-cnt:1 , method-cnt:1) cost in 96 ms.
---ts=2019-11-13 15:53:42;thread_name=http-nio-8801-exec-2;id=29;is_daemon=true;priority=5;TCCL=org.springframework.boot.web.embedded.tomcat.TomcatEmbeddedWebappClassLoader@a6c54c3
    ---[13.803743ms] cn.test.mobile.controller.order.OrderController:getOrderInfo()
        +---[0.01312ms] cn.test.db.common.vo.ResponseVo:<init>() #472
        +---[0.01408ms] cn.test.mobile.controller.order.OrderController:getUserInfo() #478
        +---[0.0128ms] com.baomidou.mybatisplus.core.conditions.query.QueryWrapper:<init>() #500
        +---[0.303998ms] com.baomidou.mybatisplus.core.conditions.query.QueryWrapper:allEq() #500
        +---[12.675431ms] cn.test.db.service.IOrderMediaService:getOne() #500
        `---[0.409917ms] cn.test.db.common.vo.ResponseVo:setSuccess() #503
6. jobs
Execute background asynchronous tasks.
Some issues occur online sporadically; at this point, you need to use asynchronous tasks to write information to a file.
Use & to specify the command to run in the background, and use > to overwrite the result to a log file; for example, with trace
trace -j cn.test.mobile.controller.order.OrderController getOrderInfo > test.out &
jobs – lists all jobs
 jobs
[76]*
       Running           trace -j cn.test.mobile.controller.order.OrderController getOrderInfo >> test.out &
       execution count : 0
       start time      : Wed Nov 13 16:13:23 CST 2019
       timeout date    : Thu Nov 14 16:13:23 CST 2019
       session         : f4fba846-e90b-4234-959e-e78ad0a5db8c (current)
The job id is 76, * indicates that this job was created by the current session, the status is Running, and the execution count is the number of executions, the timeout date is the timeout time.
Asynchronous execution time defaults to 1 day; if you want to modify it, use the options command,
options job-timeout 2d
options optional parameters are 1d, 2h, 3m, 25s, representing days, hours, minutes, and seconds respectively.
kill – forcibly terminate the task
kill 76
kill job 76 success
At most, 8 commands can be supported simultaneously; do not open too many background asynchronous commands to avoid impacting the performance of the target JVM.
7. logger
View logger information, update logger level
View
logger
 name                ROOT
 class               ch.qos.logback.classic.Logger
 classLoader         sun.misc.Launcher$AppClassLoader@18b4aac2
 classLoaderHash     18b4aac2 # This will be used when updating the log level
 level               INFO
 effectiveLevel      INFO
 ... ... ... ...
Update log level
logger --name ROOT --level debug
update logger level success.
If an error occurs when executing this command: update logger level fail.
Try specifying classLoaderHash to retry
logger -c 18b4aac2 --name ROOT --level debug
update logger level success.
8. dashboard
View the current system’s real-time data panel. This command can globally view the JVM’s running status, such as memory and CPU usage.
dashboard
ID        NAME                          GROUP               PRIORITY STATE     %CPU      TIME      INTERRUPT DAEMON
17        Abandoned connection cleanup  main                5        TIMED_WAI 0         0:0       false     true
1009      AsyncAppender-Worker-arthas-c system              5        WAITING   0         0:0       false     true
5         Attach Listener               system              5        RUNNABLE  0         0:0       false     true
23        ContainerBackgroundProcessor[ main                5        TIMED_WAI 0         0:0       false     true
55        DestroyJavaVM                 main                5        RUNNABLE  0         0:11      false     false
3         Finalizer                     system              8        WAITING   0         0:0       false     true
18        HikariPool-1 housekeeper      main                5        TIMED_WAI 0         0:0       false     true
39        NioBlockingSelector.BlockPoll main                5        RUNNABLE  0         0:0       false     true
2         Reference Handler             system              10       WAITING   0         0:0       false     true
4         Signal Dispatcher             system              9        RUNNABLE  0         0:0       false     true
69        System Clock                  main                5        TIMED_WAI 0         0:34      false     true
25        Thread-2                      main                5        TIMED_WAI 0         0:0       false     false
37        Timer-0                       main                5        TIMED_WAI 0         0:0       false     true
Memory                    used    total    max     usage    GC
heap                      216M    415M     3614M   5.99%    gc.ps_scavenge.count          96
ps_eden_space             36M     78M      1276M   2.90%    gc.ps_scavenge.time(ms)       3054
ps_survivor_space         17M     38M      38M     46.53%   gc.ps_marksweep.count         4
ps_old_gen                161M    298M     2711M   5.97%    gc.ps_marksweep.time(ms)      804
nonheap                   175M    180M     -1      97.09%
code_cache                35M     35M      240M    14.85%
ID: Java-level thread ID; note that this ID does not correspond one-to-one with the nativeID in jstack. We can view the thread’s stack information through thread id
thread 2
"Reference Handler" Id=2 WAITING on java.lang.ref.Reference$Lock@66ad4272
    at java.lang.Object.wait(Native Method)
    -  waiting on java.lang.ref.Reference$Lock@66ad4272
    at java.lang.Object.wait(Object.java:502)
    at java.lang.ref.Reference.tryHandlePending(Reference.java:191)
    at java.lang.ref.Reference$ReferenceHandler.run(Reference.java:153)
NAME: Thread name
GROUP: Thread group name
PRIORITY: Thread priority, a number between 1-10, the larger the number, the higher the priority
STATE: Thread state
CPU%: CPU usage percentage consumed by the thread, sampled over 100ms, summing the CPU usage of all threads during this 100ms, then calculating the CPU usage percentage for each thread.
TIME: Total running time of the thread, data format is minutes:seconds
INTERRUPTED: Current interrupt status of the thread
DAEMON: Whether it is a daemon thread
9. redefine
Redefine classes loaded by the JVM, allowing hot updates of classes without restarting the project.
This feature is really powerful, but the command may not always succeed.
Next, let’s simulate: suppose I want to modify a few lines of code in OrderController and then hot update it to the JVM:
a. Decompile OrderController; by default, the decompiled result will include ClassLoader information. Using the –source-only option, you can print only the source code, which is convenient for combining with mc/redefine commands.
jad --source-only cn.test.mobile.controller.order.OrderController > OrderController.java
Where is the generated OrderController.java? Execute pwd to find out which directory it is in.
b. Find the ClassLoader that loaded OrderController
sc -d cn.test.mobile.controller.order.OrderController | grep classLoaderHash
classLoaderHash   18b4aac2
c. After modifying and saving OrderController.java, use the mc (Memory Compiler) command to compile it into bytecode, specifying the ClassLoader with the -c parameter.
mc -c 18b4aac2 OrderController.java -d ./
d. Hot update the modified code
redefine -c 18b4aac2 OrderController.class
redefine success, size: 1
Then the code is successfully updated.
For redefine, I referred to this document https://github.com/alibaba/arthas/issues/537.
For more advanced features, please visit the Arthas official documentation https://alibaba.github.io/arthas/quick-start.html.
Others
If java -jar selects to start a certain application and the following error occurs
java -jar arthas-boot.jar
[INFO] arthas-boot version: 3.1.4
[INFO] Process 11544 already using port 3658
[INFO] Process 11544 already using port 8563
[INFO] Found existing java process, please choose one and hit RETURN.
* [1]: 11544
  [2]: 119504 cn.test.MobileApplication
  [3]: 136340 org.jetbrains.jps.cmdline.Launcher
  [4]: 3068
2 # Select the second to start
[ERROR] Target process 119504 is not the process using port 3658, you will connect to an unexpected process.
[ERROR] 1. Try to restart arthas-boot, select process 11544, shutdown it first with running the 'shutdown' command.
[ERROR] 2. Or try to use a different telnet port, for example: java -jar arthas-boot.jar --telnet-port 9998 --http-port -1
Note the prompt [ERROR] 1; just enter the application 11544 and execute shutdown to close this application before starting.
Mastering Arthas allows you to achieve 5 years of expertise with just 3 years of experience!
Welcome to join my knowledge circle to discuss architecture and exchange source code. To join, long press the QR code below:

Recently updated the “Yudao SpringBoot 2.X Introduction” series, with over 101 articles covering MyBatis, Redis, MongoDB, ES, sharding, read-write separation, SpringMVC, Webflux, permissions, WebSocket, Dubbo, RabbitMQ, RocketMQ, Kafka, performance testing, and more.
Providing nearly 30,000 lines of code as SpringBoot examples, as well as over 40,000 lines of code for e-commerce microservice projects.
How to obtain: Click “Looking”, follow the public account and reply 666 to receive, more content will be delivered continuously.
If this article is helpful, please look and share it.
Thank you for your support! (*^__^*)