✅ 1. <span>EXPLAIN FORMAT=JSON</span> —— In-depth Analysis of Execution Plans
🔍 Purpose
Provides more detailed execution information than the standard <span>EXPLAIN</span>, including:
- Cost of accessing each table (
<span>cost_info</span>)
- Details on index usage
- Whether temporary tables or sorting are used
- JOIN order and driving strategy
📌 Usage
EXPLAIN FORMAT=JSON SELECT u.username, v.n_time FROM abc v JOIN user_info u ON v.uid = u.uid WHERE v.n_time > '2025-08-01' AND v.d_status = 0;📄 Output Example (Key Parts):
{ "query_block": { "nested_loop": [ { "table": { "table_name": "v", "access_type": "range", "possible_keys": ["idx_profit_sharing"], "key": "idx_profit_sharing", "rows_examined_per_scan": 1200, "cost_info": { "read_cost": "1000.00", "eval_cost": "120.00", "prefix_cost": "1120.00" }, "used_columns": ["id", "uid", "d_status", "n_time"] } }, { "table": { "table_name": "u", "access_type": "ref", "key": "idx_uid", "rows_examined_per_scan": 1, "cost_info": { "read_cost": "1.00", "eval_cost": "0.10", "prefix_cost": "1121.10" } } } ], "cost_info": { "query_cost": "1121.10" } }}✅ Key Field Interpretation
| Field | Meaning | Optimization Suggestions |
|---|---|---|
<span>access_type</span> |
Access type | Avoid <span>ALL</span>, aim for <span>ref</span>/<span>range</span> |
<span>key</span> |
Index used | Check if the expected index is hit |
<span>rows_examined_per_scan</span> |
Number of rows scanned | The smaller, the better |
<span>read_cost</span> + <span>eval_cost</span> |
Cost | The lower the total cost, the better |
<span>query_cost</span> |
Total cost | Used to compare the performance of different SQL queries |
💡 Usage: To compare which of two SQL queries is better? Use
<span>query_cost</span>to determine!
✅ 2. Performance Schema —— Real-time Performance Monitoring
🔍 Purpose
A built-in performance diagnostic framework in MySQL that can monitor:
- SQL execution time, lock waits, IO, memory usage, etc.
- Which SQL queries are the most time-consuming? Who is using the indexes? Is there lock contention?
📌 Enabling and Using
(1) Confirm it is enabled:
SHOW VARIABLES LIKE 'performance_schema'; -- Should be ON(2) View the slowest SQL (by average latency):
SELECT DIGEST_TEXT AS sql_template, COUNT_STAR AS exec_count, AVG_TIMER_WAIT / 1000000000 AS avg_ms, MAX_TIMER_WAIT / 1000000000 AS max_ms, ROWS_EXAMINED_AVG, ROWS_SENT_AVG FROM performance_schema.events_statements_summary_by_digest WHERE DIGEST_TEXT LIKE '%abc%' ORDER BY AVG_TIMER_WAIT DESC LIMIT 10;(3) Check for full table scans:
SELECT DIGEST_TEXT, NO_INDEX_USED_COUNT FROM performance_schema.events_statements_summary_by_digest WHERE NO_INDEX_USED_COUNT > 0 ORDER BY NO_INDEX_USED_COUNT DESC;✅ Advantages
- Real-time monitoring, no need for slow logs
- Can locate “high-frequency low-latency but high-volume” SQL queries
✅ 3. <span>pt-query-digest</span> —— The Ultimate Tool for Analyzing Slow Query Logs
🔍 Purpose
A tool in the Percona Toolkit used to analyze <span>slow.log</span> and generate a performance report.
📌 Installation (Linux)
# Ubuntu/Debian
wget https://www.percona.com/downloads/percona-toolkit/LATEST/debian/percona-toolkit_3.5.0-1.jammy_amd64.deb
sudo dpkg -i percona-toolkit_*.deb
# Or yum
yum install percona-toolkit
📌 Analyzing Slow Logs
pt-query-digest /var/log/mysql/slow.log > slow_report.txt📄 Example Report Content
# 1.2s user time, 120ms system time, 24.1M rss, 114.1M vsz
# 100ms user time, 10ms system time
# 100ms user time, 10ms system time
# 100ms user time, 10ms system time
# 100ms user time, 10ms system time
# Rank Query ID           Response time    Calls  R/Call   V/M   Item
# 1      0x123ABC...        120.00s  30.0%  1000   0.120s   0.01  SELECT abc
# 2      0x456DEF...        80.00s   20.0%  500    0.160s   0.02  SELECT user_info
# Query 1: 1000 calls, 120.00s, 0.120s avg, 100ms max
#    Time range: 2025-08-01 00:00:00 to 2025-08-31 23:59:59
#    Examined rows by query: 10000 avg
#    Query:
#    SELECT * FROM abc WHERE d_status = 0 AND n_time > '2025-08-01';
✅ Advantages
- Automatically aggregates similar SQL queries
- Counts call frequency, total time, average time
- Locates SQL queries that most impact the system
✅ 4. MyBatis Log Plugin (IDEA Plugin) —— A Blessing for Developers
🔍 Purpose
Automatically concatenates the “precompiled SQL + parameters” output from MyBatis console into a complete executable SQL.
📌 Usage
1. Install the Plugin:
IDEA → <span>Settings</span> → <span>Plugins</span> → Search for “MyBatis Log Plugin” → Install
Enable MyBatis Logging:
mybatis-plus: configuration: log-impl: org.apache.ibatis.logging.stdout.StdOutImpl2. Copy SQL from Logs:
==>  Preparing: SELECT * FROM adms_validation WHERE reward_status = ? AND ads_id = ?
==> Parameters: 0(Integer), J4842733427(String)
3. Paste into IDEA, right-click → “MyBatis Log Plugin” → “Format SQL”
✅ Output Result:
SELECT * FROM abc WHERE d_status = 0 AND id = '123';💡 Usage: Quickly copy SQL for execution analysis in Navicat/MySQL client during development and debugging
✅ 5. Arthas —— A Diagnostic Tool for Production Environments
🔍 Purpose
An open-source Java diagnostic tool from Alibaba that allows you to: diagnose without restarting or modifying code:
- View SQL executed in the JVM
- Trace method call chains
- Monitor slow SQL queries
📌 Installation and Usage
-
Download and Start Arthas
curl -O https://arthas.aliyun.com/arthas-boot.jar
java -jar arthas-boot.jar
# Select your Java process
-
Trace Mapper Method (View SQL Execution Time)
trace com.yourpackage.mapper.AbcMapper selectList
-
Output Example:
+---trace---+
|  selectList()  cost: 120ms|
|    --> SQL: SELECT * FROM adms_validation WHERE ... |
|    --> Parameters: [0, 'J4842733427']
+-----------+
2. Monitor All SQL Executions
watch com.baomidou.mybatisplus.core.mapper.BaseMapper selectList '{params, returnObj}' -x 2✅ Advantages
- Safe diagnostics in production environments
- Can locate “intermittent slow SQL queries”
- Supports Spring Boot, MyBatis, MyBatis-Plus
📊 Tool Comparison Summary
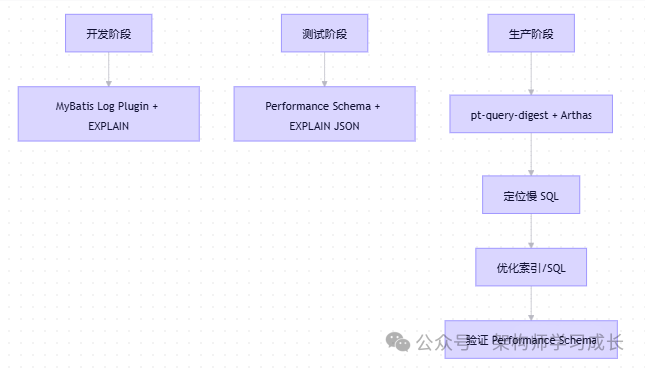
| Tool | Applicable Stage | Advantages | Disadvantages |
|---|---|---|---|
<span>EXPLAIN FORMAT=JSON</span> |
Development/Testing | Cost analysis, precise | Static analysis, does not reflect real load |
<span>Performance Schema</span> |
Production/Testing | Real-time monitoring, no logs needed | Needs to be enabled, has some performance overhead |
<span>pt-query-digest</span> |
Production | Slow SQL analysis, aggregated statistics | Requires slow log to be enabled |
<span>MyBatis Log Plugin</span> |
Development | Quick SQL formatting | Limited to development environment |
<span>Arthas</span> |
Production | Dynamic diagnostics, non-intrusive | Learning curve is slightly high |