We are currently in a multi-core era, and multithreaded programs are very common. This article will explore how to debug C++ multithreaded programs.
Example Code
This article designs a demo multithreaded program where the main thread starts two business threads that execute the functions business_1 and business_2. Each of these functions defines a counter object that increments by 1 every 100 milliseconds.
#include <thread>#include <chrono>
class counter{public:    void add_one()    {        ++count_;    }private:    uint32_t count_{ 0 };};
void business_1(){    counter cnt{};    while (true) {        cnt.add_one();        std::this_thread::sleep_for(std::chrono::milliseconds(100));    }}
void business_2(){    counter cnt{};    while (true) {        cnt.add_one();        std::this_thread::sleep_for(std::chrono::milliseconds(100));    }}
int main(){    std::thread t1(&business_1);    std::thread t2(&business_2);    t1.join();    t2.join();    return 0;}
Basic Debugging
Step 1: Run the Program with GDB
Command: gdb -tui test
Step 2: Set a Breakpoint on the add_one Member Function of the Counter Class
Command: b counter::add_one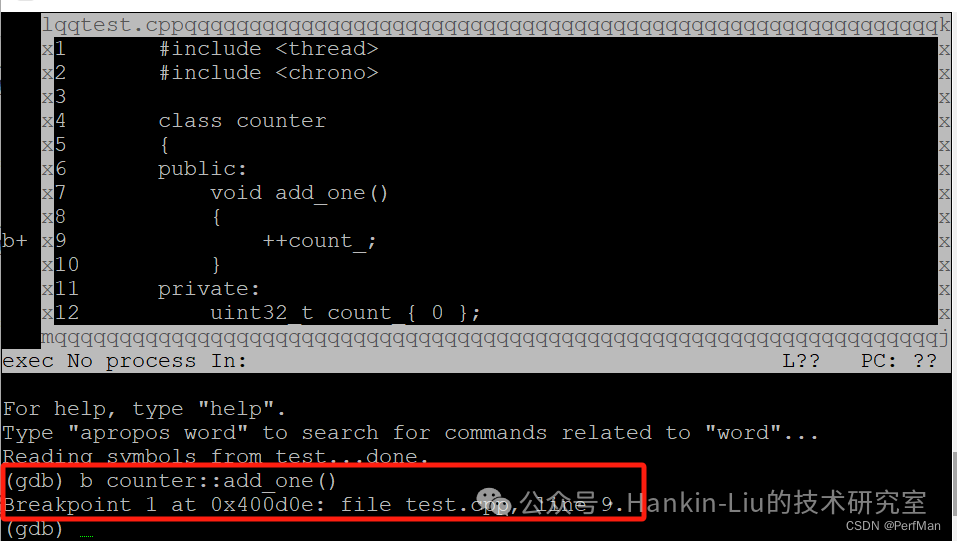
Step 3: Run the Program
Command: r As shown in the figure below, after running, thread 2 first triggered the breakpoint set in the previous step.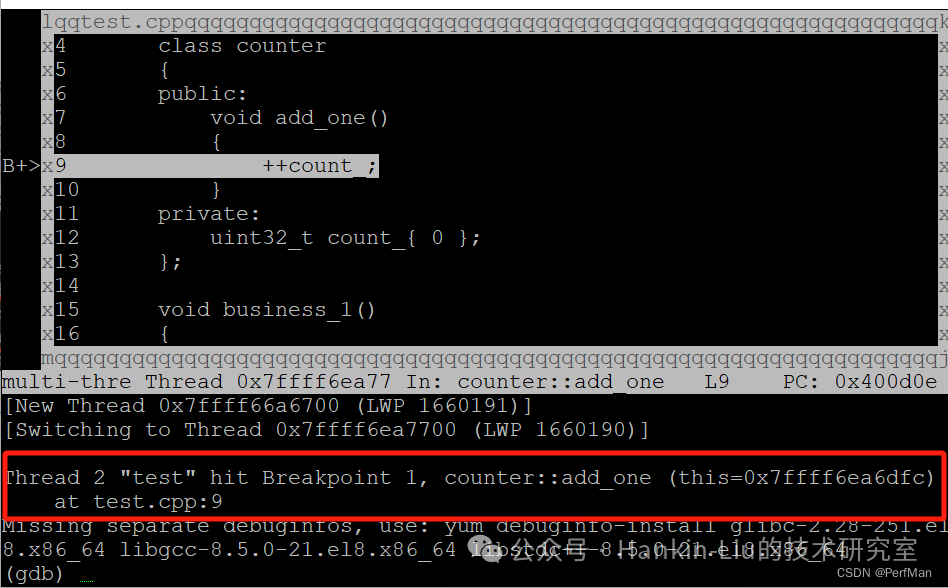
Step 4: Check Thread Status
Command: info thread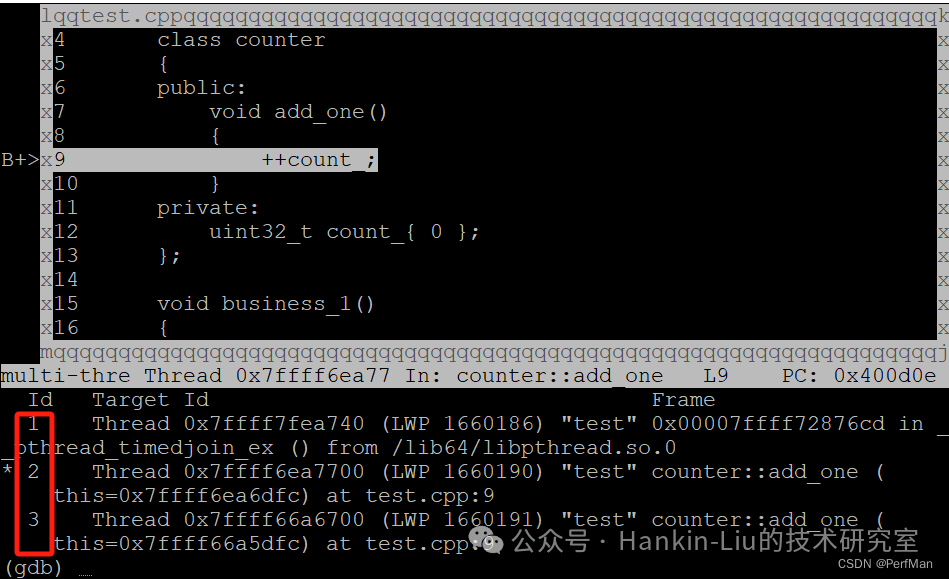 At this point, there are 3 threads running:(1) Thread 1 is the main thread, which waits for threads 2 and 3 to exit after calling join on them;(2) Thread 2 is a child thread, but it is currently unclear whether it is business_1 or business_2;(3) Thread 3 is a child thread, but it is currently unclear whether it is business_1 or business_2;Thread 2 is marked with an *, indicating it is the current thread.
Step 5: View Thread Stack Information
Command: thread apply all bt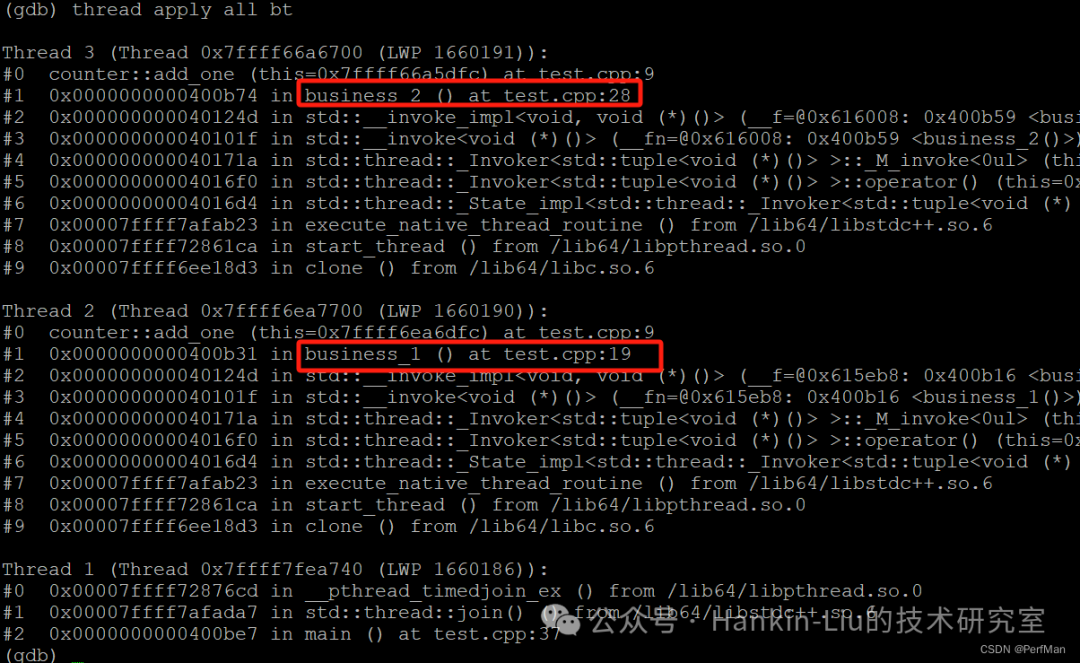 From the above figure, it can be seen that Thread 2 is running the business_1 function, and Thread 3 is running the business_2 function.Note: You can also view the stack information of a specific thread with the following commands:(1) To view the current thread stack, use bt(2) To view a specific thread stack, for example, for Thread 2, run thread apply 2 bt
Step 6: Switch Threads
Command: thread thread_number Assuming you want to switch to thread 3, execute thread 3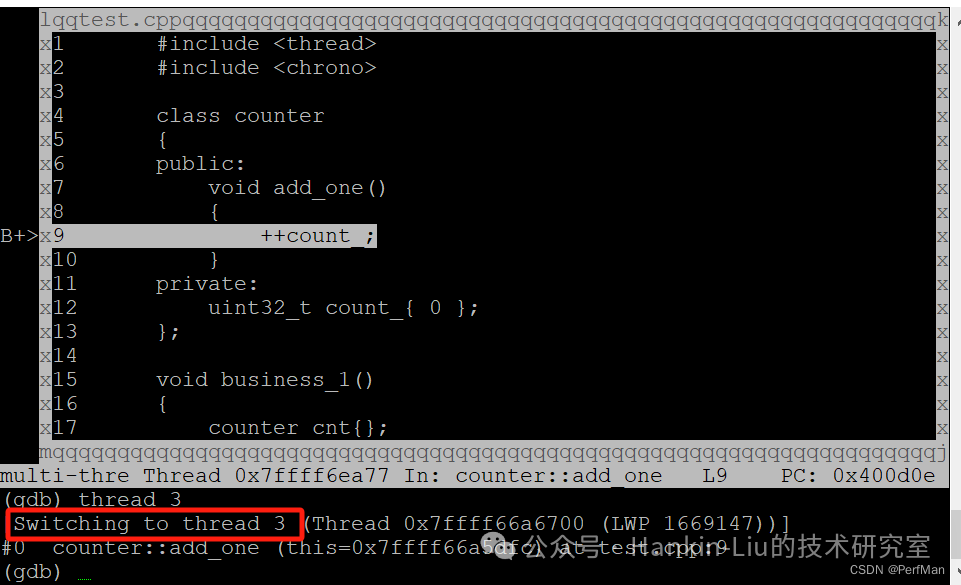
Step 7: Step Execution
Command: n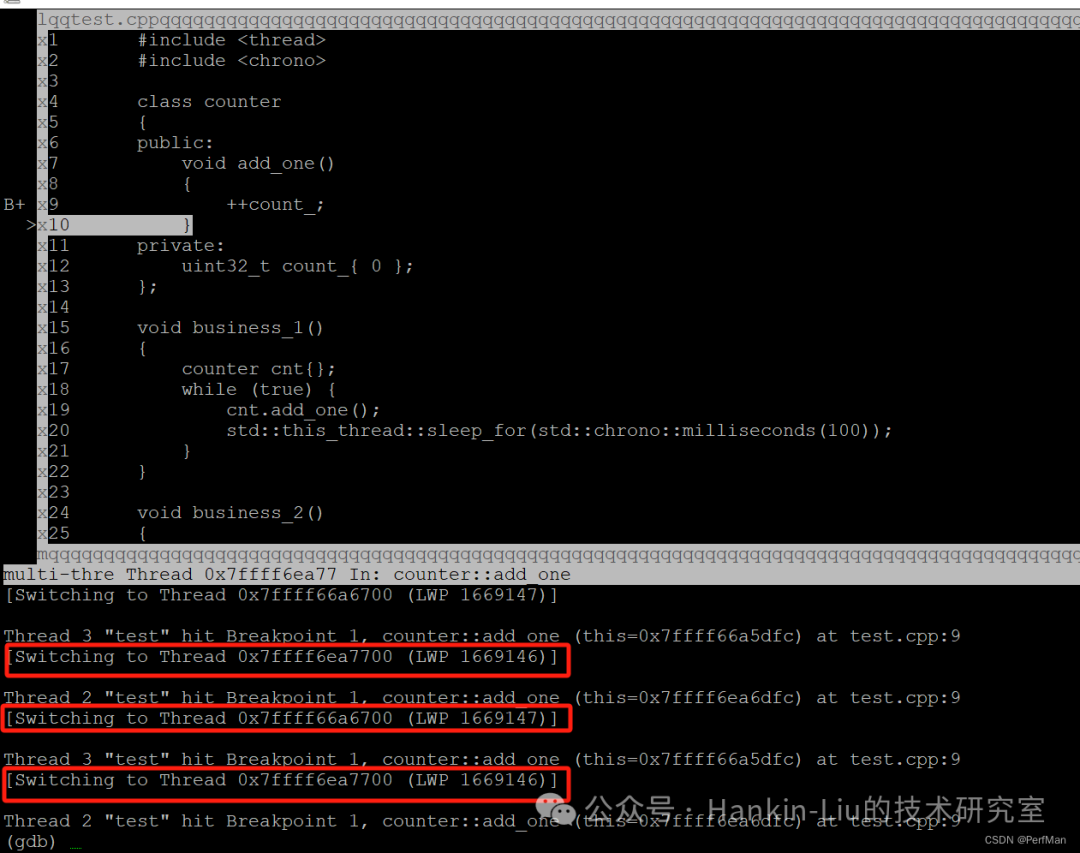 During the step execution process, an issue arises, as shown in the figure above. Since both child threads have breakpoints set on counter::add_one, when stepping through the current thread, the other thread’s breakpoint is always triggered, leading to frequent switching between threads 2 and 3, which is not our expectation.
Problem Description
In Step 7 of the basic debugging section, we encountered the problem of frequent thread switching during step debugging. This is due to both child threads having breakpoints set on counter::add_one. When thread 2 is stepped through, thread 3 is also running, which causes thread 3 to trigger the breakpoint and lead to a switch.Is there a way to keep the current thread from switching during debugging? The answer is yes; the solution is to set the appropriate scheduler-locking parameter.
Scheduler-Locking
The function of scheduler-locking is to control whether other threads can execute while debugging the current thread. The values that can be set are:(1) off, do not lock threads; during debugging, all threads run together;(2) on, only the current thread is allowed to execute; during debugging, other threads will not execute;(3) step, during step debugging, other threads will not execute, but when executing continue, until, or finish commands, other threads will also execute.Note: The default value of scheduler-locking varies by version of gdb. You can check the default value with show scheduler-locking. In this article’s example, the default value is off.
Solution
After understanding the function and parameters of scheduler-locking, we know that to prevent the current thread from switching during debugging, we just need to set scheduler-locking to on. The commands are as follows:(1) set scheduler-locking on — Set(2) show scheduler-locking — Check if the setting was successfulAfter setting, input c multiple times for debugging, as shown in the figure below. This time, the thread remains on thread 2 and is no longer switched, solving the problem.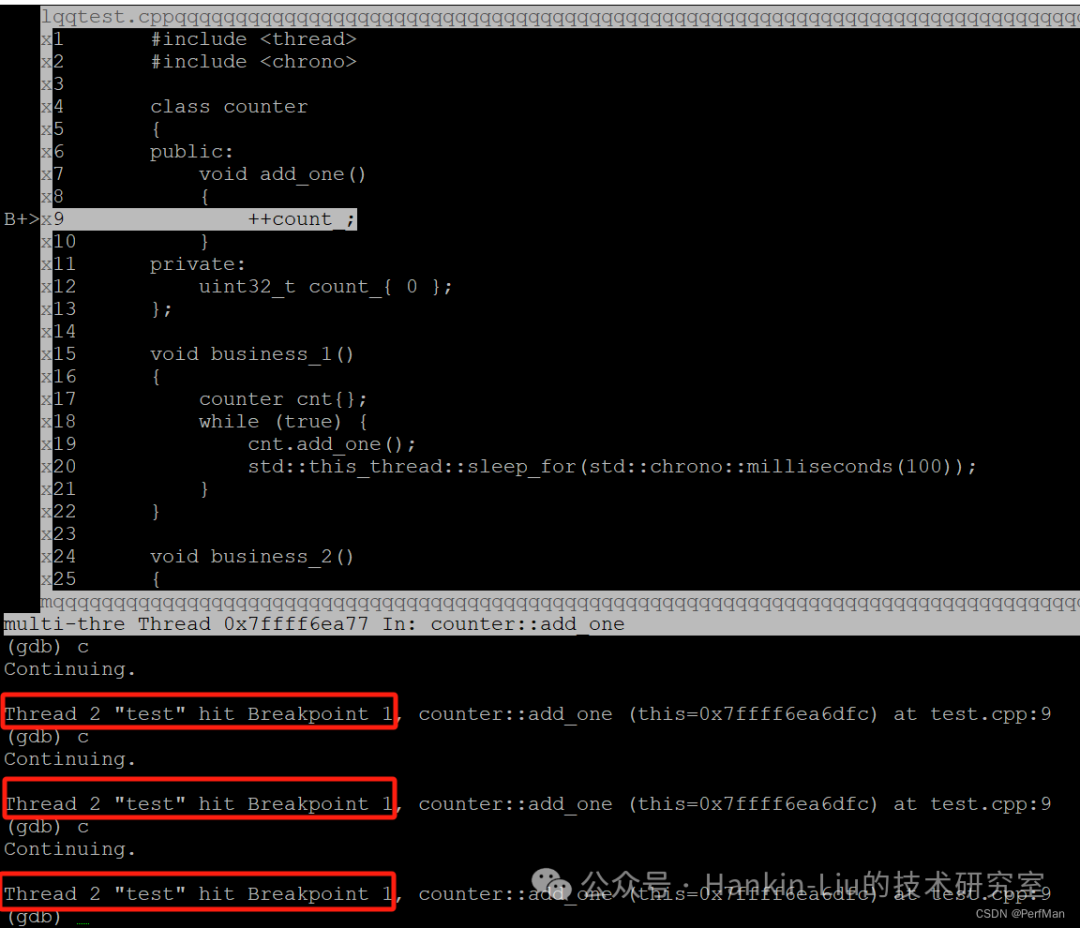
Conclusion
When designing large-scale applications, code reusability is often emphasized. Different threads may call the same functions, and it is common to set breakpoints on these generic functions during debugging. Mastering the debugging techniques in this article will help you navigate the multithreading debugging process more effectively.
📬 Feel free to follow the WeChat public account “Hankin-Liu’s Technical Research Room” for continuous sharing of content related to trusted innovation, software performance testing, optimization, programming skills, and software debugging techniques, providing valuable and well-grounded technical insights.