 Click the blue text to follow us……
 Tips for Plotting Data (Part 1)
 01Add Title – title
The title() function in the matplotlib.pyplot object can be used to set the title of the plot.
Import numpy as np
import matplotlib.pyplot as plt
# Display Chinese
plt.rcParams[‘font.sans-serif’] = [u’SimHei’]
plt.rcParams[‘axes.unicode_minus’] = False
%matplotlib inline
x=np.arange(0,10)
plt.title(‘This is a sample title’)
plt.plot(x,x*x)
plt.show()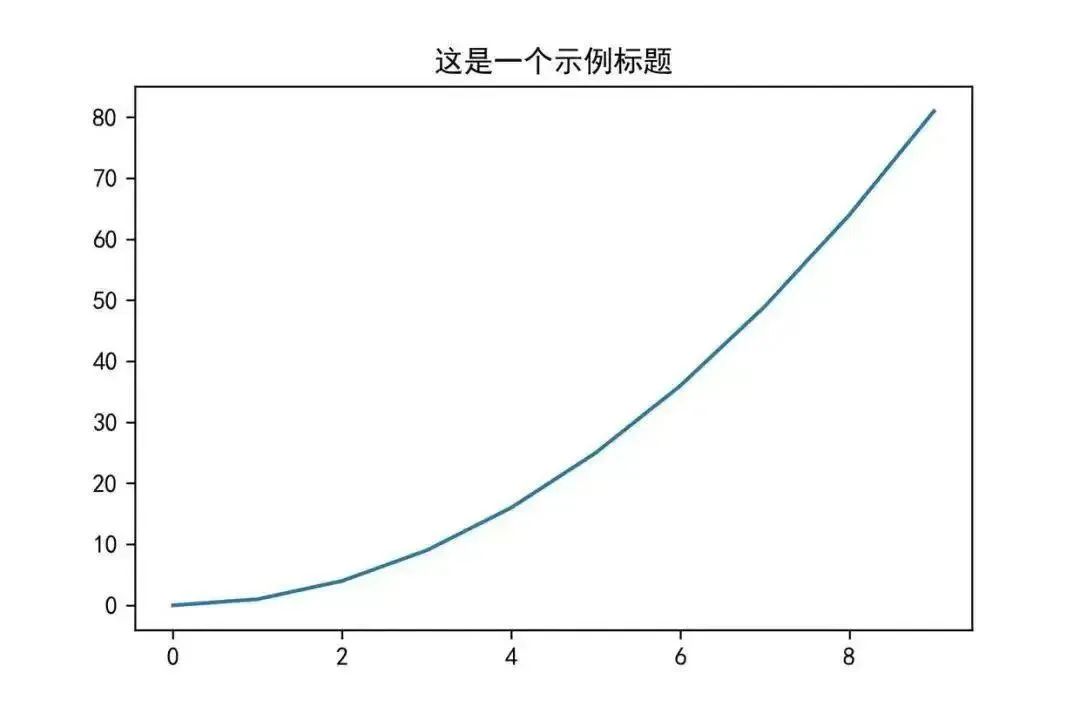
02Add Text – text
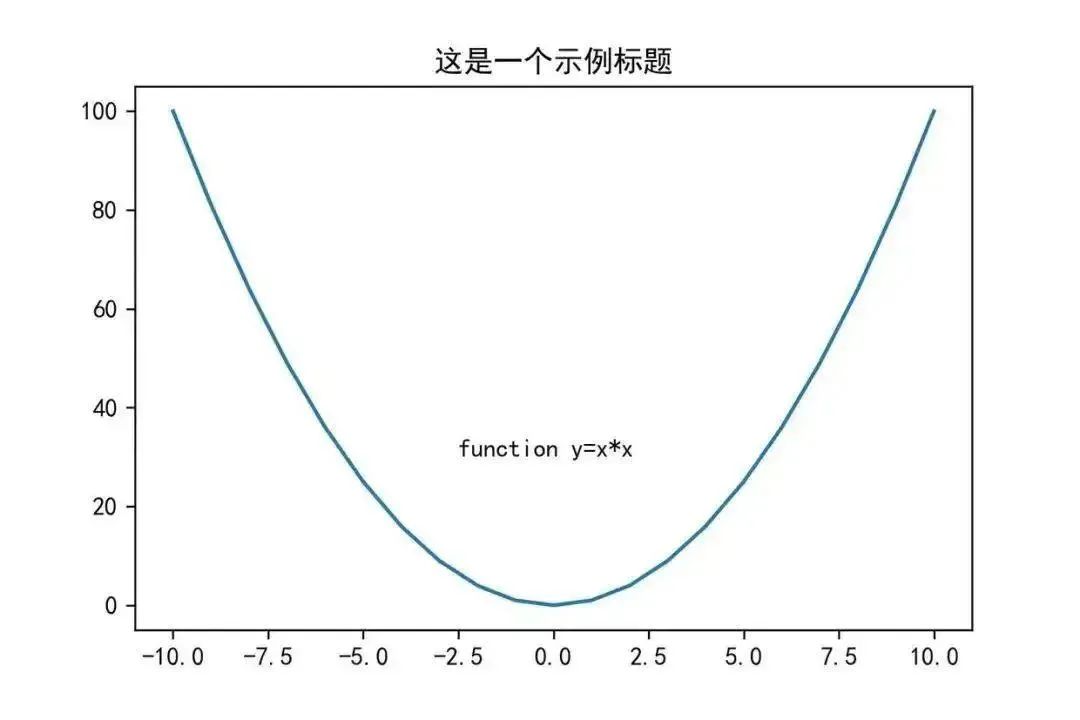
To set coordinates and text, you can use the text() function in the matplotlib.pyplot object. The first two parameters set the coordinates, and the third parameter sets the text content to display.
Import numpy as np
import matplotlib.pyplot as plt
# Display Chinese
plt.rcParams[‘font.sans-serif’] = [u’SimHei’]
plt.rcParams[‘axes.unicode_minus’] = False
%matplotlib inline
x=np.arange(-10,11,1)
y=x*x
plt.plot(x,y)
plt.title(‘This is a sample title’)
# Add text
plt.text(-2.5,30,’function y=x*x’)
plt.show()
03Add Annotation – annotate
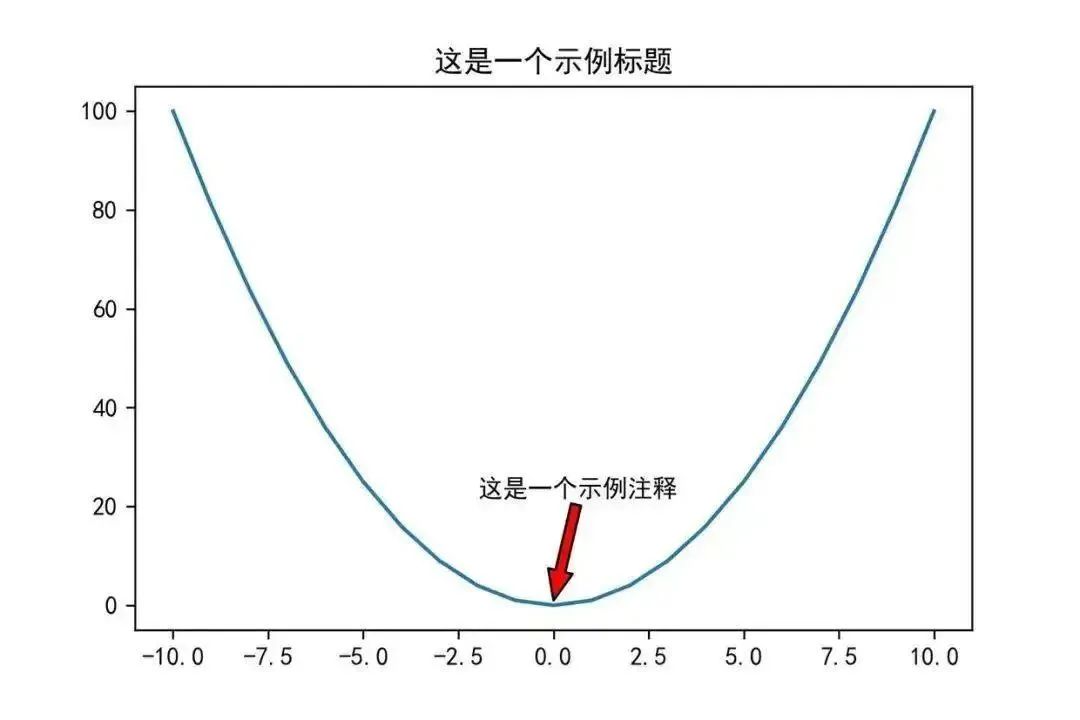
You can use the annotate() function to add annotations to the plot. The xy parameter is the coordinate point for the annotation; the xytext parameter is the coordinate for the annotation text (default is the position of xy); the arrowprops parameter is used to draw an arrow between xy and xytext.
Import numpy as np
import matplotlib.pyplot as plt
# Display Chinese
plt.rcParams[‘font.sans-serif’] = [u’SimHei’]
plt.rcParams[‘axes.unicode_minus’] = False
%matplotlib inline
x=np.arange(-10,11,1)
y=x*x
plt.title(‘This is a sample title’)
plt.plot(x,y)
# Add annotation
plt.annotate(‘This is a sample annotation’,xy=(0,1),xytext=(-2,22),arrowprops={‘headwidth’:10,’facecolor’:’r’})
plt.show()
04Add Axis Labels – xlabel/ylabel
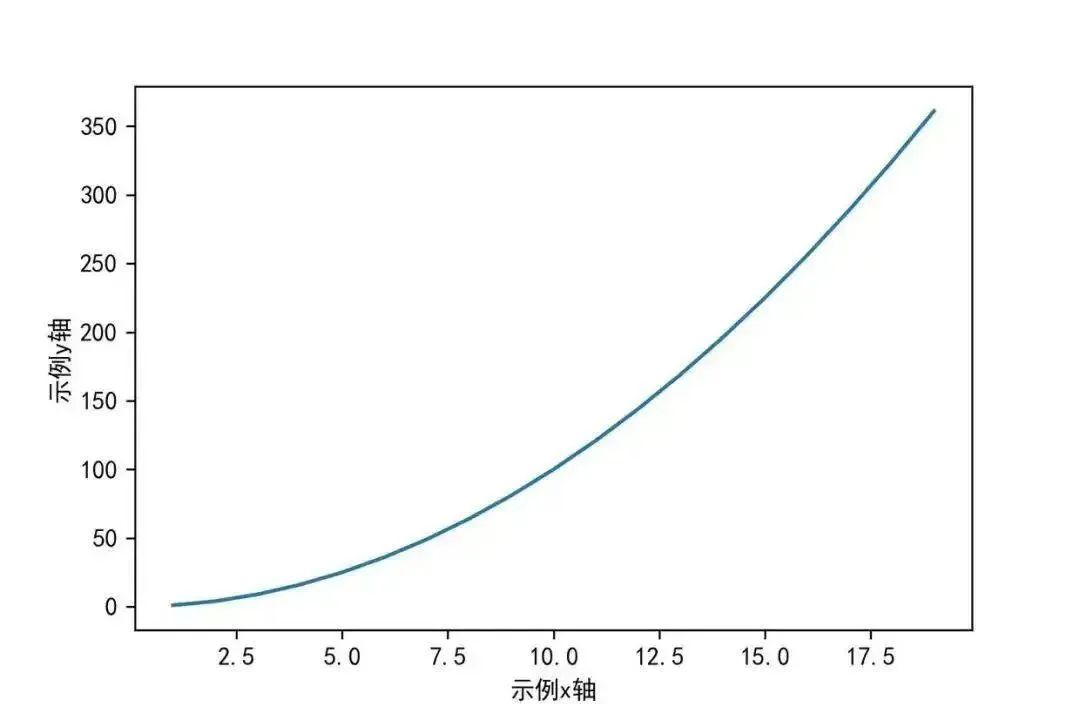
In a two-dimensional coordinate plot, it is necessary to label the names and units of the horizontal and vertical axes. The functions used to set the axis labels are xlabel() and ylabel().
Import numpy as np
import matplotlib.pyplot as plt
# Display Chinese
plt.rcParams[‘font.sans-serif’] = [u’SimHei’]
plt.rcParams[‘axes.unicode_minus’] = False
%matplotlib inline
x=np.arange(1,20)
plt.xlabel(‘Sample x-axis’)
plt.ylabel(‘Sample y-axis’)
plt.plot(x,x*x)
plt.show()
 05Add Legend – legend
When there are too many lines, different colors can be used to distinguish between them. Therefore, it is necessary to label the different colored lines using the legend() function.
Import numpy as np
import matplotlib.pyplot as plt
# Display Chinese
plt.rcParams[‘font.sans-serif’] = [u’SimHei’]
plt.rcParams[‘axes.unicode_minus’] = False
%matplotlib inline
plt.plot(x,x)
plt.plot(x,x*2)
plt.plot(x,x*3)
plt.plot(x,x*4)
# Directly pass in legend
plt.legend([‘Life’,’Beauty’,’Work’,’Money’])
plt.show()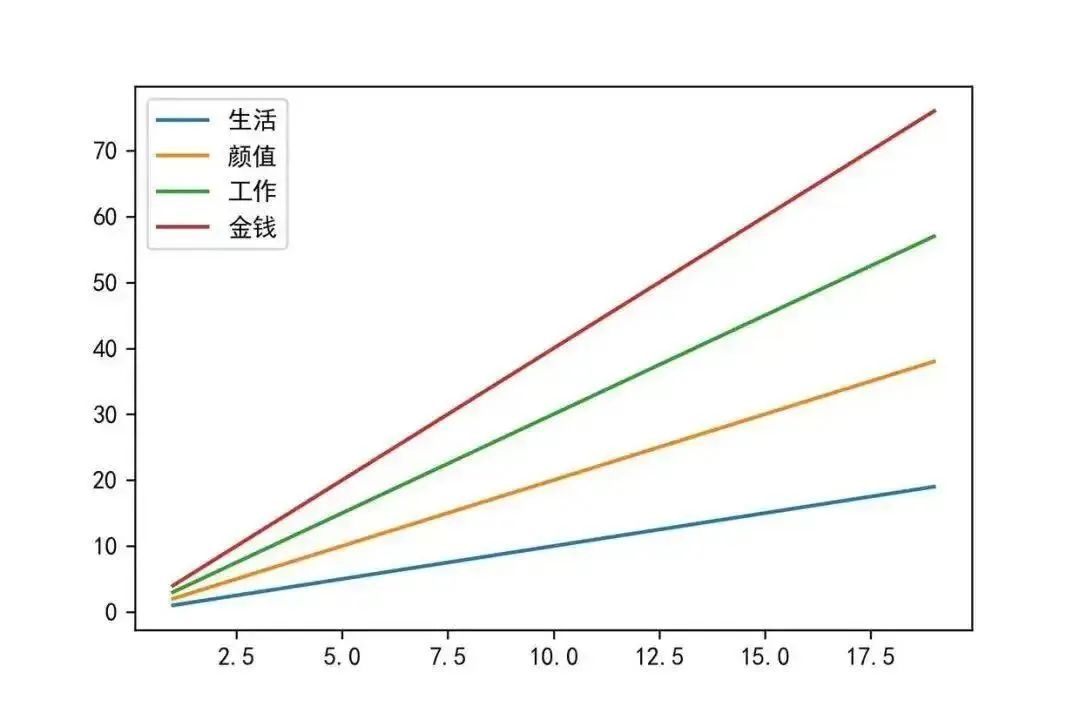
 06Adjust Color – color
For color parameters, use the color attribute in plot() to set the color, which supports the following methods.
Import numpy as np
import matplotlib.pyplot as plt
%matplotlib inline
x=np.arange(1,5)
# Various ways to specify color
plt.plot(x,color=’g’)
plt.plot(x+1,color=’0.5′)
plt.plot(x+2,color=’#FF00FF’)
plt.plot(x+3,color=(0.1,0.2,0.3))
plt.show()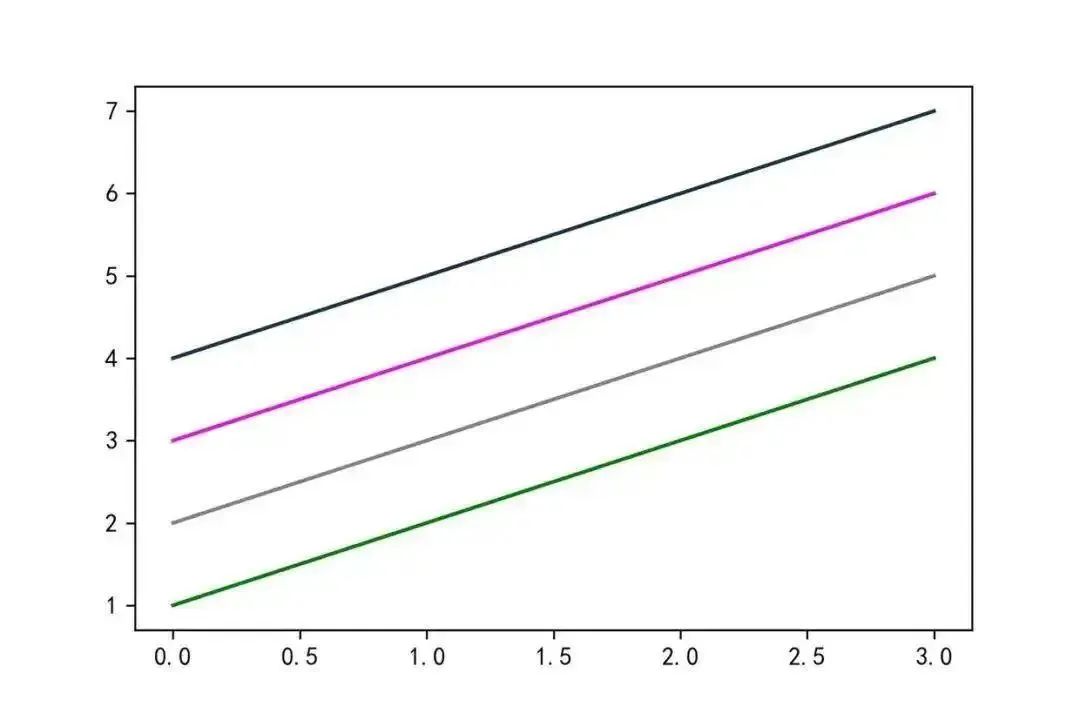
07Switch Line Style – marker
If you want to change the style of the line, you can modify the marker parameter in the plot() function, with the following effects:
Import numpy as np
import matplotlib.pyplot as plt
%matplotlib inline
x=np.arange(1,5)
plt.plot(x,marker=’o’)
plt.plot(x+1,marker=’>’)
plt.plot(x+2,marker=’s’)
plt.show()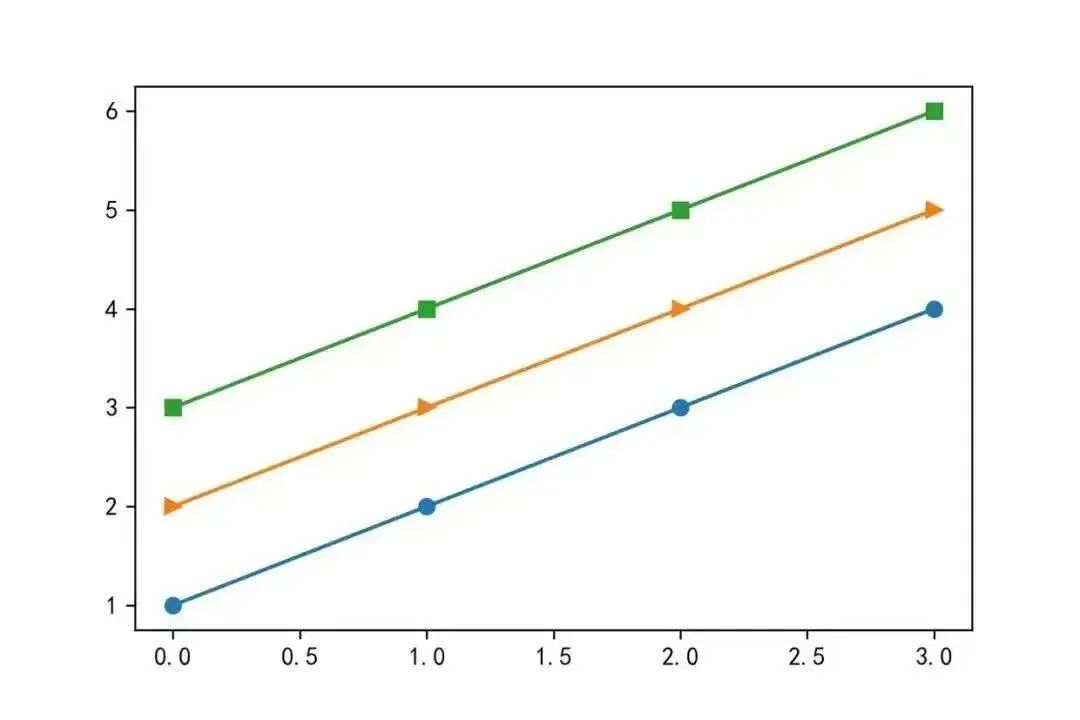
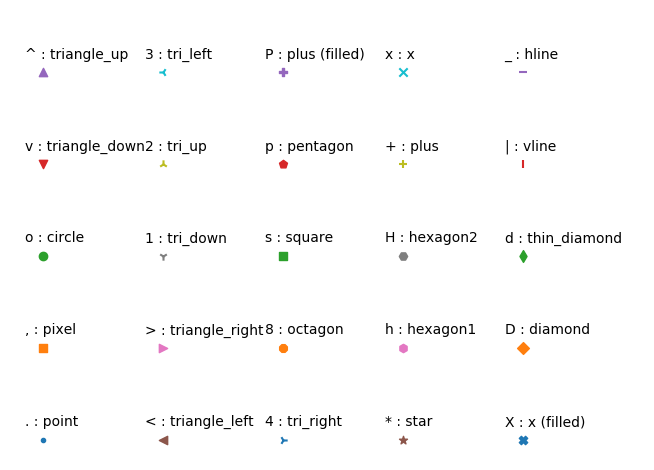
The supported types for marker are as follows:
‘.’: point marker
‘,’: pixel marker
‘o’: circle marker
‘v’: triangle down marker
‘^’: triangle up marker
‘<‘: triangle left marker
‘>’: triangle right marker
‘1’: (tri down marker)
‘2’: (tri up marker)
‘3’: (tri left marker)
‘4’: (tri right marker)
‘s’: square marker
‘p’: pentagon marker
‘*’: star marker
‘h’: hexagon1 marker
‘H’: hexagon2 marker
‘+’: plus marker
‘x’: x marker
‘D’: diamond marker
‘d’: thin diamond marker
‘|’: vertical line marker
‘_’: horizontal line marker
The specific effects of each type are as follows:
 END
END
Editor for this issue: Cui Jiapei
Proofreader: Shi Lina
Previous Issues #
5G-A+ Intelligent Computing + DeepSeek Large Model Empowering Low-altitude Economic Full-process Solution and Case Advanced Training Class Notification
# Academic Innovation VS Format Norms? Balancing this will help your paper achieve a “win-win” publication#
For the clumsy, rejoice, you will become a master after reading!
# National Two Sessions | Enhance the construction level of first-class journals and strengthen digital service capabilities Scan to follow usEditorial Office Phone: 029-83229007Submission Website: http://www.xddz.com.cn/