Matlab Winter Break: Plot and Subplot Functions

Matlab Winter Break: Plot and Subplot Functions

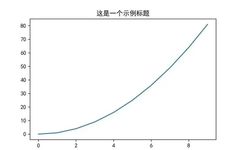
1. Plot Function Draw a Curve Function format: plot(x,y), where x and y are coordinate vectors. Function purpose: To draw a curve with vector x as the x-axis and y as the y-axis. Draw Multiple Curves in the Same Plot plot(x,y1,x,y2,x,y3) uses the common vector x for the x-axis, and y1, y2, y3 for the … Read more

Create a 3D Dynamic Universe Generator with Python

Create a 3D Dynamic Universe Generator with Python

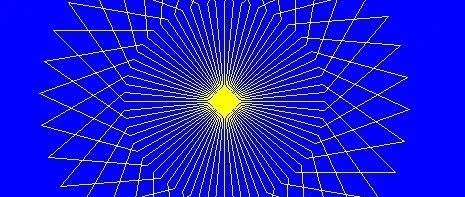
Introduction Interesting Introduction Have you ever looked up at the starry sky and imagined creating a universe with your own code? Today we will realize this dream! By programming in Python, we will build a 3D dynamic universe generator that allows you to simulate the magnificent beauty of the starry sky on your screen. This … Read more

Displaying Mathematical Formulas in Python with Matplotlib and LaTeX

Displaying Mathematical Formulas in Python with Matplotlib and LaTeX

Hello, welcome to Crossin’s Programming Classroom! For those engaged in scientific research, mathematical formulas are indispensable. However, displaying mathematical formulas in the program’s output can be quite challenging. This article will introduce how to use LaTeX formulas and symbols in Matplotlib, as well as how Python can generate LaTeX mathematical formulas. 1. Using LaTeX formulas … Read more