Step-by-Step Guide to Interactive Data Visualization with Bokeh in Python

Step-by-Step Guide to Interactive Data Visualization with Bokeh in Python

Compiled by: Huang Nian, Xi Xiongfen Proofread by: Wang Jing Image source: bokeh.pydata.org ◆ ◆ ◆ Introduction Recently, I have been watching a video from the SciPy 2015 conference held in Austin, Texas, titled “Creating Python Data Applications with Blaze and Bokeh,” and I can’t help but repeatedly think about the powerful capabilities these two … Read more

Introduction to the Matlab Quick Start and Advanced Video Tutorial

Introduction to the Matlab Quick Start and Advanced Video Tutorial

Lecture 1: How to Install Matlab 2010 Summary: This section introduces the installation process for friends who are trying to install Matlab 2010 for the first time. The installation process for later versions can be used as a reference. Lecture 2: Quickly Familiarize Yourself with the Matlab Working Environment Summary: Familiarizing yourself with the Matlab … Read more

Learn MATLAB Plotting: A Step-by-Step Guide

Learn MATLAB Plotting: A Step-by-Step Guide

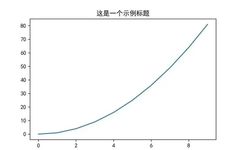
Click the blue text to follow us…… Tips for Plotting Data (Part 1)01Add Title – title The title() function in the matplotlib.pyplot object can be used to set the title of the plot. Import numpy as np import matplotlib.pyplot as plt # Display Chinese plt.rcParams[‘font.sans-serif’] = [u’SimHei’] plt.rcParams[‘axes.unicode_minus’] = False %matplotlib inline x=np.arange(0,10) plt.title(‘This is … Read more