 Title:Hierarchical Drivers Shaping the Global Patterns of Soil Organic Carbon
Research Background
- Research Question: This article aims to address the hierarchical driving factors behind the global distribution patterns of Soil Organic Carbon (SOC). Although numerous studies have explored the formation and variation mechanisms of SOC, there is limited systematic research on the multi-level driving factors of SOC.
- Research Challenges: The challenges in this research include: how to systematically integrate multiple independent datasets to reveal the global distribution patterns of SOC; how to accurately quantify the impact pathways and relative contributions of driving factors such as climate and soil properties on SOC.
- Related Work: Previous studies have indicated that climate and soil properties are significant factors affecting SOC, but most of these studies focus on single factors or shallow soil, lacking a systematic analysis of global SOC distribution patterns.
Research Methods
This paper proposes a comprehensive framework to address the hierarchical driving factors of global SOC distribution patterns. Specifically,
- Estimation of Soil Carbon Turnover Time: First, using the International Soil Radiocarbon Database (ISRaD v1.7.8) and additional literature search data, the soil carbon turnover time for different soil layers is calculated. The soil carbon turnover time is estimated using a steady-state model (single pool model), assuming a uniform carbon pool, and utilizing the decay of radioactive carbon-14 (Δ14C) from atmospheric nuclear tests to estimate the turnover time of carbon atoms in the soil.
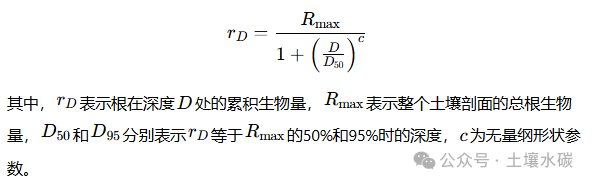
- Estimation of Carbon Input: Second, the carbon input at different soil depths is estimated. Carbon input is represented by the belowground net primary productivity (DBNPP), predicting DBNPP using soil physicochemical property data from multiple databases. The formula is as follows:
- Selection of Environmental Variables: Additionally, various environmental variables were selected, including climate conditions, soil physicochemical properties, topographical features, human activities, and soil biology. Climate variables include mean annual temperature (MAT) and mean annual precipitation (MAP), while soil physicochemical properties include soil texture, cation exchange capacity (CEC), and iron (Fe) content.
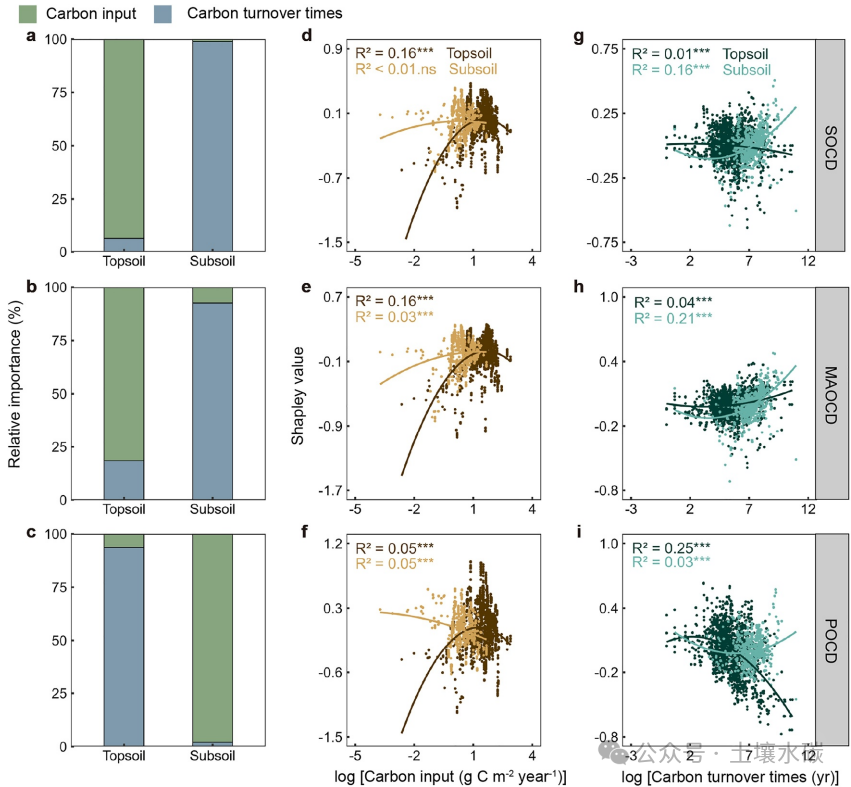
- Statistical Analysis and Path Models: The Lindeman-Merenda-Gold (LMG) method and Shapley values (SHAP) were used to analyze the relative contributions of carbon input and turnover time to SOC and its components (particulate organic carbon POC and mineral-associated organic carbon MAOC). Meanwhile, a partial least squares path model (PLS-PM) was employed to analyze the direct and indirect effects of environmental factors on SOC patterns.
Experimental Design
- Data Collection: The dataset includes soil radiocarbon data, belowground net primary productivity data, climate variable data, soil physicochemical property data, and soil biological data. Soil radiocarbon data is sourced from the International Soil Radiocarbon Database, belowground net primary productivity data is derived from a comprehensive analysis of multiple databases, climate variable data comes from WorldClim version 2.1, soil physicochemical property data is from the SoilGrids database, and soil biological data is from published literature.
- Sample Selection: The study analyzed the 0-50 cm soil profile, divided into surface soil (0-20 cm) and subsurface soil (30-50 cm). Surface soil is the primary area for plant growth and microbial activity, while subsurface soil has undergone a longer decomposition process.
- Parameter Configuration: In the path model analysis, various environmental variables were used, and their direct and indirect effects on SOC were assessed using partial least squares. The model’s performance was evaluated using the goodness-of-fit (GoF) index, with a GoF value greater than 0.50 indicating good model fit.
Results and Analysis
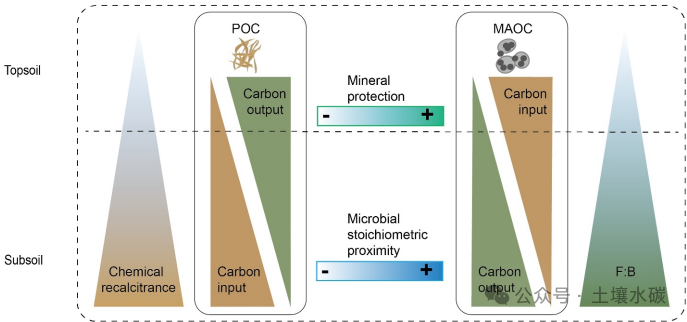
- Relative Contributions of Carbon Input and Output: Carbon input contributes the most to surface soil SOC, accounting for 94%, while its impact on subsurface soil SOC is minimal. Conversely, carbon turnover time has the greatest contribution to subsurface soil SOC, contributing 99%, while its effect on surface soil SOC is small.
- Impact of Environmental Factors: Climate is the primary driving factor, significantly affecting surface soil SOC by influencing carbon input pathways. Soil properties have a stronger impact on subsurface soil SOC by affecting carbon output pathways.
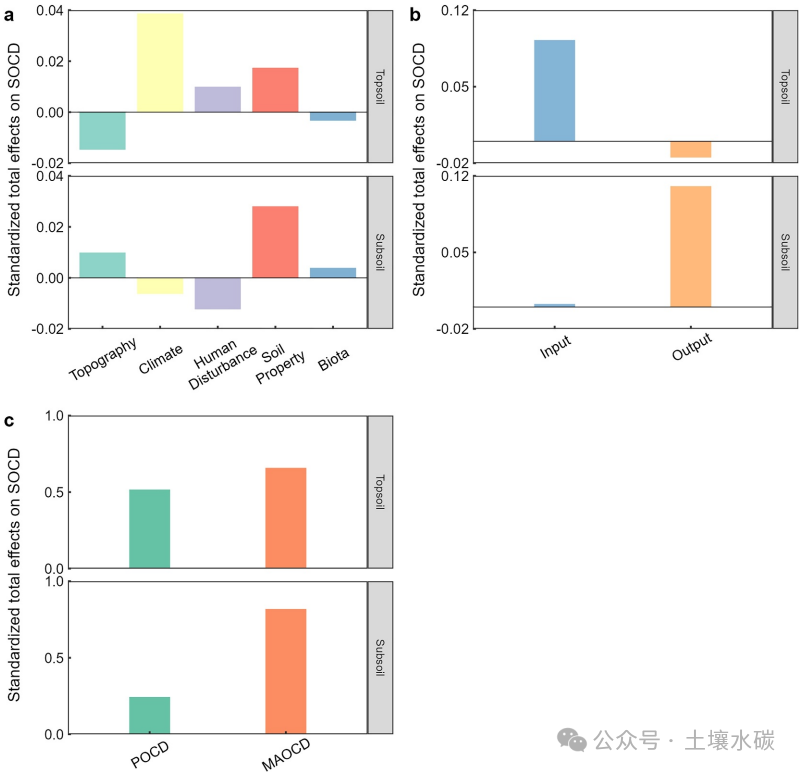
- Hierarchical Impact of Carbon Input and Output: Carbon input primarily affects the MAOC of surface soil, while carbon output mainly influences the MAOC of subsurface soil. Conversely, carbon input has a significant impact on the POC of surface soil, while carbon output has a smaller effect on the POC of subsurface soil.
Overall Conclusion
This paper quantifies for the first time the impact pathways and strengths of driving factors such as climate and soil properties on global SOC distribution patterns. The study finds that climate significantly affects surface soil SOC primarily by influencing carbon input pathways, while soil properties significantly affect subsurface soil SOC mainly by influencing carbon output pathways. This finding emphasizes the importance of considering the hierarchical structure and relative contributions of these driving factors when assessing and predicting SOC dynamics. The results of this study help reduce uncertainties in global carbon predictions and provide guidance for sustainable soil and ecosystem management.Paper Evaluation
Strengths and Innovations
- Integration of Multi-source Data: The paper integrates multiple independent datasets, including productivity, carbon allocation, carbon turnover, and carbon fractions, to construct a comprehensive framework for studying the hierarchical driving factors of global soil organic carbon (SOC) patterns.
- Clear Impact Pathways: Through path analysis, the paper clarifies how major environmental factors such as climate and soil properties influence the spatial distribution of SOC and its components (particulate organic carbon POC and mineral-associated organic carbon MAOC).
- Hierarchical Driving Structure: For the first time, the paper quantifies the impact pathways and relative strengths of hierarchical driving factors such as climate and soil properties on global SOC patterns, emphasizing the need to consider the hierarchical structure of these driving factors when assessing SOC magnitude.
- Relative Contributions of Carbon Input and Output: The paper provides a detailed analysis of the contributions of carbon input and output in different soil layers (surface and subsurface) to SOC, finding that carbon input plays a dominant role in surface soil, while carbon output is more influential in subsurface soil.
- Stable Forms of Organic Carbon: The paper explains the role of these driving factors primarily through their impact on stable forms of organic carbon (MAOC), revealing differences in the protective mechanisms of different organic carbon forms.
Limitations and Reflections
- Uncertainty in DBNPP Predictions: The uncertainty in DBNPP predictions arises not only from the prediction errors of machine learning models but also to some extent from the simplified assumptions of root vertical distribution models. Although it is assumed that root biomass decreases exponentially with soil depth, recent studies indicate a bimodal pattern of root distribution, which may distort the vertical carbon input allocation.
- Limitations of Subsurface Soil Sampling: Although the analysis focuses on the 0-50 cm soil profile (divided into 0-20 cm surface and 30-50 cm subsurface) to optimize sample size and minimize uncertainty, the relative sparsity of subsurface soil samples introduces additional variability.
- Coarse Temporal and Spatial Resolution of Datasets: The reliance on global datasets, which have coarse temporal and spatial resolutions, is primarily due to the insufficient completeness of regional environmental data reporting in the original studies. This uncertainty arises from the inherent limitations of the environmental datasets themselves, rather than inconsistencies across data sources.
- Key Questions and Answers
Question 1: How is carbon input at different soil depths estimated in the paper, and what data and models are used?Carbon input is represented by belowground net primary productivity (DBNPP), predicting DBNPP using soil physicochemical property data from multiple databases. The specific steps are as follows:
- Data Collection: Belowground net primary productivity (NPP) data primarily comes from peer-reviewed meta-analyses (Xiao et al., 2023), combined with data from other databases.
- Sample Selection: Sites containing NPP, BNPP, and ANPP measurement data were selected, ensuring that the sites were not experimentally treated and that BNPP measurements used the “soil core” or “growth core” methods.
- Model Training: A random forest (RF) model was trained using 747 global f_{BNPP} observations and 16 predictor variables, employing leave-one-out cross-validation and grid search to select the best model.
- Global Scale Estimation: The model was applied to MODIS satellite-derived NPP data to estimate BNPP for various soil layers globally, and the root distribution ratio (f{root}) for each soil layer was calculated using the root biomass database (Schenk & Jackson, 2002), ultimately obtaining f{DBNPP} for each soil layer.
Question 2: How does the paper analyze the impact of environmental factors on soil organic carbon (SOC) patterns, and what statistical and path models are used?
- Statistical Analysis Methods: The Lindeman-Merenda-Gold (LMG) method and Shapley values (SHAP) were used to analyze the relative contributions of carbon input and turnover time to SOC and its components (particulate organic carbon POC and mineral-associated organic carbon MAOC). The LMG method is based on linear regression, assessing the individual contributions of multiple regression quantities; SHAP values are based on random forest models, capturing nonlinear relationships and global interpretability.
- Path Analysis Methods: A partial least squares path model (PLS-PM) was employed to analyze the direct and indirect effects of environmental factors on SOC patterns. The model’s performance was evaluated using the goodness-of-fit (GoF) index, with a GoF value greater than 0.50 indicating good model fit. The PLS-PM model considers both direct and indirect effects, revealing how environmental factors influence SOC distribution by affecting carbon input and output pathways.