Filling the Gap! The First Multi-Sensor PMSM Fault Diagnosis Open Dataset is Now Online| |The open dataset aids in publication
1. Introduction
This article introduces a new, comprehensive dataset for Fault Detection and Diagnosis (FDD) in inverter-driven Permanent Magnet Synchronous Motor (PMSM) systems. Despite the increasing importance of AI-driven FDD technologies, there is still a lack of publicly accessible real datasets for algorithm development and evaluation in this field. Our contribution fills this gap by providing a comprehensive multi-sensor dataset obtained from custom experimental equipment. The dataset includes various fault conditions such as open circuit faults, short circuit faults, and overheating conditions of the inverter switches. It contains 8 raw sensor measurements and 15 derived features, recorded at 10 Hz, totaling 10,892 samples across 9 operating conditions (one normal and eight fault types). Through this dataset, we aim to accelerate research in AI-driven fault identification and diagnosis for power-driven systems.The Value of the Data:
- This dataset provides immense value by offering comprehensive real measurements of inverter-driven PMSM systems under various fault conditions. These measurements are crucial for developing and validating fault detection algorithms, meeting critical needs in the field.
-
A notable feature of this dataset is its integration of multiple sensor types, combining current, voltage, and temperature measurements with various fault scenarios.
- The dataset has broad industrial applications, covering several key areas. It supports predictive maintenance programs in manufacturing facilities, enhances quality control processes in production environments, and enables reliability assessments in operational settings. This data is valuable for condition monitoring applications, the development of automated diagnostic tools, training for maintenance personnel, and the validation of fault detection systems.
2. Test Bench Introduction
The basic layout of the test bench is shown in the figure below: 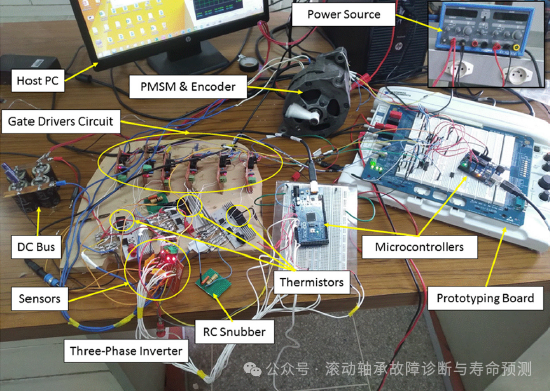 Figure 1.Experimental Setup DiagramThe experimental setup consists of four main subsystems: power electronic inverter, Permanent Magnet Synchronous Motor (PMSM), control system, and data acquisition system, as shown in Figure 1. This setup is designed to achieve comprehensive fault simulation and data collection under various conditions.
The power electronic inverter design incorporates several carefully selected key components to achieve optimal performance and reliability. The core of the system is powered by a 15 V DC power supply and utilizes six IRF540 N MOSFETs arranged in three half-bridges for power conversion. The HCPL3120 gate driver provides necessary isolation and driving capability for the switching devices. To ensure stable operation, the inverter includes a 2200 μF capacitor bank as a voltage-stabilizing DC link, supplemented by two RC snubber circuits (10Ω, 2.2 nF) strategically placed to suppress voltage spikes.
The inverter’s protection system features multiple safeguards to ensure reliable operation. The gate driver provides current isolation between the control circuit and the power circuit, while the B1215S-2W isolated DC/DC module supplies a regulated 15 V power source for the gate driver and floating power supply. To minimize electromagnetic interference, the DC bus terminals integrate snubber circuits to ensure clean power quality and stable system operation.
The Permanent Magnet Synchronous Motor (PMSM), modified from a DENSO automotive alternator, has the following technical specifications:
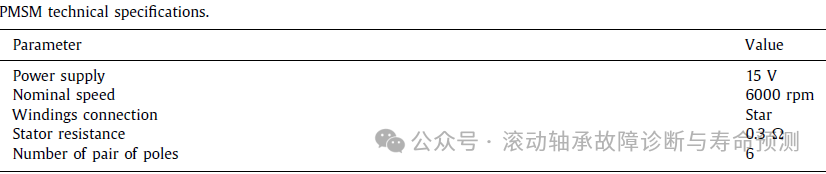
The control system architecture centers around an Arduino Uno microcontroller board, connected to a SCANCON 2RHF-100-583801 encoder (100 PPR) for precise position feedback. The system employs the SimpleFOC project to implement field-oriented control, maintaining constant speed control at 10 rad/s. For power modulation, the system uses bipolar (pulse width modulation) PWM technology, utilizing three inverters based on 74LS04 logic gates, where the sine wave reference is compared with a triangular carrier to generate six complementary PWM signals for the three half-bridges.
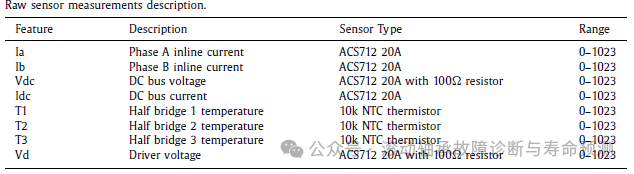
The sensor integration system achieves comprehensive monitoring through various measurement types. Current measurements utilize ACS712 20A Hall effect sensors, with two sensors monitoring the line phase currents (Ia, Ib) and one sensor measuring the DC bus current (IDC). These sensors operate within a ±20A range, with a sensitivity of 100 mV/A. Voltage measurements are completed using ACS712 sensors with a 100Ω series resistor, monitoring the DC bus voltage (VDC) and low-side MOSFET driver voltage (VD). Temperature monitoring employs 10kΩ NTC thermistors configured in a voltage divider with a 10kΩ fixed resistor. Each half-bridge contains a thermistor, operating in a temperature range of −40 °C to 105 °C, and is equipped with a 10 nF capacitor to reduce noise.
System integration includes three key aspects: mechanical, electrical, and thermal management. Mechanical components ensure rigid mounting of inverter components, proper thermal contact for temperature sensors, and secure positioning of the encoder. Electrical integration features shielded cables for sensor signals, optimized short paths for power connections, and robust grounding schemes. Thermal management is achieved through strategically placed heat sinks on power devices, appropriate application of thermal paste, and distributed temperature monitoring points throughout the system.
3. Data Description and Processing
The data collection method is executed using a comprehensive system that combines multiple sensors and data processing elements. Figure 2 describes the comprehensive data collection workflow, including sensor measurements to final data storage. The flowchart illustrates the basic components and processes.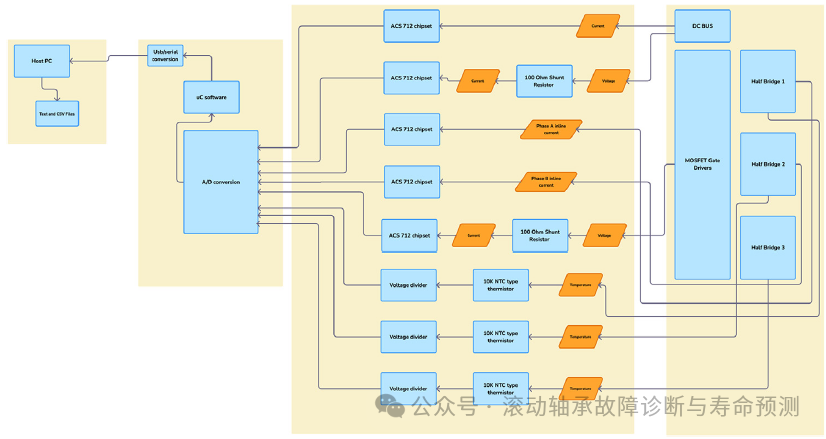 Figure 2.Flowchart of the Data Acquisition SystemThe dataset includes raw measurements, processed features, and documentation organized in directories. Figure 3 provides a detailed file organization.
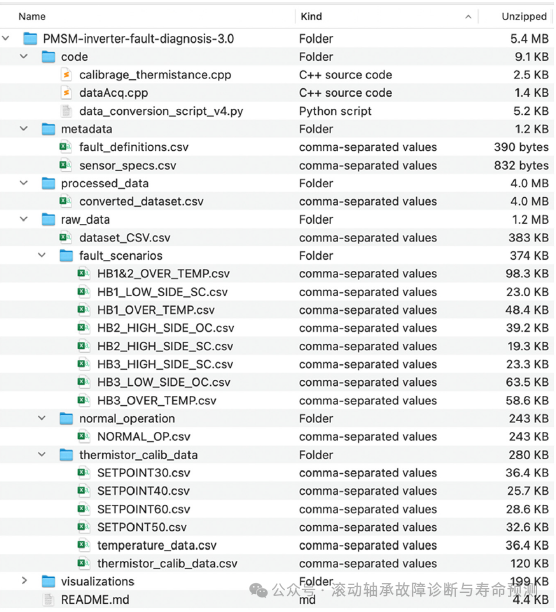 Figure 3.File OrganizationIn Figure 4, only the main folder is displayed. Detailed description of the dataset organization:
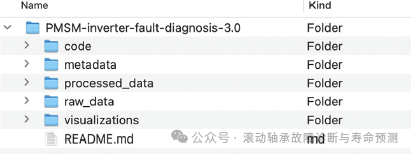 Figure 4.Main Folder
Root Folder: PMSM-inverter-fault-diagnosis-3.0 (5.4 MB) This is the main dataset folder containing all components of the fault diagnosis system.
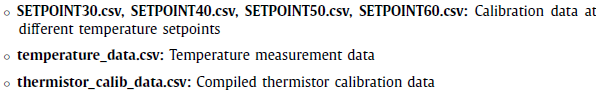
normal_operation subfolder (243 KB):

thermistor_calib_data subfolder (280 KB):
visualization folder (199 KB): Contains generated plots and visual representations of the data.
README.md (4.4 KB): Contains documentation files with an overview of the dataset, usage instructions, and other relevant information.
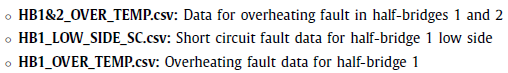
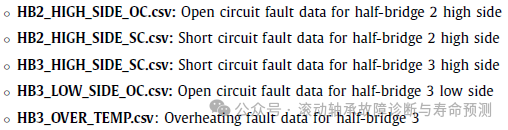
The dataset includes readings from eight sensors sampled at 10 Hz, totaling 10,892 samples. Table 1 describes the raw measurements:
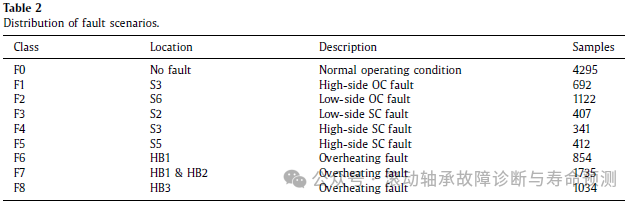
The dataset includes nine different operating conditions, including normal operation and eight fault scenarios. Table 2 shows the distribution of samples under the following conditions:
Based on the raw measurements, 15 derived features were calculated to facilitate fault detection and diagnosis. Table 3 describes these features:
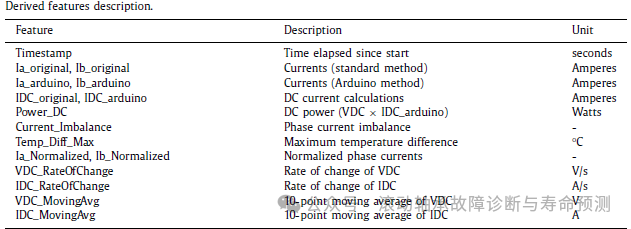
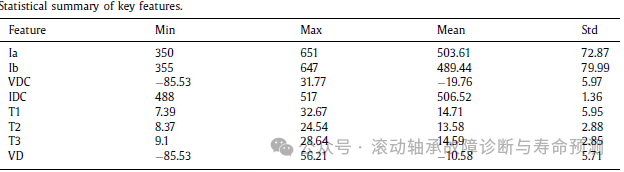
Table 4 lists the main statistics of the primary features:
The dataset includes several visualizations to illustrate different aspects of the collected data. These visualizations showcase the various fault conditions captured in the dataset and highlight the unique characteristics of each operating state. Statistical insights in Figures 5, 6, and 7 provide an overall understanding of data distribution and feature relationships.
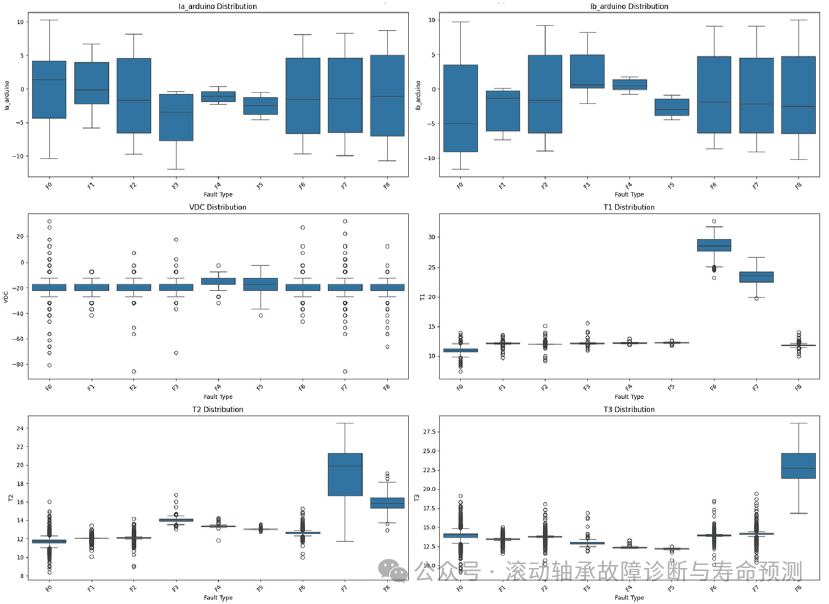
Figure 5.Box plot visualization of key features showing measurement distribution under different operating conditions
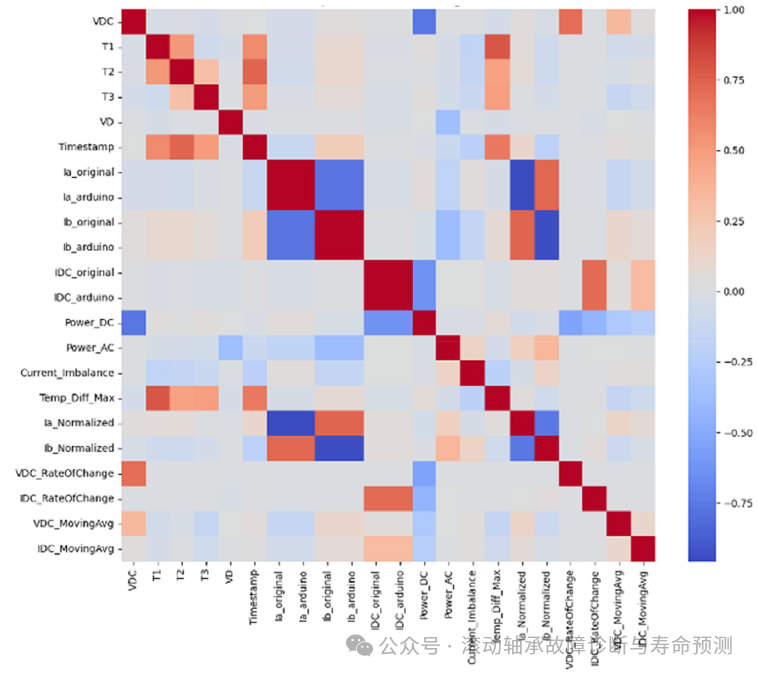
Figure 6.Correlation heatmap
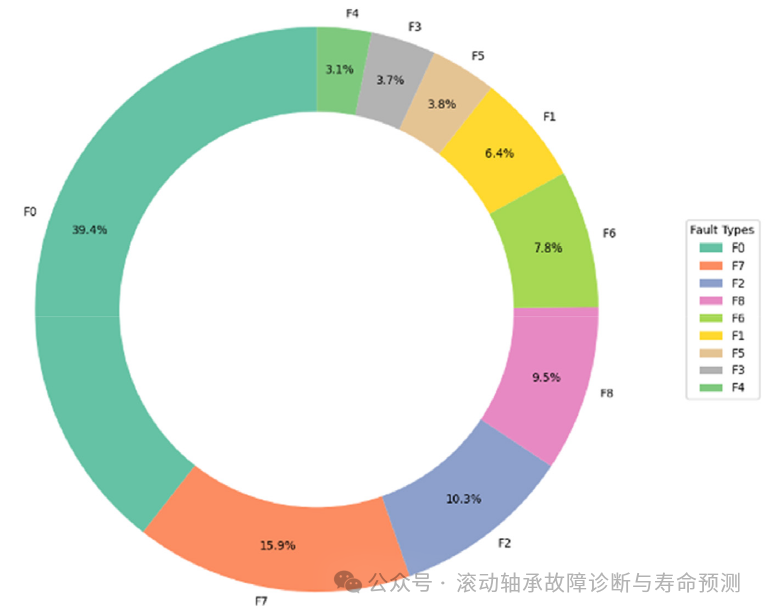
Figure 7.Distribution of fault types in the dataset
Figure 5 provides a box plot visualization of key features showing measurement distribution under different operating conditions. The box plot illustrates the statistical distribution of each feature, highlighting variations between normal operation and different fault conditions. In Figure 6, the correlation heatmap displays relationships between different features in the dataset. The intensity of the color indicates the strength of correlation between features, with darker colors representing stronger correlations. Figure 7 shows the distribution of fault types in the dataset. The pie chart illustrates the relative proportions of each fault scenario (F1-F8) and normal operating condition (F0), indicating the balance of different operating states in the dataset.
Time series plots (Figures 8, 9, and 10) show the distinct transitions between normal operation and various fault conditions. Figure 8 displays the time series of phase currents, showcasing the electrical behavior of the system under normal operation and fault conditions. This figure reveals significant differences in current patterns between different operating states.
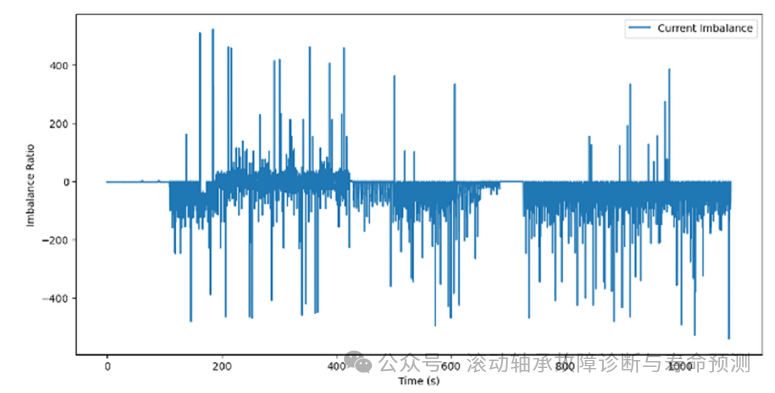
Figure 8.Time series of phase current imbalance
Figure 9 presents the time series of DC bus measurements, showing variations in DC bus voltage and current. These measurements provide important information regarding power stability and system response under fault conditions.
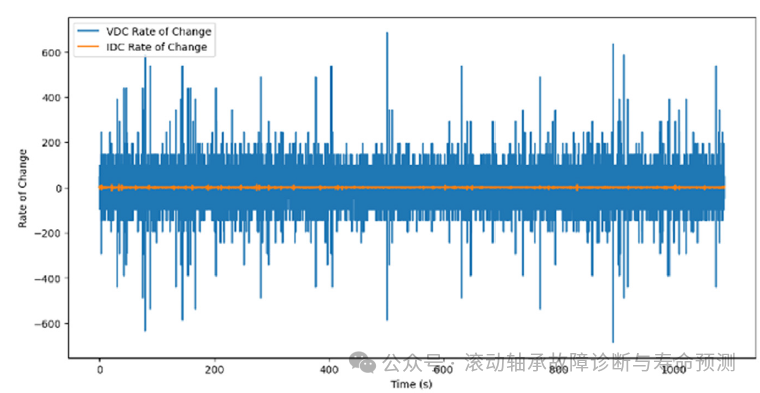
Figure 9.Time series of DC bus measurements showing variations in DC bus voltage and current
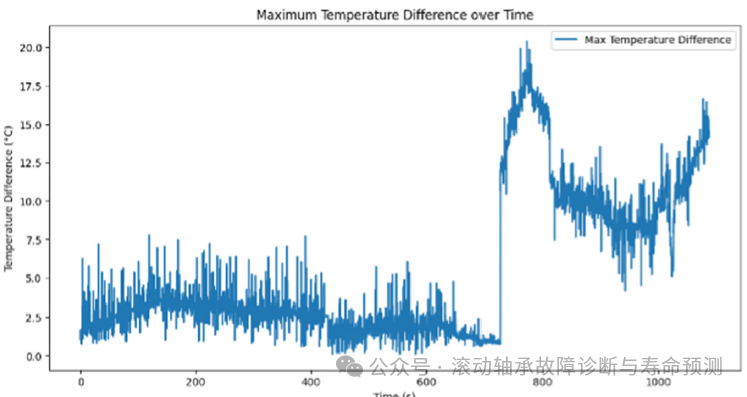
Figure 10.Time series of temperature measurements from the three half-bridges
Figure 10 displays the time series of temperature measurements from the three half-bridges. The temperature curves clearly indicate thermal behavior under normal operation and overheating fault conditions, showing distinct patterns for different fault scenarios.
The visualizations reveal several important insights about the dataset. The current waveforms exhibit different patterns that can clearly distinguish open circuit and short circuit faults, providing strong diagnostic indicators. Temperature measurements show significant changes under overheating conditions, enabling early detection of thermal issues. The analysis reveals strong correlations between certain features, which are particularly valuable for developing fault detection algorithms. The dataset also demonstrates a balanced distribution of fault scenarios, ensuring comprehensive coverage of various operating conditions. Overall, these visualizations effectively showcase the various fault conditions captured in the dataset and highlight the clear distinctions between normal operation and various fault scenarios.
4. Limitations
The dataset has two main limitations related to data acquisition parameters. First, raw sensor measurements were collected without real-time signal filtering or conditioning, meaning the data contains environmental noise and potential electromagnetic interference from switching devices. Users of this dataset may need to implement appropriate digital filtering techniques during preprocessing to optimize signal quality for their specific applications.
Second, the data acquisition system operates at a relatively low sampling rate of 10 Hz, which, while sufficient to capture thermodynamic and steady-state behavior, may not fully capture high-frequency switching transients or rapid fault progression dynamics. This sampling rate limitation is due to hardware constraints in the Arduino-based acquisition system. These limitations also restrict the number of measurements that can be taken simultaneously. Future versions of this dataset will address these limitations by implementing hardware filtering, increasing the sampling rate, and adding additional sensor channels to provide a more comprehensive set of fault features.
5. Download Method:
Link: https://pan.baidu.com/s/1DfA-ez_mUZx0-6u8RWopJQ?pwd=g5mr
Previous Recommendations[1]Open-source dataset of current, temperature, sound, and vibration | Introduction to the bearing fault dataset from the Korea Institute of Science and Technology[2]Paper Recommendation || A Review of Physics-Based Data-Driven Remaining Useful Life Prediction: Challenges and Opportunities[3]Paper Recommendation || A Review of Deep Learning Methods for Small Sample Fault Diagnosis of Rotating Machinery[4]Paper Recommendation || Deep Learning Methods for Bearing Fault Detection Based on Physical Information[5]Beginner’s Guide to Installing Pytorch (including installation of both CPU and GPU versions)[6]Beginner’s Guide to Installing Tensorflow-gpu (Win11, Anaconda3, Python3.9)[7]Open-source dataset || Dutch Navy Electric Motor Pump Motor Current Dataset[8]Preliminary Exploration of Automatic Identification System for Rolling Bearing Faults Based on Deep Learning[9]Diagnosis Home Lingxi Monitoring System V1.0 | Deep Learning Fault Diagnosis Software Developed in Python[10]Diagnosis Home Xuan Gui Monitoring System Software V1.0 Release | Built in Python
Editor: Bai Zhi Xue Jie
Reviewed by: Chunhui, Ruoshui, Zhishan, Luosuo, YifanThe materials in this article are collected from the internet for academic sharing purposes only and are not for commercial use. If there is any infringement, please contact the editor for deletion.Click the lower left cornerRead the original text, to read the paper online.