Table of Contents
Learning Objectives:
Background Introduction:
Learning Content:
1. Introduction to Matlab Functions for Extracting S-Parameters
Usage of sparameters():
Usage of rfparam():
2. Example of Plotting Extracted Data
Learning Objectives:
- Be proficient in using Matlab to extract S-parameters (usually s2p files) and perform plotting analysis.
Background Introduction:
The RF industry often requires processing large amounts of data, including S-parameters collected by vector network analyzers. Since the laboratory computer does not have ADS, I plan to use Matlab for data extraction and plotting analysis. The purpose of writing this article is mainly to document my learning outcomes and share some insights with colleagues who may need it.
Learning Content:
1. Introduction to Matlab Functions for Extracting S-Parameters
Many datasheets for two-port RF chips typically present S11, S21, S12, and S22 plotted on the same graph. The main functions I use are sparameters() and rfparam().
Usage of sparameters():
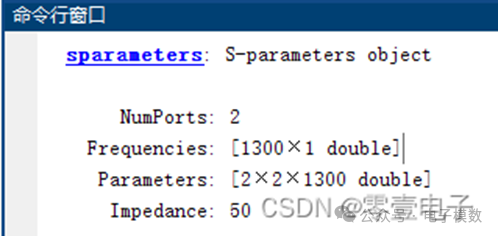
The sparameters() function can return an S-parameters object from an s2p file. The return value can be seen in the Matlab command window as follows:
 The extracted frequency (in GHz) data is as follows:
filename = "E:\Matlab Projects\S-Parameters\2.s2p";
S = sparameters(filename); % S contains: Impedance, NumPorts, Frequencies, Parameters
disp(S);
FreqGHz = S.Frequencies/1e9; % Extract frequency points
disp(FreqGHz);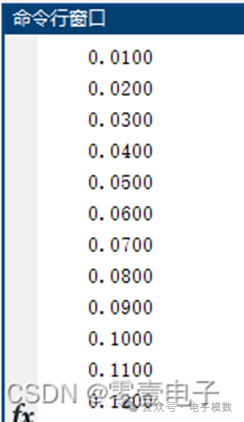
Usage of rfparam():
rfparam(obj,i,j) can return the S-parameter Sij. For example, rfparam(S,2,1) returns the column data of S21 in complex form, where S refers to the return value of the sparameters() function. The code and return value are as follows:
filename = "E:\Matlab Projects\S-Parameters\2.s2p";
S = sparameters(filename);
FreqGHz = S.Frequencies/1e9;
S21 = rfparam(S,2,1);  % In rfparam(S,2,1), 2 refers to the corresponding port 2 of the data file; similarly, 1 refers to port 1.
To visually observe the corresponding values of return loss, gain, and reverse isolation in dB, logarithmic conversion calculations were performed. The code and return values are as follows:
filename = "E:\Matlab Projects\S-Parameters\2.s2p";
S = sparameters(filename);
S11 = 20*log10(abs(rfparam(S,1,1))); % Extract S11 corresponding dB value
S21 = 20*log10(abs(rfparam(S,2,1))); % Extract S21 corresponding dB value
S12 = 20*log10(abs(rfparam(S,1,2))); % Extract S12 corresponding dB value
S22 = 20*log10(abs(rfparam(S,2,2))); % Extract S22 corresponding dB value
disp([S11,S21,S12,S22]); % Display the values of the [S11,S21,S12,S22] two-dimensional array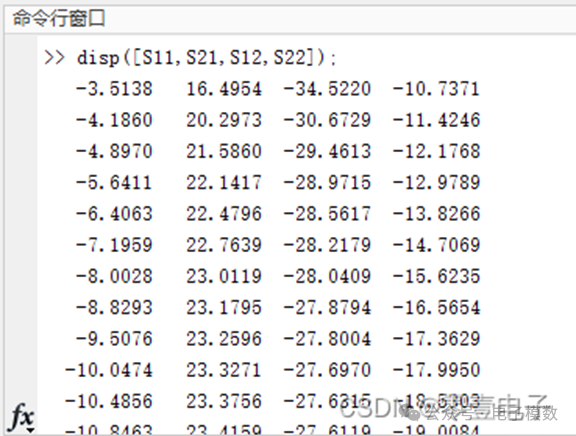
2. Example of Plotting Extracted Data
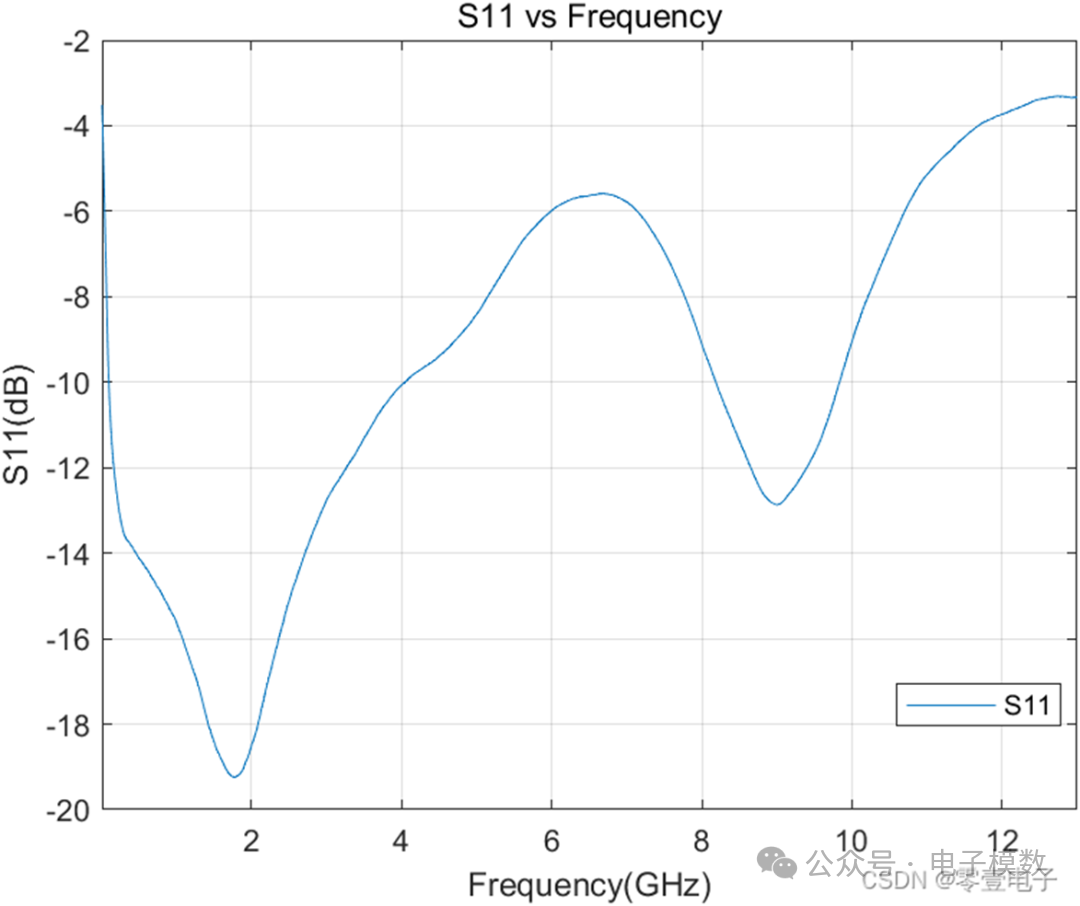
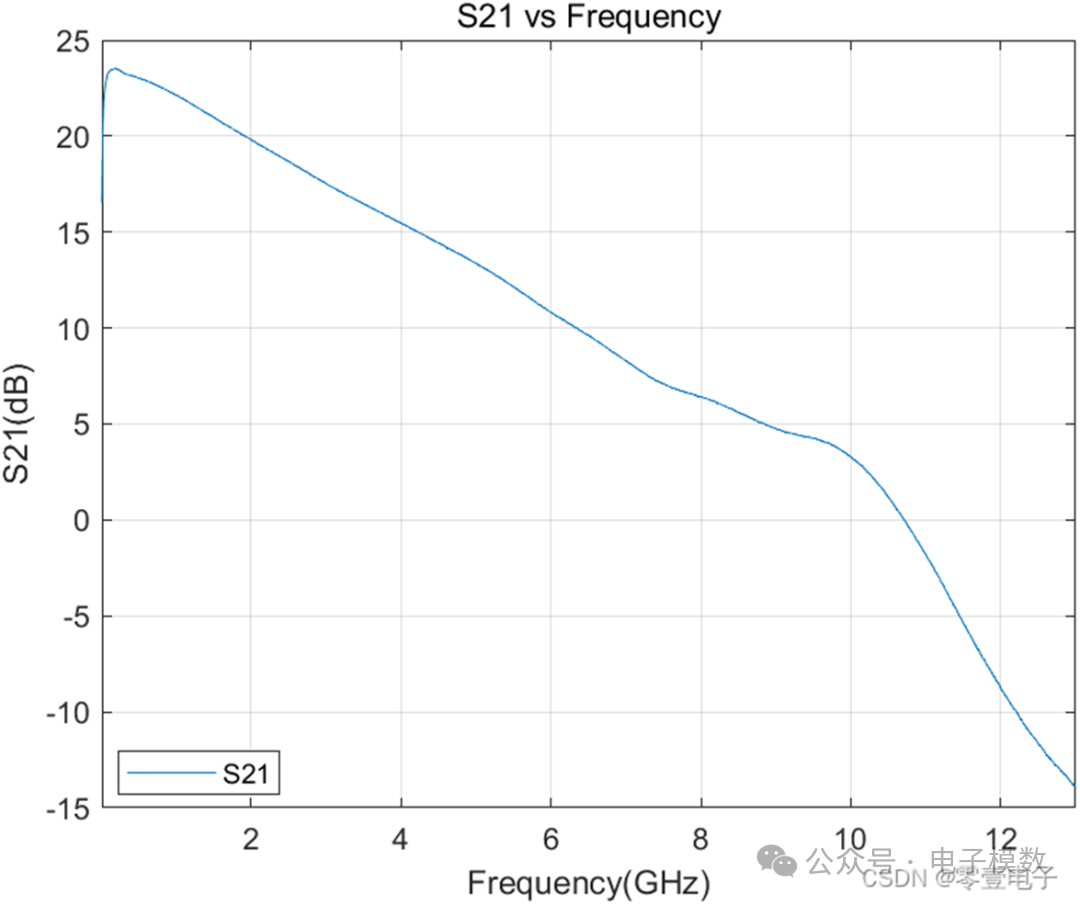
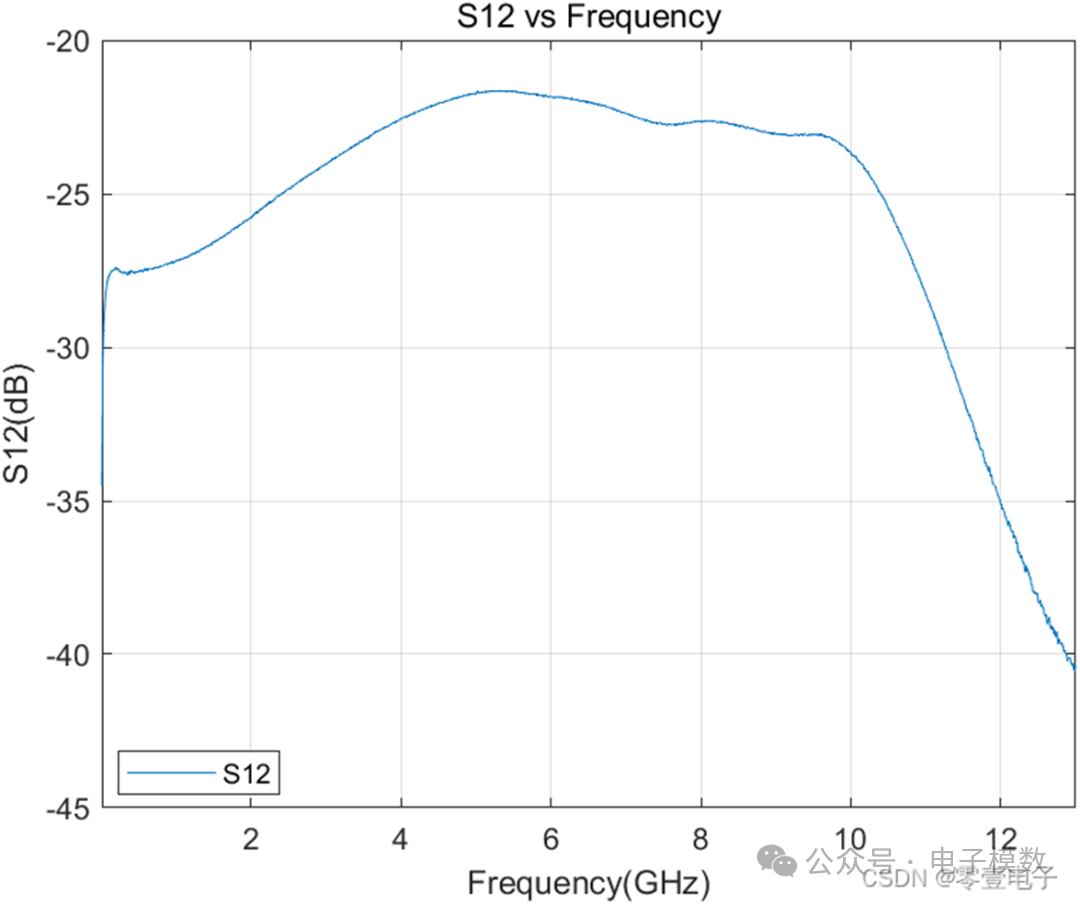
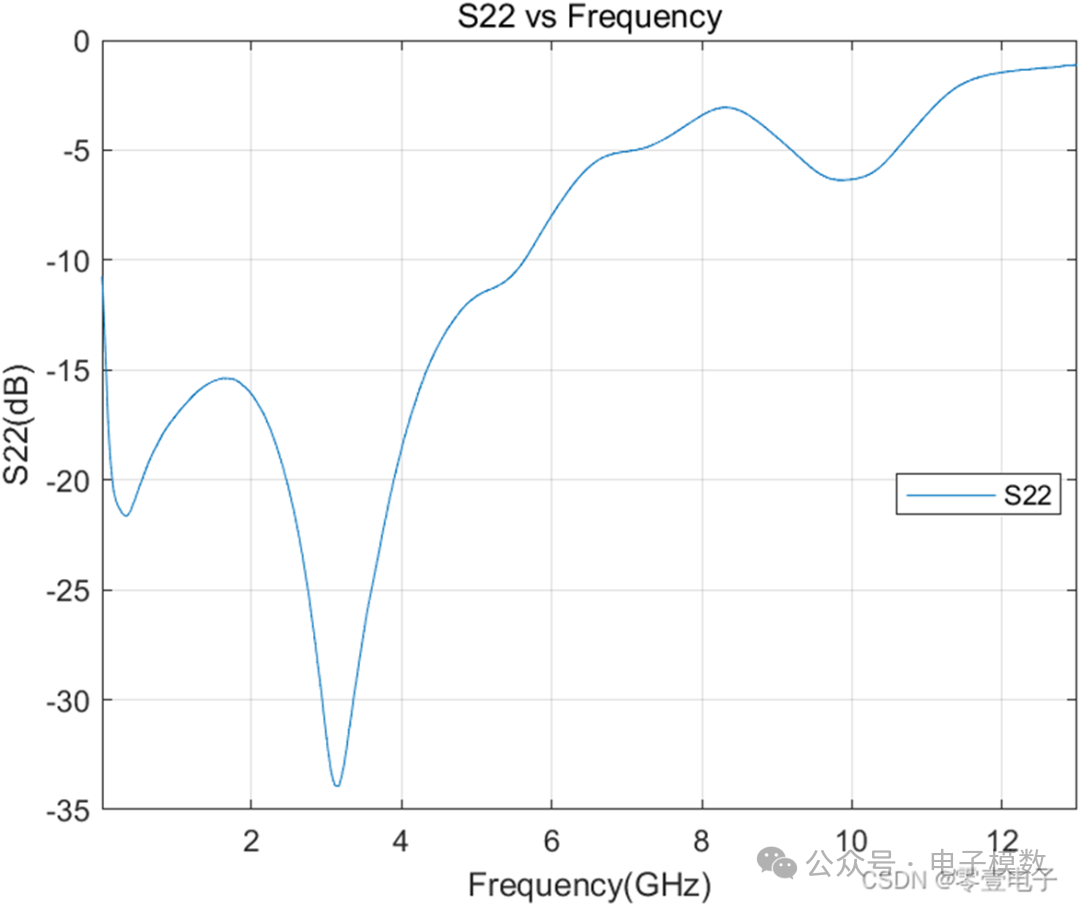
Having extracted the S-parameter data, the next step is to present it through plotting. The plot() function can be used directly for this purpose. Below is the code and image demonstration:
clc
clear
close all
filename = "E:\Matlab Projects\S-Parameters\2.s2p";
S = sparameters(filename);
FreqGHz = S.Frequencies/1e9;
S11 = 20*log10(abs(rfparam(S,1,1)));
S21 = 20*log10(abs(rfparam(S,2,1)));
S12 = 20*log10(abs(rfparam(S,1,2)));
S22 = 20*log10(abs(rfparam(S,2,2)));

figure(1)
plot(FreqGHz,S11);
hold on; % Plotting
grid on; % Add grid
xlim([FreqGHz(1) FreqGHz(end)]); % Set X-axis limits
legend("S11",'Location','best'); % Add legend
title("S11 vs Frequency"); % Add chart title
xlabel("Frequency (GHz)"); % Add X-axis label
ylabel("S11 (dB)"); % Add Y-axis label

figure(2)
plot(FreqGHz,S21);
hold on; % Plotting
grid on; % Add grid
xlim([FreqGHz(1) FreqGHz(end)]); % Set X-axis limits
legend("S21",'Location','best'); % Add legend
title("S21 vs Frequency"); % Add chart title
xlabel("Frequency (GHz)"); % Add X-axis label
ylabel("S21 (dB)"); % Add Y-axis label

figure(3)
plot(FreqGHz,S12);
hold on; % Plotting
grid on; % Add grid
xlim([FreqGHz(1) FreqGHz(end)]); % Set X-axis limits
legend("S12",'Location','best'); % Add legend
title("S12 vs Frequency"); % Add chart title
xlabel("Frequency (GHz)"); % Add X-axis label
ylabel("S12 (dB)"); % Add Y-axis label

figure(4)
plot(FreqGHz,S22);
hold on; % Plotting
grid on; % Add grid
xlim([FreqGHz(1) FreqGHz(end)]); % Set X-axis limits
legend("S22",'Location','best'); % Add legend
title("S22 vs Frequency"); % Add chart title
xlabel("Frequency (GHz)"); % Add X-axis label
ylabel("S22 (dB)"); % Add Y-axis label
Please open in the WeChat client