Abstract:As electronic products become an integral part of daily life, their application in safety-critical automotive systems has become ubiquitous. The International Organization for Standardization (ISO) 26262 standard outlines guidelines for establishing a good safety level in automotive System-on-Chips (SoCs). However, despite adherence to this standard, operational failures may still occur, necessitating Safety Mechanisms (SMs) to mitigate random hardware faults.
However, Safety Mechanisms must undergo meticulous verification and validation phases, often involving fault injection, to ensure they meet standards and function as intended.
This series of articles explores the unique challenges posed by safety-critical SoCs and their safety mechanisms in the automotive domain. In particular, it presents a comprehensive internal fault injection and analysis tool called Fault Injection and Verification Component (FIeVC) designed to streamline the development of safety-critical components at Bosch Sensortec (BST), highlighting its advantages and potential integration challenges. The FIeVC tool is developed in Specman e, utilizing parallel fault simulation to compare mismatch detection between fault-free and faulty systems, consisting of four main components: a monitor, a sequencer, a Bus Functional Model (BFM), and an analyzer.
This series also details the development of preliminary scripts required for generating fault lists and modifying the test platform, both of which are critical aspects for successful fault simulation. The tool is evaluated using the accelerometer data path of a Micro-Electro-Mechanical Systems (MEMS) Inertial Measurement Unit (IMU) platform developed by BST.
Tests conducted to assess the performance of FIeVC indicate that the tool reduces the time for complete fault simulation by 68% compared to traditional tools while maintaining a similar level of Test Coverage (TC). These significant improvements in simulation time are primarily achieved through the use of parallel algorithms and advanced Specman e test flow capabilities for the most critical and time-consuming task, which is the reset process of the Design Under Test (DUT).Note:“Development of Fault Injection Methods and Fault Coverage Analysis for Safety-Critical SoCs” is a series of articles consisting of two parts, “Part 1” and “Part 2.”This is “Part 1”, which provides some technical background in Section 1 to better understand the proposed work and describes the current state of functional safety and fault simulation tools.
In the subsequent release of “Part 2,” we will detail FIeVC itself and the preparatory phase scripts in Section 2. Section 3 explains the steps to execute complete fault simulation activities through XFS for comparison with commercial fault simulation tools. Section 4 presents the results obtained using FIeVC and compares them with those obtained through XFS. Finally, the series concludes with Section 5, which discusses future implementations and ideas and provides concluding remarks.
Original Authors: Alfredo PAOLINO, Matteo SONZA REORDA, Mariagrazia GRAZIANO, Carlo RICCIARDI, Maria Silvia RATTO, Alberto RANERI
Compiled by: Yuan Dongdong, Yuan Xixi


Introduction
Today, electronic products have become a part of our daily lives. Consumer electronics, telecommunications, and avionics are just a few of the many fields where electronic products are a major component of the final product.
The automotive sector is no exception; it is estimated that traditional vehicles today are equipped with about 1,000 SoCs, while this number is at least double in electric vehicles. However, there are significant differences between automotive SoCs and smartphone SoCs, which relate to the potential impact of failures in either of these devices. In fact, the vast majority of automotive SoCs are defined as “safety-critical.”
Safety-critical chips must be designed to operate in systems where chip failures could severely endanger human life, property, or the environment. Therefore, the failure of safety-critical chips can have catastrophic consequences, such as accidents, injuries, or even fatalities. In contrast, the failure of general-purpose application chips usually results in milder consequences, typically limited to operational interruptions or inconveniences.
Anti-lock braking system (ABS) controllers, electronic stability control systems (ESC), or airbag control units (ACU) are just a few examples of safety-critical systems installed in vehicles, and it is easy to imagine the consequences of a single failure in any of these systems.
To limit chip failures and related unfortunate events, the automotive industry adopted the ISO 26262 safety standard in 2011, which focuses on managing and minimizing risks throughout the lifecycle of safety-critical SoCs in road vehicles. This standard was updated in 2018.
ISO 26262 specifies a series of guidelines and activities that should be followed during development to ensure the achievement of Functional Safety (FS), defined as “the absence of unreasonable risk due to hazards caused by the malfunctioning behavior of electrical/electronic (E/E) systems.”
However, even if the specification and design phases are executed according to the ISO 26262 standard, SoCs can never be 100% safe due to some failures that may occur during the operational phase. Therefore, the operational phase of electronic devices is typically divided into three distinct periods, closely related to the failure rate (FR) of the components themselves:
・“Early Failure” period, during which manufacturing defects that may exist in the components manifest and lead to failures. Such failures are referred to as systematic failures, and this phenomenon is known as early failure. During this period, the failure rate decreases over time.
・“Intrinsic Failure” period, during which the threat of systematic defects is lower, but random hardware failures may still occur due to various reasons, such as extreme environmental conditions (temperature, humidity, or dust), exposure to liquids, electrostatic discharge, electromigration effects, etc. During this period, the failure rate remains relatively constant but above zero.
・“Wear-Out” period, during which components begin to show signs of failure due to aging and wear. During this period, the failure rate starts to increase until it reaches an unacceptable level, at which point the components must be replaced.
The failure rate can be plotted on a graph of failure rate versus time, resulting in the so-called bathtub curve (Figure 1).
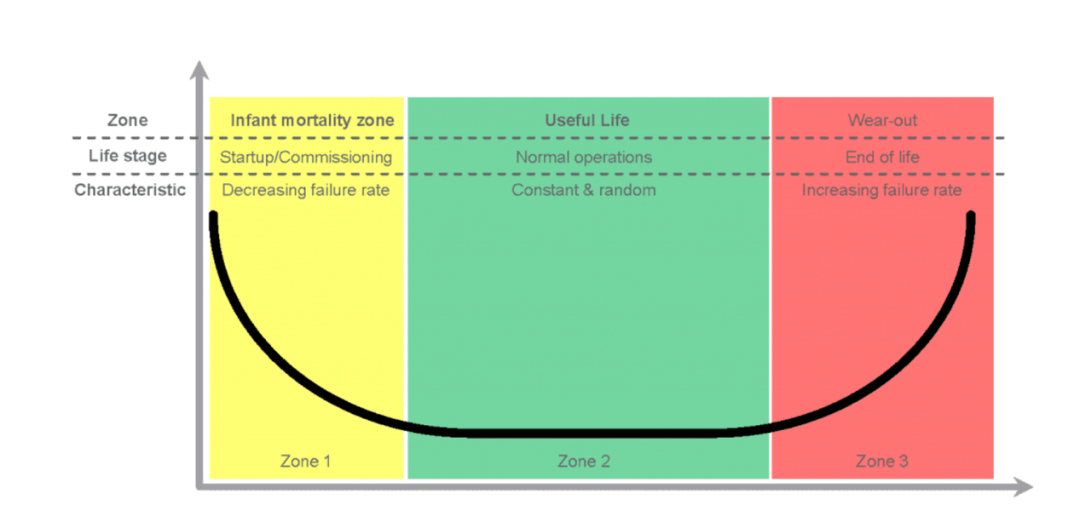
Figure 1. Typical bathtub curve representing the relationship between failure rate and time
Therefore, the goal of any semiconductor company is to reduce the frequency and severity of random hardware failures, thereby extending the lifespan of chips.
To understand the significance of achieving this goal, the concept of safety must be extended to a broader concept of reliability, defined as “the ability to provide a service that can be reasonably trusted.” In this series of articles, the taxonomy of reliable systems is described as a tree (Figure 2).
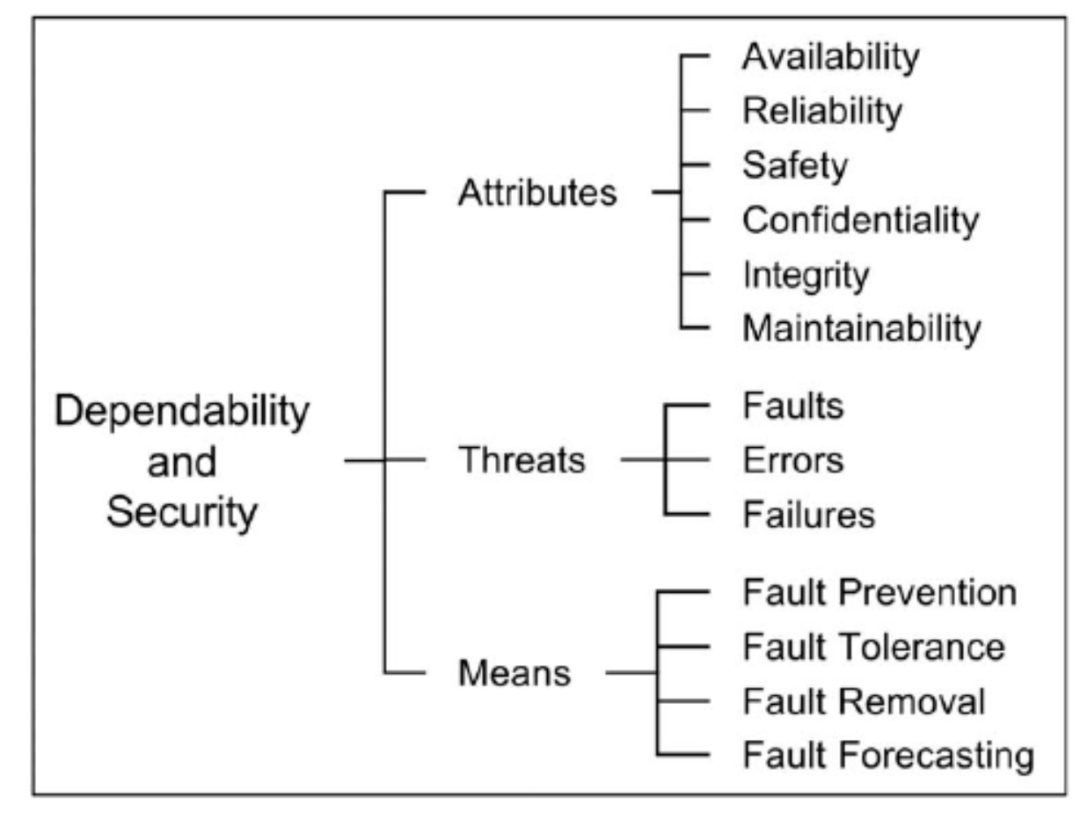
Figure 2. Reliability and safety tree diagram
As shown in Figure 2, safety is one of the attributes of reliability, and there are four means to ensure reliability, each defining different complementary techniques.
Among them, this series focuses on fault tolerance, which establishes procedures that allow the system to continue providing the required service in the presence of faults, possibly at the cost of service degradation. Therefore, fault-tolerant systems are equipped with Safety Mechanisms (SMs), which are required to achieve optimal robustness against faults. Safety mechanisms can reduce the occurrence of random failures, control their consequences, and achieve established safety goals.
Careful analysis should be conducted to determine which safety mechanisms are best suited for the design, considering their pros and cons in terms of effectiveness and cost. The optimal setting of safety mechanisms is to optimize the trade-off between these two factors while complying with safety requirements and standards.
Regardless of the safety mechanisms inserted, ISO 26262 stipulates that a verification phase must be conducted before production. Verification of these mechanisms includes validating their effectiveness, reliability, and compliance with safety standards and requirements.
The most common verification methods rely on analytical techniques, prototyping, compliance testing, and fault injection. And it is the latter that is the subject of this article.
The basic concept behind fault injection is straightforward; it involves intentionally introducing faults into the chip or its model to simulate fault scenarios and assess the response of safety mechanisms. Regardless of the metrics considered, fault models, or the behavioral domain of the components, fault simulators are essential for performing assessments. Today, there are many different commercial fault simulators available on the market. Among them, Cadence®’s Xcelium Fault Simulator (XFS) runs within the XceliumTM simulation engine, which is the standard simulator used by BST for simulation and verification processes. This means that very little work is required to perform fault simulation activities on the Design Under Test (DUT), making it a very attractive solution for BST.
However, these Electronic Design Automation (EDA) tools often require expensive licenses, and for companies with many employees, a large number of licenses are needed. Therefore, the high costs may lead companies to abandon their use and seek alternative solutions.
The ultimate goal of this series of articles is to explore all the fundamental concepts of fault injection and investigate the potential benefits of internal fault injection and analysis tools during the development of safety-critical components at BST. The solution is analyzed from multiple perspectives, including performance, flexibility, result accuracy, and integration with the underlying verification environment.
BST extensively uses the Specman e hardware verification language in its verification environment, so the tool is also developed in e to ensure full compatibility and is named “Fault Injection and Verification Component (FIeVC).”
There are several algorithms for executing fault simulation, but they all require a fault list and a description of the design and input stimuli. In addition, FIeVC uses parallel algorithms, which also require a modified test platform with two DUTs instead of one. In fact, the algorithm includes simultaneously simulating a fault-free machine and a faulty machine, checking for mismatches in their outputs. To simplify and automate the process of generating fault lists and replicating the DUT, the preliminary part of this paper’s work primarily aims to develop two scripts:
・A TCL script for generating a circuit fault list. This script allows users to customize the fault list and recursively perform injections across the entire DUT or only specific subcomponents.
・A Python script to adapt the test platform for fault injection. By precisely parsing the test platform files and DUT files, this script replicates the DUT for parallel fault simulation, generates new test platform signals for mismatch detection, and connects them to FIeVC via a Transaction Level Modeling (TLM) interface.
Both scripts extensively use regular expressions (REs) and leverage BST’s naming conventions to enhance their flexibility and adaptability to different components at various hierarchy levels.
Regarding the core of this series, the focus is undoubtedly on the development of FIeVC. FIeVC consists of four main components:
・A monitor that continuously observes mismatch signals to detect potential differences between the golden output and the faulty output.
・A sequencer that generates the next faults to be injected.
・A BFM that acts as a driver and forces faults into the DUT.
・An analyzer that receives results from the monitor, classifies the faults, and extracts report files.
One of the key features of FIeVC is that it operates in a completely transparent manner relative to the pre-existing verification environment and can be easily connected or disconnected by defining or not defining environment variables.
Finally, the last part of the paper aims to conduct fault simulation activities in XFS to compare and validate the results obtained from FIeVC. This simulation is performed by injecting the same faults into the design for a one-to-one comparison and checking for potential differences.
The accelerometer data path of the MEMS IMU platform SMI240 developed by BST for the automotive market is used as the DUT to evaluate the performance of FIeVC.
Tests conducted using 1,000 fault samples for fault simulation indicate that FIeVC can achieve results very similar to those of XFS while accelerating the simulation process threefold.
Finally, by using a Makefile that hides process complexity, the user experience is greatly simplified. Specifically, an existing Makefile has been extended with three new make targets, allowing simple commands to initiate the setup phase, simulation phase (using either FIeVC or XFS), and comparison phase.
01. Background
1.1 Fault Lifecycle
In addition to reliability means, the reliability tree also defines reliability threats: faults, errors, and failures. These threats are closely related to each other.
Faults are defined as defects present within the system. If a fault is triggered by the correct stimulus, it begins to propagate its harmful effects throughout the circuit, becoming an error. If the error propagates deep into the circuit and reaches the functional output, it becomes a failure. Therefore, a failure (also known as abnormal behavior) is the situation where the output behavior is observed to deviate from the circuit specification at some point. Thus, a failure is the manifestation of a fault to the user.
Therefore, the lifecycle of a fault is divided into three stages:
・Dormant Stage.In this stage, the fault exists in the system but has not propagated due to a lack of stimulus. This fault is referred to as a dormant or passive fault.
・Activation Stage.In this stage, the fault is activated and evolves into an error.
・Propagation Stage.In this stage, the fault propagates to the circuit output, evolving into a failure and causing abnormal behavior.
At the system level, abnormal behavior is the cause of hazards, leading to harmful situations (Figure 1.1).
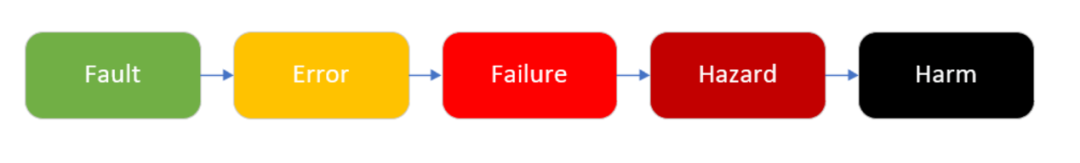
Figure 1.1. Fault evolution within the system
When conducting fault simulation, the goal is to excite (fault → error) and observe (error → failure) as many faults as possible to check which faults may be hazardous.
1.2 Fault Models
There are several physical sources that can lead to hardware failures. Some examples of actual defects in chips include:
・Manufacturing defects, such as missing contacts, misaligned masks, or the presence of dust or impurities during manufacturing.
・Material defects, such as imperfect silicon crystal structures, doping errors, and cracks.
・Time-dependent defects caused by aging, dielectric breakdown, and electromigration.
However, simulating such faults in the early stages of the design process would be quite challenging. In fact, injecting physical errors into circuits at the Register Transfer Level (RTL) or gate level abstractions is nearly impossible.
Nevertheless, physical faults can be clustered into fault models, allowing fault simulation to be performed on these abstract descriptions.
Fault models are logical representations of physical faults based on their impact on the circuit.
Such faults can be injected because there is an exact correspondence between their effects on the physical chip and their logical descriptions. If two different physical faults share common attributes and exhibit similar output behavior, they can be modeled using the same fault model, significantly reducing the variety of faults and thus lowering the complexity of the fault simulation process.
Some of the most popular fault models include:
Stuck-at Fault (SAF) model, specifically SA0 and SA1
・Bridging Fault Model
・Transistor Fault Model, specifically stuck-open and stuck-short
・Delay Fault Model
・Cell-Aware Test (CAT) Fault Model
・Transient Fault Model, specifically Single Event Upset (SEU) and Single Event Transient (SET)
1.2.1 Stuck-at Fault
The SAF model is one of the most common fault models because it covers the vast majority of physical defects and manufacturing errors that occur in integrated circuits (ICs). These faults are characterized by a specific electrical behavior where a signal line is fixed at a certain logic value (high or low), regardless of input conditions. When a stuck-at fault occurs on a network line, the data being transmitted on that line is forced to a logic 0 (SA0) or logic 1 (SA1) value.
In a circuit with n nodes, the following can be modeled:
・2n single stuck-at faults.
・3ⁿ-1 multiple stuck-at faults.
In complex designs, the number of multiple stuck-at faults can make analysis extremely complex and time-consuming, but fortunately, the behavior of multiple stuck-at faults can be inferred from single stuck-at fault tests. This makes it possible to limit the analysis to single stuck-at faults.
The most commonly used technique to test SAF is called “path sensitization.” Without delving into the theoretical and mathematical principles of this technique, it suffices to know that it is based on two consecutive concepts:
・Fault Excitation:It is necessary to create a difference between the normal circuit and the faulty circuit at the fault point (i.e., driving logic 1 on an SA0 network and vice versa).
・Fault Observation:It is necessary for this difference to propagate to the output.
Figures 1.2 and 1.3 clearly illustrate the meaning of excitation and propagation. Upstream gates need to have inputs capable of generating value differences between the normal circuit and the faulty circuit to achieve excitation. On the other hand, downstream gates should not interfere with the value of the fault node during propagation, allowing the output value to reflect only the value at the fault node.
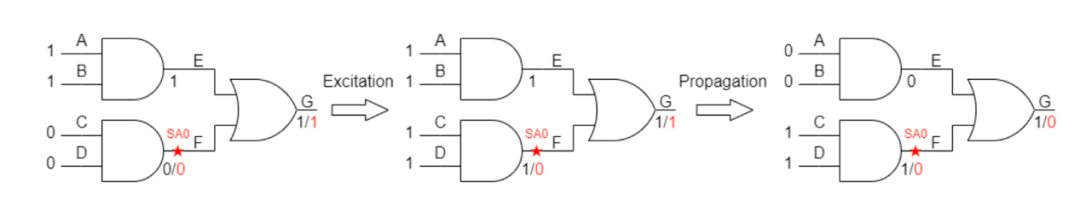
Figure 1.2. Example of SA0
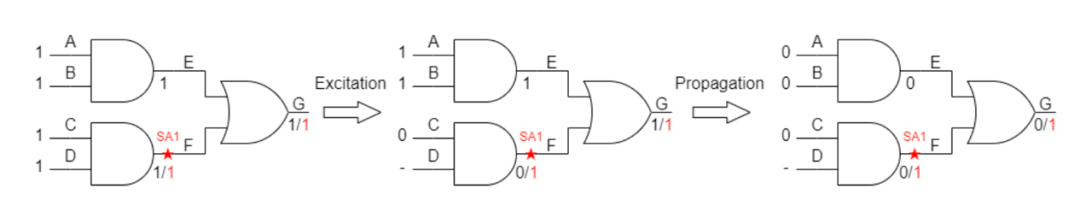
Figure 1.3. Example of SA1
1.3 Functional Safety in ISO 26262
To measure the ability of hardware components to achieve their Safety Goals (SG), ISO 26262 stipulates that various metrics must be used for qualitative and quantitative verification. Based on the scores of these metrics, hardware components are assigned an Automotive Safety Integrity Level (ASIL).
1.3.1 Failure Mode Classification
Before delving into the safety metrics defined in ISO 26262, it is essential to understand how failure modes (and thus faults) are classified. In fact, failure modes are “the ways in which a project fails to provide the expected behavior,” i.e., the manifestations of faults.
Therefore, based on the impact of faults on the circuit, they can be classified into four categories (Figure 1.4):
・Safe Failures:Do not increase the probability of violating safety goals, as they neither propagate to functional outputs nor to safety outputs.
・Single Point Failures:Propagate to functional outputs but are not covered by any safety mechanisms, directly leading to a violation of safety goals.
・Residual Failures:Propagate to functional outputs and are covered by safety mechanisms, but the safety mechanisms cannot prevent a violation of safety goals.
・Multiple Point Failures:Propagate to functional outputs and are covered by safety mechanisms, which can detect and correct them. They can only lead to a violation of safety goals if another fault exists in the safety mechanism itself. They can be further subdivided into:
– Detected: Even in the presence of multiple faults, the safety mechanism can detect and correct them.
– Perceptible: In the presence of multiple faults, they do not lead to a violation of safety goals but may affect the driving experience in some way.
– Potential: They are corrected by the safety mechanism but are not detected.
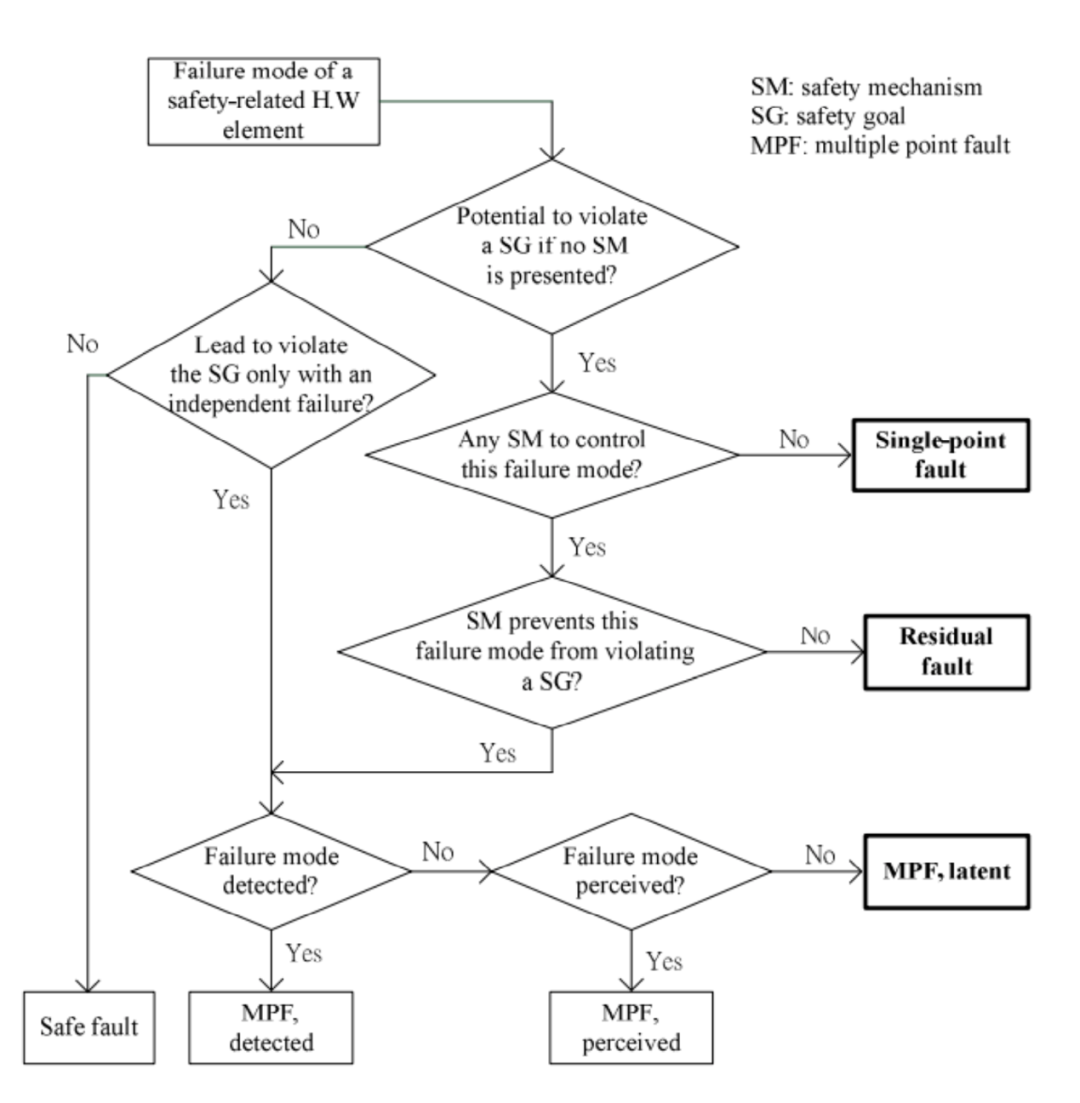
Figure 1.4. Flowchart of Failure Mode Classification
1.3.2 Safety Metrics
After classifying failure modes, three key metrics are used to assess the effectiveness of the safety architecture:
・Single Point Fault Metric (SPFM):This is a hardware architecture metric that reflects the robustness of the safety design in handling single point faults and residual faults. It reveals whether the safety mechanisms present in the component are sufficient to mitigate the risks of single point faults and residual faults in the hardware architecture.
・Latent Fault Metric (LFM):This is a hardware architecture metric that reflects the robustness of the safety design in handling latent faults. It reveals whether the safety mechanisms present in the component are sufficient to mitigate the risks of latent faults in the hardware architecture.
・Probabilistic Hardware Failure Metric (PMHF):This is the sum of the single point fault, residual fault, and multiple point fault metrics. Its unit of measure is failures in time (FIT) (1 FIT = 1 failure occurring every 10⁹ hours).
All these metrics strongly depend on the diagnostic coverage (DC) of each safety mechanism implemented in the system. In fact, DC is the ratio of the number of detected/controlled failures to the total number of failures, used to measure the effectiveness of safety mechanisms.
1.3.3 Automotive Safety Integrity Level (ASIL)
ASIL has two aspects.
When ASIL is related to operational scenarios, it represents a risk classification scheme, ranging from A (lowest requirements) to D (highest requirements); the higher the ASIL level, the greater the risk of injury. The ASIL classification of a scenario is determined through a risk assessment that considers three parameters: the severity of the hazard event, exposure, and controllability. These three parameters are classified on a scale of 1 to 4, and their product determines the ASIL (Figure 1.5).
ASIL = Severity × (Exposure × Controllability)
On the other hand, when ASIL is related to hardware components, it proves that the component meets qualitative and quantitative expectations regarding safety goals at that ASIL level. This means that an ASIL C component is suitable for ASIL A, B, and C applications (but not for D).
To obtain a specific ASIL classification, a component must meet the precise requirements of each of the metrics mentioned above (Figure 1.6).
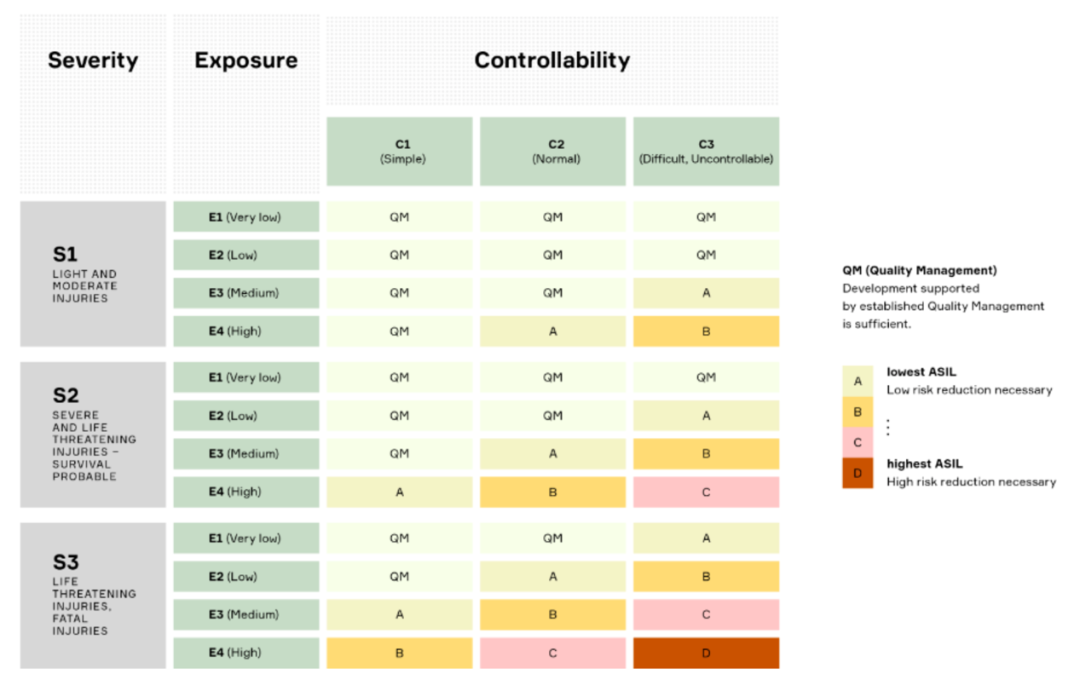
Figure 1.5. ASIL Classification Table
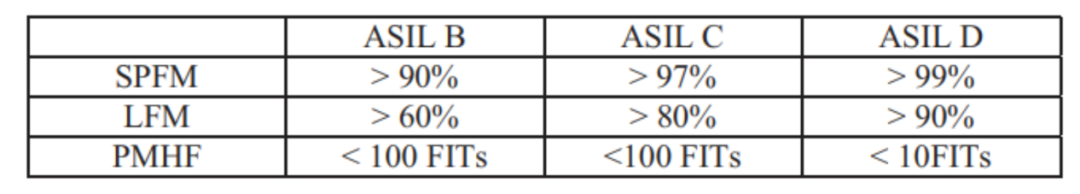
Figure 1.6. Target Values for Obtaining a Specific ASIL Classification
1.4 Overview of Safety Mechanisms (SMs)
For safety-critical systems, the role of safety engineers is to design functional safety architectures that include safety mechanisms to meet the required metrics (SPFM, LFM, PMHF). These safety mechanisms are additional hardware components capable of detecting or correcting errors and are completely independent of the functions they protect to achieve optimal robustness against failures. Typically, Failure Mode Effects and Diagnostic Analysis (FMEDA) drives design exploration to determine where design efforts should be focused to meet constraints.
Choosing the best safety mechanisms for specific building blocks or systems requires careful analysis of the trade-offs between the effectiveness of safety metrics and cost; effectiveness is represented by DC, while cost is represented by power consumption, area overhead, performance impact, and even verification time and automation level. Generally, the higher the effectiveness, the cost increases proportionally, but to optimize this trade-off, the benefits and costs of safety mechanisms should be analyzed from all perspectives.
To this end, safety mechanisms can be classified into four categories based on their operating principles:
・Information Redundancy:In this case, additional data is added to protect the original information. Examples of this type include parity bits and Error Correction Codes (ECC).
・Time Redundancy:In this case, the same operation is performed multiple times on the same functional unit but at different times. An example of this type is execute-retry-checkpoint-recovery techniques.
・Space Redundancy:In this case, the same operation is executed simultaneously on multiple functional units. Examples of this type include Dual-Core Lockstep (DCLS) and Triple Modular Redundancy (TMR).
・Diagnostics:In this case, safety mechanisms directly verify whether the expected functionality is working correctly. An example of this type is Logic Built-In Self-Test (LBIST) techniques.
Although the hardware architecture metrics discussed in Section 1.3.2 do not include timing constraints, it is evident that a comprehensive assessment of safety mechanisms requires consideration of timing performance. Therefore, several timing quantities are specified for the system and safety mechanisms to check whether the safety mechanisms are functioning correctly:
・Fault Detection Time Interval (FDTI):This is an attribute of the safety mechanism itself, defined as the time from the occurrence of a fault to its detection.
・Fault Reaction Time Interval (FRTI):This is also an attribute of the safety mechanism, defined as the time from fault detection to recovery and return to a safe state.
・Fault Handling Time Interval (FHTI):This is the sum of FDTI and FRTI.
・Fault Tolerance Time Interval (FTTI):This is a property and requirement of the system, defined as the time within which the system should be able to detect the presence of a fault and transition to a safe state. Failure to meet this timing requirement may lead to a fault escalating to a hazard and affecting the correct behavior of the system.
To comply with regulations, each safety mechanism present in the system must satisfy the property FHTI ≤ FTTI.
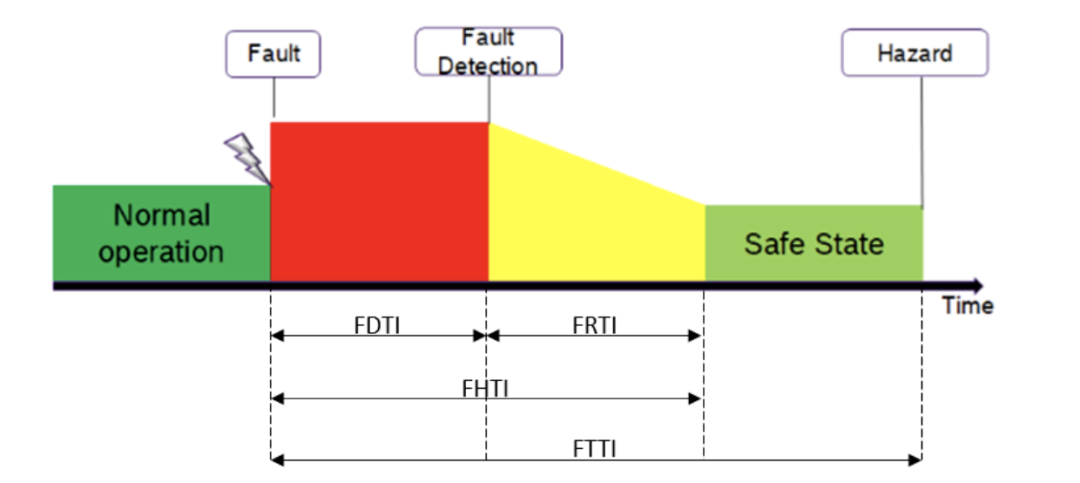
Figure 1.7. Timing Quantities of SMs
1.5 Micro-Electro-Mechanical Systems (MEMS)
MEMS is a technology used to create tiny integrated devices or systems that combine mechanical and electrical components. MEMS manufacturing uses semiconductor fabrication processes, such as deposition, doping, or photolithography, meaning that mechanical parts and the electronic devices that control them can be built on the same silicon chip. The sizes of these devices can range from a few micrometers to several millimeters (Figure 1.8), and they are capable of sensing, controlling, and driving at a microscopic scale while producing effects at a macroscopic scale. MEMS sensor elements and dedicated integrated circuit (ASIC) evaluation circuits are packaged within semiconductor enclosures (such as Land Grid Arrays (LGA)) to form MEMS sensor modules, isolated from the external environment through molding (Figure 1.9).
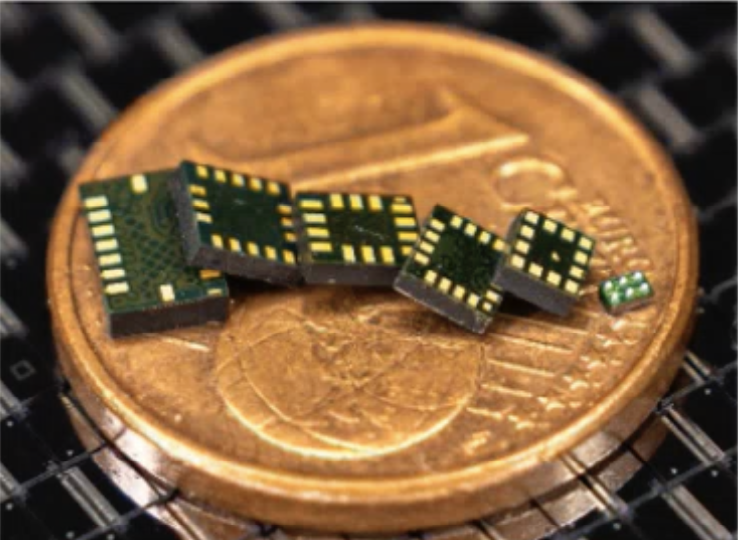
Figure 1.8. Size comparison of MEMS sensors with a 1 Euro coin
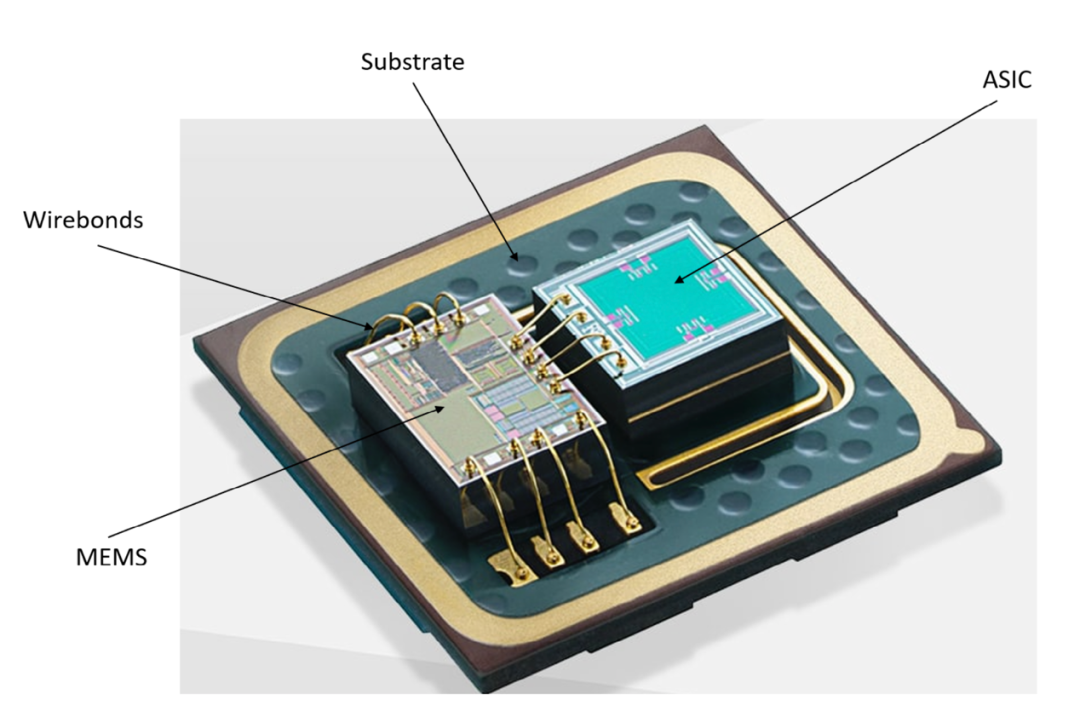
Figure 1.9. Internal structure of a MEMS sensor module
Today, mass-produced MEMS devices can be found in various applications across multiple markets, including automotive and consumer electronics. For instance, modern vehicles rely heavily on MEMS Inertial Measurement Units (IMUs). These systems are crucial for motion and impact detection as well as position and orientation recognition.
1.5.1 Accelerometers
MEMS accelerometers consist of a signal processing chip (ASIC) and a micro-mechanical comb-like silicon structure (MEMS sensor); one of the comb structures is fixed, while the other can move and operates based on the mass on a spring principle (Figure 1.10).
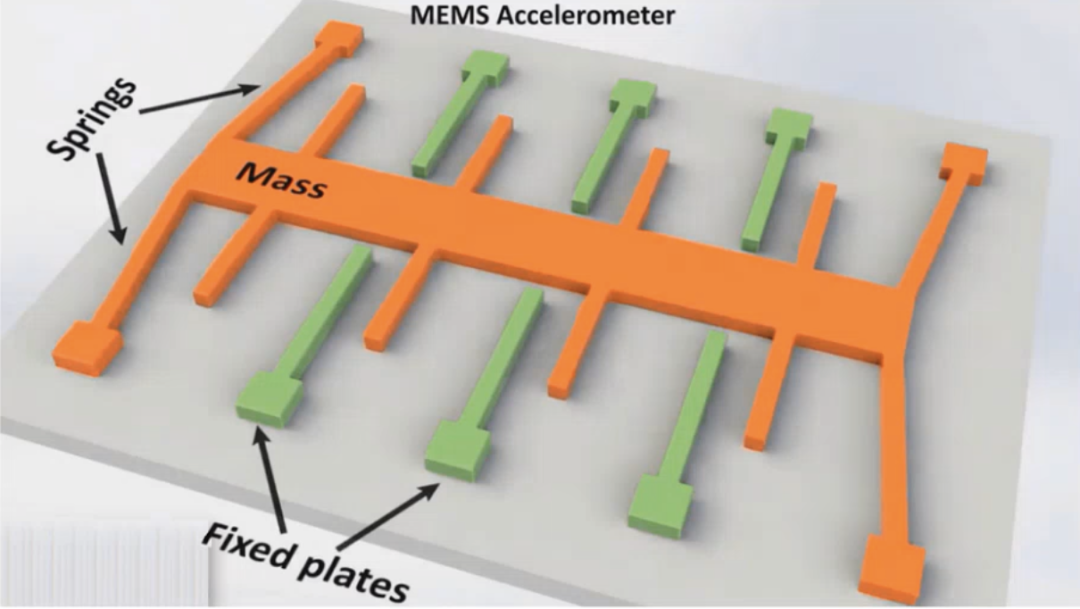
Figure 1.10. Principle of MEMS accelerometer on the x-axis and y-axis
These two structures form what is known as a capacitive transducer. Their fingers form a capacitor, and the distance between the microstructures determines the capacitance. The moving fingers shift relative to the fixed fingers based on acceleration or deceleration. As a result, the distance between them changes, affecting the capacitance. The integrated electronic device detects this change, converts it into a measurement, and outputs it as a voltage signal.
1.5.2 Gyroscope Sensors
MEMS gyroscope sensors measure angular rotation rates and acceleration through vibrating structures, designed to maintain a reference direction or provide stability.
One of the most common gyroscope structures is called a tuning fork, where a pair of test masses is driven to resonance.
The basic physical principle of the gyroscope is that the vibrating mass tends to continue vibrating in the same plane even if its support rotates. This structure is subjected to the Coriolis apparent force, which causes the mass to exert a force on its support; by measuring this force, the rotation rate can be determined (Figure 1.11).
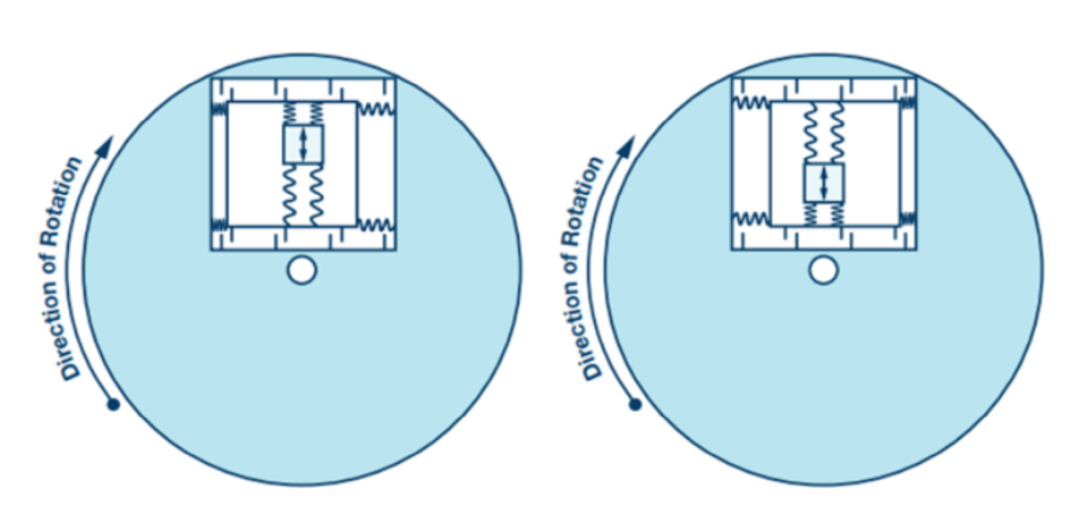
Figure 1.11. Effect of Coriolis force on tuning fork gyroscope
To measure the Coriolis acceleration, the frame containing the resonant mass is tied to the substrate at an angle of 90° relative to the resonant motion. Similar to the accelerometer, a capacitive transducer is then used to sense the displacement of the frame under the force exerted by the mass and outputs a voltage signal (Figure 1.12).

Figure 1.12. Mechanical structure of MEMS gyroscope
1.5.3 Bosch SMI240 Inertial Measurement Unit (IMU)
An IMU is an electronic device used to measure and report the specific force, angular rate, and direction of an object, integrating multi-axis accelerometers and gyroscopes. A typical configuration includes one accelerometer and one gyroscope for each principal axis, totaling three principal axes.
Among the various products in Bosch’s catalog, the SMI240 is a 6-in-1 IMU capable of measuring all six degrees of freedom: pitch (Ωₓ), roll (Ωᵧ), yaw (Ωz) rates, as well as acceleration in the x (aₓ), y (aᵧ), and z (az) directions.
The SMI240 is developed for the automotive market, with safety goals up to ASIL B. Target applications are particularly related to hands-free and autonomous driving.
As a safety-critical component, an onboard safety controller and multiple safety mechanisms (such as parity bits, redundant logic, cyclic redundancy check (CRC), etc.) have been added to achieve the required 90% DC.
A perfect case study to understand how BST achieves safety is the CIC filter used for Delta-Sigma Analog-to-Digital Converters (ADCs) to eliminate quantization errors. Figure 1.13 depicts a second-order CIC (CIC²) filter for consumer electronics applications. The typical elements of this filter can be observed: integrators, decimators, and comb filters, but no additional elements are added when the product is aimed at consumer electronics.
In contrast, Figure 1.14 shows the CIC² filter structure suitable for automotive applications. The basic structure remains unchanged, but combinational logic and sequential logic elements are protected by safety mechanisms:
・Combinational elements (such as adders and subtractors) are doubled to achieve what is known as Dual Modular Redundancy (DMR). Through this technique, each operation is performed by another set of adders/subtractors, which then compare the results obtained with the original set.
・Flip-flops are extended to support parity bits.
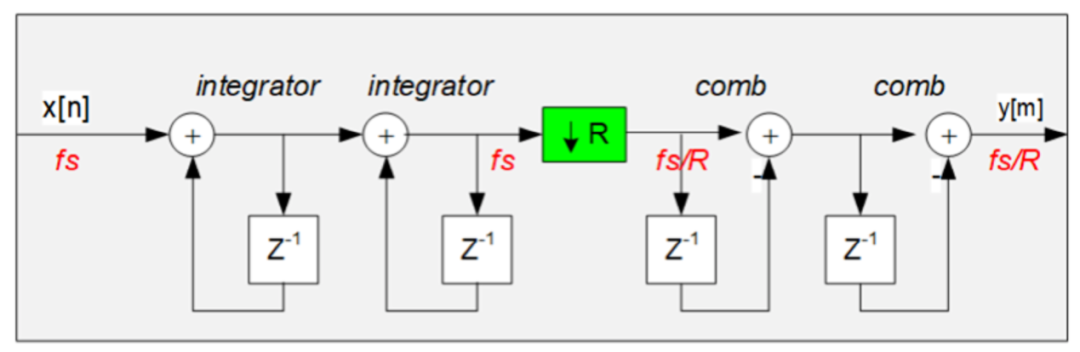
Figure 1.13. Structure of CIC² filter for consumer electronics applications
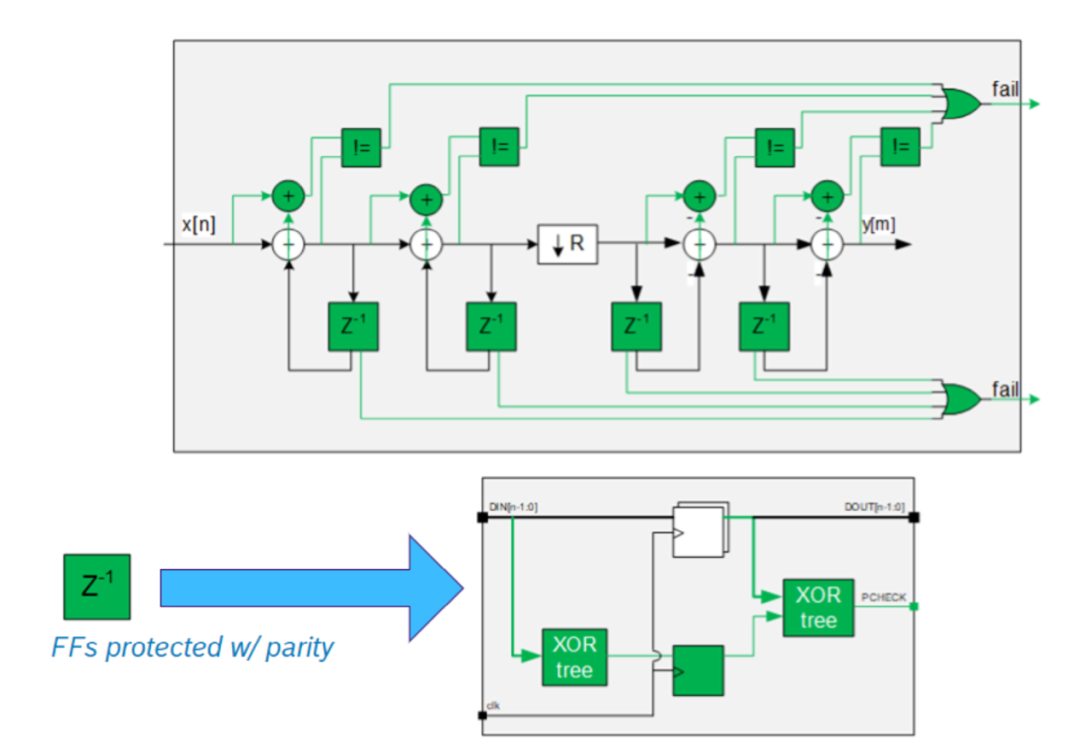
Figure 1.14. Structure of CIC² filter for automotive applications
1.6 Related Work
Fault injection has been used for many years to assess the reliability of electronic systems, and it has become standard in corporate environments when dealing with safety-critical components.
Depending on the technology used, fault injection environments can be divided into:
・Hardware-based environments:Using external physical sources (such as heavy ion radiation or power disturbances) to directly introduce faults into the hardware. Other tools use probes directly connected to DUT pins to inject faults.
・Simulation-based environments:Injecting faults into simulated hardware. Different abstraction levels can be used to model the DUT, from low levels (VHDL, Verilog models) to high levels (C, SystemC models). These environments are much slower than hardware-based environments but offer high controllability, flexibility, and customizability. Additionally, this technique allows the analysis process to begin very early.
・FPGA-based environments:Simulating the target system using Field Programmable Gate Arrays (FPGAs) and injecting faults into them.
Today, one of the most common methods in simulation-based tools is to extend pre-existing verification environments with fault injection capabilities. In handling such environments, most of today’s industry work uses SystemVerilog and the Universal Verification Methodology (UVM), which is the standard.
However, some companies still use Specman e for verification, but there is a significant industry gap if they want to embed the fault simulation process in their environment. In fact, at the time of writing this article, the only known industrial fault simulation tool based on Specman e was designed by the Italian company Yogitech (now part of Intel). In the academic field, research on fault injection using Specman e has been analyzed.
Therefore, the goal of this series of articles is to fill this gap, enabling BST to easily perform fault simulation within the standard verification processes currently used by the company.
In the subsequent “Part 2” of this series, we will detail FIeVC itself and the preparatory phase scripts, explain the steps to execute complete fault simulation activities through XFS for comparison with commercial fault simulation tools, and finally present the results obtained using FIeVC. Please stay tuned for the upcoming release of “Part 2” of this series on the “Yuanli Tribe” public account.
Disclaimer: The views expressed in this article are for sharing and communication purposes only. The copyright and interpretation rights of the article belong to the original authors and publishing units. If there are any copyright issues, please contact [email protected], and we will address them promptly.
Related Articles ●●
|Functional Safety Considerations for Basic Steering Systems
|Michelin and Brembo Collaborate to Change the Way Cars Brake
|US Media: Tesla Cybertruck Issues Continue to Worsen
|Analysis and Technical Implementation of AUTOSAR Methodology
|Safety Architecture for Evaluating Perception Performance of Assisted and Autonomous Driving
|ECU Hardware Design Fundamentals for Functional Safety in Vehicle Network Communication
|ISO 21434 Cybersecurity Engineering Methodology
|Using Fault Injection to Validate AUTOSAR Applications According to ISO 26262
|Achieving Functional Safety ASIL Compliance for Autonomous Driving Software Systems
|Latest Developments: Status of Major Automotive Manufacturing Projects in the US by 2025
|Overall Chiplet Solutions for Autonomous Vehicles (Part 2): Communication Solutions