“PLC Calibration Black Technology: Automatic Calibration Program Launched, Measurement Accuracy Approaches 99.8%!”
Hello everyone!
Is your PLC measurement always “jumping around”? Is the temperature display fluctuating wildly, and pressure data resembling a roller coaster? Today, let’s delve into this headache-inducing issue for engineers—PLC device calibration! (Does this resonate with you?)
Bloody Lessons
“Explosive Error” at a Chemical Plant
Last summer, a chemical plant in Shandong experienced an explosion due to a 0.5% error in temperature sensor readings, resulting in 2 million in equipment losses and a 15-day production halt! The owner’s blood pressure skyrocketed: “This error is more unstable than my blood sugar?!”
“Temperature Control Failure” at a Food Factory
A food factory in Hangzhou had a sterilization temperature drift of 2°C, leading to microbial contamination in an entire batch, resulting in 50 tons of raw materials being thrown in the trash. The factory manager lamented: “This is not production; it’s just giving performance metrics to the environmental protection bureau!”
“Pressure Mysticism” at an Auto Parts Factory
Even worse, an auto parts factory in Guangdong saw its pressure sensors drift by 3% weekly, causing the production line to frequently “strike” with an average monthly loss of 800,000! The technical supervisor joked: “We’re not fixing equipment; we’re predicting the PLC’s fortune!”
Four-Tier Pyramid of Automatic Calibration (Warning: Valuable Content Ahead!)
① Hardware Preparation Layer
👉 Pitfall Guide: Don’t treat grounding wires as decorations! A certain factory had a grounding resistance exceeding standards, turning a 500,000 PLC into a “weather forecaster”—data jumped wildly with increased humidity. (Don’t laugh; your factory might have this issue too!)
② Parameter Configuration Layer
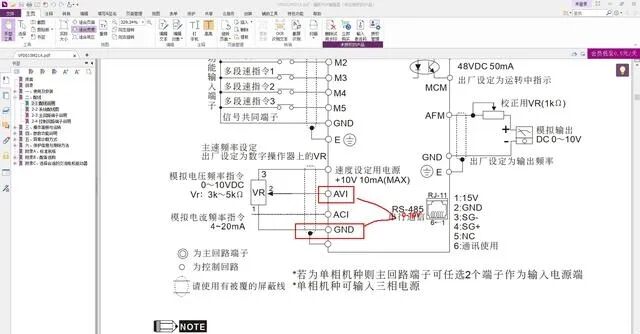
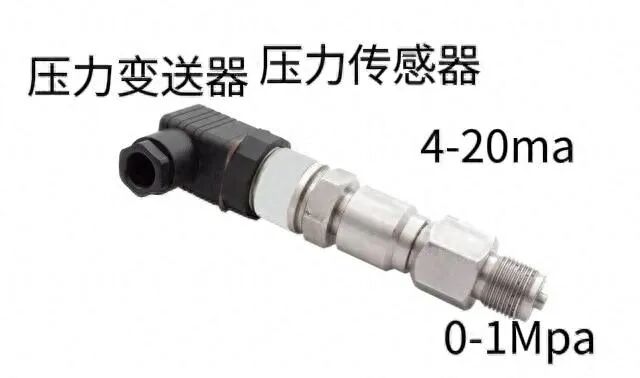
Mastering range conversion: 4-20mA corresponds to 0-10MPa? Remember this formula:
Actual Value = (Original Value – 5530) / (27648 – 5530) * Range
(Don’t panic! You can easily handle this in TIA Portal with just a couple of clicks; a configuration template is provided at the end!)
③ Program Development Layer
Self-developed “Foolproof Trio”:
Automatic Zeroing Program: Automatically calibrates at 3 AM every day (more punctual than an alarm clock)
Dynamic Filtering Algorithm: Filters out noise signals like a bad boyfriend!
Dual Sensor Voting Mechanism: If two sensor data “fight”, take the average!
④ Verification and Optimization Layer
Using an oscilloscope + multimeter combo! A certain factory discovered that 90% of “sensor failures” were actually due to loose wiring! (Don’t ask how I know; the debugging room at 3 AM was filled with tears)
Life-Saving Solutions for Different Scenarios
(Feel free to take the table! If likes exceed 1000, I’ll directly send the Excel template~)
Soul-Searching Three Questions
Does your production line have “Schrödinger’s measurement value”—you never know if it’s accurate until you open the control cabinet?
When was the last calibration? Don’t tell me it was done by “eyeballing”!
If a customer audit tomorrow requires checking three years of calibration records… (Is it too late to run away now?)
Implementation Roadmap
Risk Assessment: First, give the PLC device a “physical examination” (focus on grounding and shielding)
Solution Selection: Budget-conscious factories opt for software calibration, while wealthy ones go for hardcore modules
Pilot Testing: Use the oldest PLC for testing (no tears if it breaks)
Full Promotion: Paint a picture for the boss: “Invest 100,000, save 1 million in downtime costs!”