It’s almost Friday again; the week has gone by so quickly. I’ve wanted to change the cover of my previous article for a long time. The old one was generated in MATLAB with a logo input back in 2020, and it always felt a bit outdated, haha. Today, I’m trying out a new cover for my article.
figure(‘Position’, [100, 100, 1000, 600]); % Similar to figsize=(10,6)
x = linspace(-5, 5, 50);
y = linspace(-5, 5, 50);
[X, Y] = meshgrid(x, y);
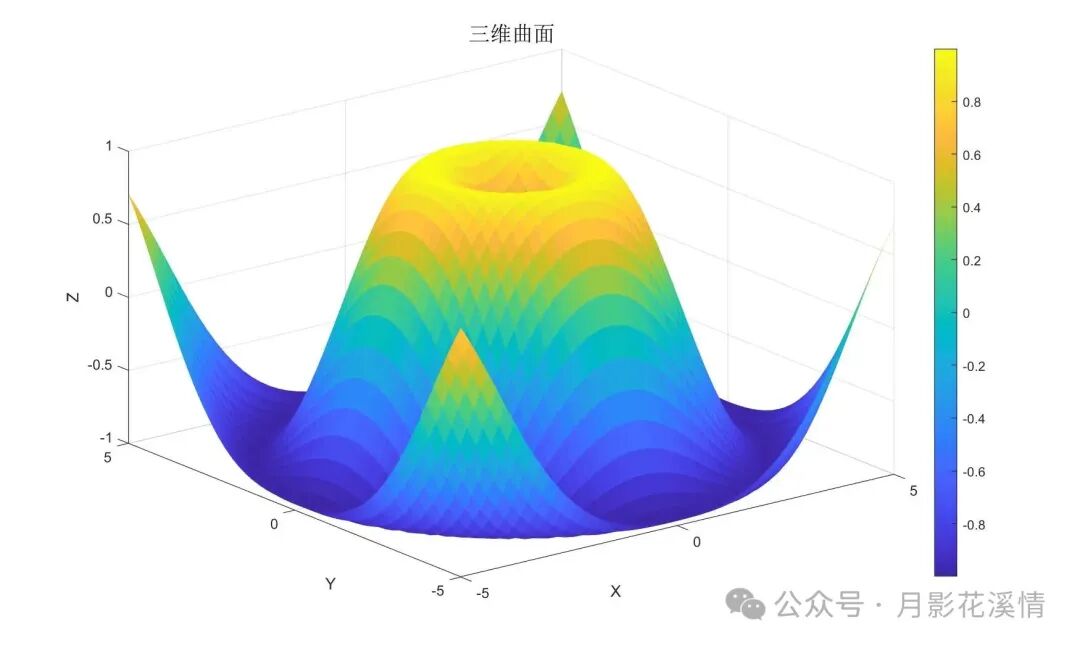
Z = sin(sqrt(X.^2 + Y.^2));
% Create a 3D surface plot
surf(X, Y, Z, ‘EdgeColor’, ‘none’); % Plot the surface, removing edge lines for clarity
colormap parula; % Use parula colormap as an alternative
colorbar; % Display color bar
% Add title
title(‘3D Surface’, ‘FontSize’, 15);
% Adjust view angle and axis labels
xlabel(‘X’);
ylabel(‘Y’);
zlabel(‘Z’);
view(3); % Set 3D view
grid on;
The result is as follows: