Comprehensive Guide to the ESP32 Memory System: A Beginner’s Guide to Avoiding Pitfalls from Crashes to Mastery
When your program crashes for the 10th time, and the serial output shows a red warning of “memory overflow”—Don’t panic! This might be a rite of passage for every ESP32 developer.Today, let’s clear the fog and accurately allocate every byte in the 520KB micro kingdom.
1. Memory Map: The Triad of Storage World
1. On-chip SRAM (High-speed Memory)
- Capacity520KB (approximately 328KB usable)
- SpeedCPU full-speed access (zero wait at 240MHz)
- CharacteristicsData disappears on power loss, equivalent to computer RAM
2. External Flash (Persistent Storage)
- CapacityStarting from 4MB (common development board configuration)
- FunctionStores program code, file system, configuration parameters
- SpeedAccessed via SPI bus (50 times slower than SRAM!)
3. PSRAM (Extended Memory)
- Capacity4MB/8MB (requires development board support)
- PositioningLarge capacity data cache (e.g., image/audio processing)
- NoteAccess speed is 10 times slower than SRAM
2. Internal Anatomy of SRAM: Three Essential Functional Areas for Beginners
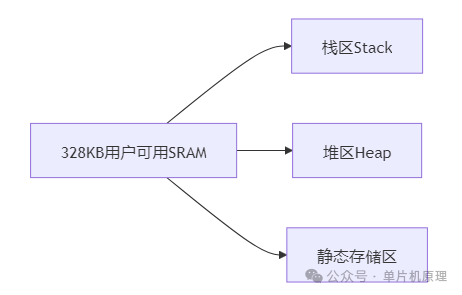
▶ Stack Area
- FunctionStores local variables and function call addresses
- Characteristics
- Limited space (default 1-4KB per task)
- Automatically allocated/released
- Death Trap
void dangerous(){
    int buffer[1024]; // Instantly consumes 4KB of stack space!
} // Multiple calls lead to stack overflow
▶ Heap Area
- FunctionDynamic memory allocation (malloc/calloc)
- Characteristics
- Relatively large space (about 200KB)
- Requires manual management
- Classic Pitfall
char* data = (char*)malloc(1024); // Request memory
// ...forget to free → memory leak!
▶ Static Storage Area
- FunctionStores global and static variables
- Characteristics
- Lifetime = entire program runtime
- Re-initialized on reset
- Example
int globalCounter; // Stored in this area
3. Lifesaving Tips for Beginners: Five Common Memory Issues and Solutions
1. Stack Overflow First Aid Kit
// Method 1: Increase task stack space
xTaskCreate(taskFunc, "SafeTask", 8192, NULL, 1, NULL); // 8KB stack

// Method 2: Use static allocation
static int safeBuffer[1024]; // Move out of stack
2. Heap Memory Leak Detection Technique
// Enable heap detection (for development phase only)
heap_caps_enable_nonos_stack_heaps();
heap_caps_malloc_extmem_enable(64); // Monitor external memory

// Regularly print heap information
heap_caps_print_heap_info(MALLOC_CAP_8BIT);
3. Correct Way to Use PSRAM
// Step 1: Confirm development board supports PSRAM
#if CONFIG_ESP32_SPIRAM_SUPPORT

// Step 2: Prioritize storing large data
uint8_t* imageBuf = heap_caps_malloc(1024 * 1024, MALLOC_CAP_SPIRAM);

// Step 3: Copy to SRAM before processing
uint8_t tempBuf[2048];
memcpy(tempBuf, imageBuf, 2048); // Speed up processing
4. Memory-Saving Tricks
// Trick 1: Use PROGMEM to store constants in Flash
const char bigData[] PROGMEM = "SaveRAM!";

// Trick 2: Compress data structures
#pragma pack(push, 1) // 1-byte alignment
struct SensorData{
    uint16_t temp;
    uint8_t humi;
    bool status;
}; // Originally 4 bytes → now 3 bytes
#pragma pack(pop)
5. Memory Fragmentation Cleanup Technique
// Create a memory pool to avoid fragmentation
#define BUF_SIZE 50
static uint8_t memoryPool[BUF_SIZE][1024]; // Pre-allocate 50 blocks of 1KB

void* safeMalloc(size_t size){
    for(int i=0; i<BUF_SIZE; i++){
        if(memoryPool[i][0]==0){ // Use marker
            memoryPool[i][0]=1;
            return &memoryPool[i][1];
        }
    }
    return NULL; // Allocation failed
}
4. Real-World Pitfalls: Three Painful Case Studies
Case 1: Wi-Fi Connection Causes Crash
Reason: Wi-Fi driver requires 80KB+ memory, small memory development boards are prone to overflowSolution:
- Select a development board with PSRAM
- Release non-critical resources before connecting
Case 2: LVGL Interface Freezes
Reason: Graphics library consumes memory, PSRAM support not enabledFix Code:
lv_disp_draw_buf_init(&draw_buf,
    heap_caps_malloc(BUF_SIZE, MALLOC_CAP_SPIRAM), // PSRAM video memory
    NULL,
    BUF_SIZE);
Case 3: OTA Upgrade Fails
Reason: Flash partition table configuration errorCorrect Partition Scheme:
# partitions.csv
factory,  app, 0x10000,  1M
ota_0,    app, 0x110000, 1M
ota_1,    app, 0x210000, 1M
spiffs,   data, 0x310000, 1M
5. Visualization Debugging Tools
1. Memory Monitor (Arduino IDE)
https://example.com/mem_monitor.pngReal-time display of stack/heap usage, automatic overflow alerts
2. Heap Trace Toolchain
# Enable detailed heap logging
idf.py menuconfig → Component config → Heap Memory Debugging → Enable heap tracing

# Run trace
heap_trace_start(HEAP_TRACE_ALL);
// ...run suspicious code
heap_trace_stop();
heap_trace_dump(); // Print leak points
Conclusion: The Art of Programming with Limited Memory
When you are using a 29 yuan ESP32 to drive a smart coffee machine:“328KB memory running machine learning? This is like painting the “Along the River During the Qingming Festival” on a postage stamp.”
Beginner’s Guide:
- When starting a new project:
Serial.printf("Free Heap: %d\n", esp_get_free_heap_size());- When memory is running low:
- Prioritize using PROGMEM
- Be cautious with the String class
Ultimate solution:Switch to ESP32-S3 (with 512KB SRAM + 45 DMA channels)
Mastering Microcontrollers in Three Days
ESP32 IoT Guide Compass