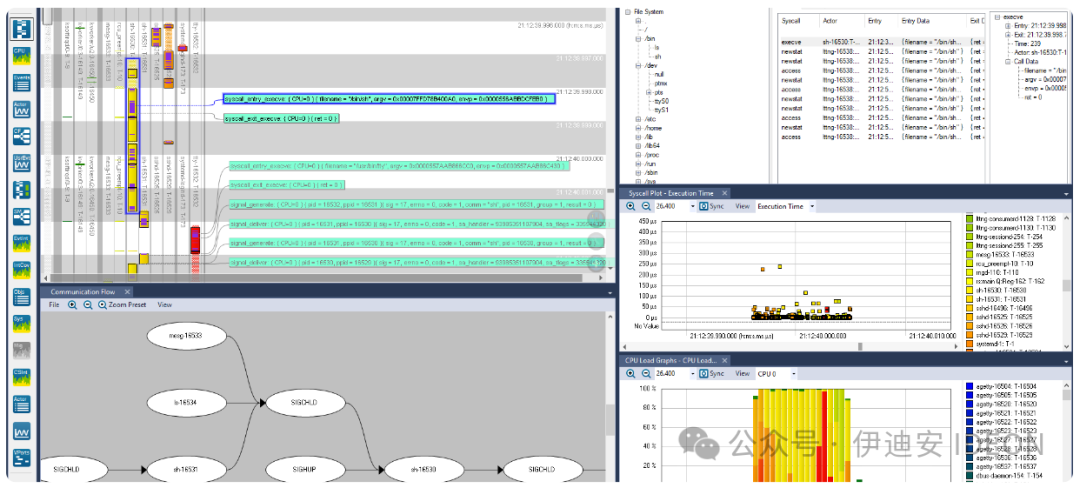
Software tracing tools are essential components in every embedded developer’s toolbox, especially when combined with advanced visualization. Most embedded systems exhibit numerous periodic repeating patterns, where the same sequences are continuously repeated. During debugging, you often want to quickly identify anomalies, that is, deviations from normal periodic behavior.However, software tracing itself is merely a form of data collection. Searching for issues within large volumes of text or numerical log data is like finding a needle in a haystack, but with appropriate visualization, the search transforms into a visual pattern recognition problem, which is something the human brain excels at. Interactive charts display execution times, response times, task switching, and messaging between tasks—all of which allow developers to quickly identify anomalies in firmware execution and dig deeper.Tools for visual tracing diagnostics have existed for at least a decade and have proven to be very useful for development and debugging in the lab. As more embedded software developers add secure “Internet of Things” (IoT) cloud connectivity, it is natural to consider using tracing capabilities in field-deployed devices to capture real issues that may be missed during testing. After all, software-based tracing does not require any additional hardware, and connected IoT devices can clearly upload diagnostic tracing data just like they upload regular application data. In this way, developers can quickly gain insights into any remaining software issues that cause problems during actual operation and obtain detailed diagnostics to understand the reasons.In this context, software tracing is akin to a virtual “black box recorder,” similar to the recorders used in commercial aircraft during accidents.It is an integral part of the product, always recording and providing critical information when issues arise. However, unlike a real black box, it is a software solution designed to address software issues.One solution for IoT device monitoring is DevAlert (Figure 1), which consists of three parts: a firmware monitor, a small library that you can add to the firmware to enable alert tracking and uploading; the Tracealyzer tool for visualizing tracing diagnostics; and a cloud service responsible for classifying and storing alerts, notifying developers, filtering duplicate alerts, and more.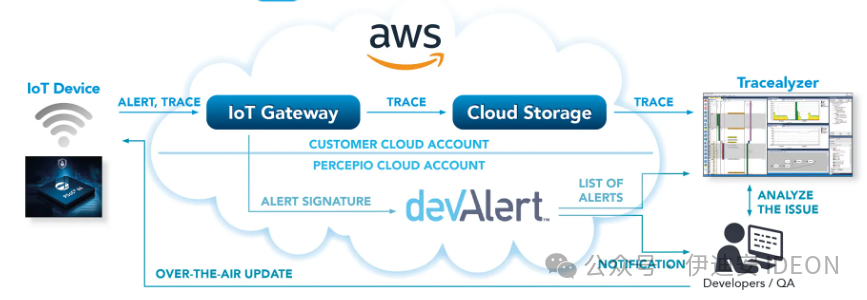 Figure 1. DevAlert provides IoT developers with immediate feedback on errors in their cloud-connected devices, enabling rapid continuous improvement of device software.The initial version runs on AWS and is suitable for RTOS applications using AWS IoT Core, but the solution can be adapted to other cloud platforms.Software Tracing and Cloud ConnectivityTracing in development labs and tracing in deployed devices are two different matters. If you are currently using visual tracing diagnostics in the lab and wish to extend it to the field, there are several considerations to keep in mind.Compared to direct physical connections like USB or Ethernet, the bandwidth provided by cloud connectivity is limited, and the response time is longer. Uploading 5 KB of data via a wireless interface may take tens or hundreds of milliseconds. However, in this approach, tracing is not continuously transmitted; it is only transmitted when an alert is generated, and only a small portion of the most recent events is sent. Alerts are only for unusual but significant occurrences, such as when an error is detected in the application code, like a failed integrity check, a hard fault, or a watchdog reset.Any internet-connected device requires security. Therefore, it is crucial not to introduce any new attack vectors. DevAlert addresses this issue by relying on existing cloud connectivity rather than introducing new connections. This leverages the security of AWS and other leading IoT/cloud providers, which offer verified SDKs for cloud connectivity that are protected according to best practices, such as using X.509 certificates for device authentication and TLS for encrypted communication. This way, the data uploaded by DevAlert is as secure as regular IoT application data, and to enhance security, it only requires one-way communication: it never listens for incoming messages.In this approach, alerts are uploaded to the same cloud account that the device typically uses and have the same security level. Once in the cloud, a small portion of the data is provided to the cloud service. This does not include the actual tracing data, which may be considered sensitive information and is therefore retained in the device’s cloud account. Figures 2a and 2b illustrate the data flow and security barriers in more detail.
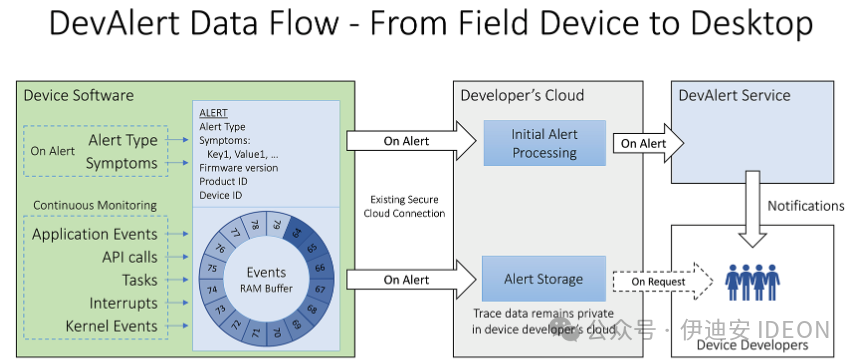 Figure 2a. The data flow starts from the device software, where developers add alerts in the source code.Each alert uploaded to the device’s cloud account contains a brief trace with the latest events prior to the alert.Finally, the metadata signature is forwarded to the DevAlert cloud service.
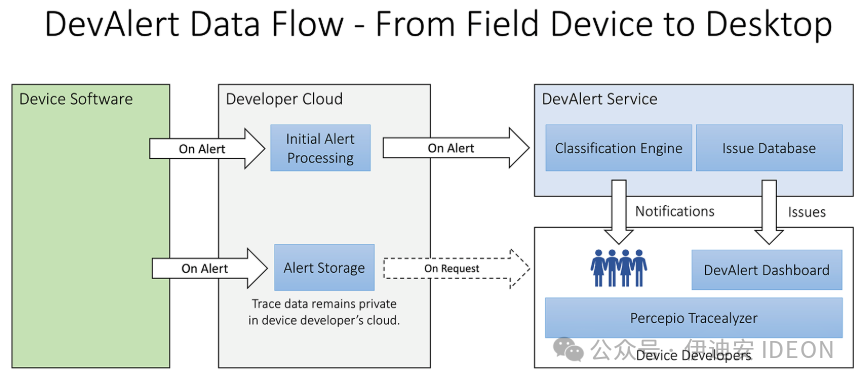 Figure 2b. The cloud service compares incoming alerts with previous alerts from the entire fleet of devices and notifies developers of any new issues. Duplicate alerts are counted and stored but not sent as notifications. This way, if the same alert is triggered across multiple devices, the developer’s inbox will not be flooded.
The operational costs of receiving alerts in the cloud account are generally low, although this naturally depends on the quantity. First, alerts are not sent unless an issue is detected. Generally, cloud providers charge very little for sending and storing occasional alert messages. Most IoT applications generate more data, which is reflected in the pricing of IoT/cloud services. For example, sending 1 million MQTT messages to AWS IoT Core costs $1.Most alert processing is done in the cloud service, which is a fully managed service. Only the initial processing occurs in the device developer’s cloud account, which can reduce cloud costs and simplify integration.Sending wireless updates to fix reported errors may cost more, as you need to transmit more data to all devices. AWS provides a pricing example where updating 600,000 devices costs $1,275. However, compared to the cost of leaving errors unfixed—deteriorated customer experience, lower product review ratings, decreased sales, and even accidents and legal actions—it is not expensive.DevOps for Embedded DevelopmentHaving your IoT devices “call home” when software issues arise offers significant benefits. Directly understanding errors and conducting detailed diagnostics creates a feedback loop between developers and deployed code, enabling developers to fix errors faster and roll out updated firmware more quickly—see Figure 3. This so-called DevOps philosophy has long been standard in mobile and cloud application development, and with the introduction of secure cloud-based IoT platforms, embedded development can also proceed in this manner.
 Figure 3. The DevAlert dashboard in Tracealyzer lists recently reported alerts and traces.
From a business perspective, this DevOps-style monitoring means fewer dissatisfied customers, as fewer end users are affected by errors in production code.Despite all the validation work, most embedded software contains some overlooked bugs at release, but they often do not manifest directly to everyone.If you know early on, there is usually time to resolve issues before many customers are affected. Ideally, developers should be notified within seconds of the first alert, and the provided tracing diagnostics allow for quick analysis and correction. Then, developers can send automatic wireless updates to fix the issues. Instant awareness and tracing diagnostics can significantly reduce repair time and minimize the number of affected customers.Improving device reliability can reduce liability risks and lower costs for customer support, returns, and debugging.The diagnostics provided make it easier for developers to reproduce customer issues, as they receive information directly from the device rather than relying on user descriptions of the situation.If there is no automatic feedback, you can only rely on end users to report any issues and provide sufficiently detailed information. Vague error reports like “the system is unresponsive” are not helpful and may take weeks to identify potential causes. Even then, this is just your best guess—you cannot truly know if you have addressed the right issue.Not Just ErrorsOne point to note is that alerts do not necessarily pertain only to missed errors and the resulting bugs. Since developers have the freedom to decide where and why to generate alerts, they can also use alerts to monitor key performance indicators of the application and understand the causes of occasional performance issues.Monitoring the user interface can also reveal interesting information. Suppose you encounter a situation where a user opens a menu on a touchscreen (for example, in a car’s infotainment system) and then hesitates on where to proceed next.To capture such issues, application developers can start a timer after each input event, generating an alert if no input is received within 5 seconds.If many alerts are subsequently received regarding the same part of the user interface, this could be significant feedback that helps your organization build better products.In summary, leveraging software tracing and cloud-based alerts in deployed devices offers substantial advantages and is not complex.However, to fully adopt a DevOps-style workflow, it is necessary to have wireless update capabilities and a responsive development organization that understands the limitations of software testing and the importance of continuous improvement post-release.
Author: Johan Kraft Translation: Anne Proofreading: Mike
Original text:Embedded – Software tracing in field-deployed devices
This article is based on the Creative Commons text sharing agreement:https://creativecommons.org/licenses/by-sa/4.0/