Introduction
Based on the oxidase-like properties of copper oxide nanoparticles (CuO NPs), this study developed a sensor array method that combines three-dimensional fluorescence (3D FL) spectroscopy with deep convolutional neural networks (CNN) for the high-precision and high-sensitivity identification and quantification of carbohydrates in serum and complex environments. The model achieved an accuracy of 99–100% in classifying nine structurally similar carbohydrates, with a coefficient of determination (R²) for concentration prediction reaching 97–100%. It successfully identified carbohydrate mixtures and polysaccharides in serum and lake water samples, with a detection limit for fructose as low as 4.23 nM, representing a significant 120-fold improvement over previous methods. This research demonstrates the powerful application potential of artificial intelligence and nanomaterial technology in biomedical and environmental analysis, providing a new strategy for high-throughput and high-specificity detection of carbohydrates in complex samples.
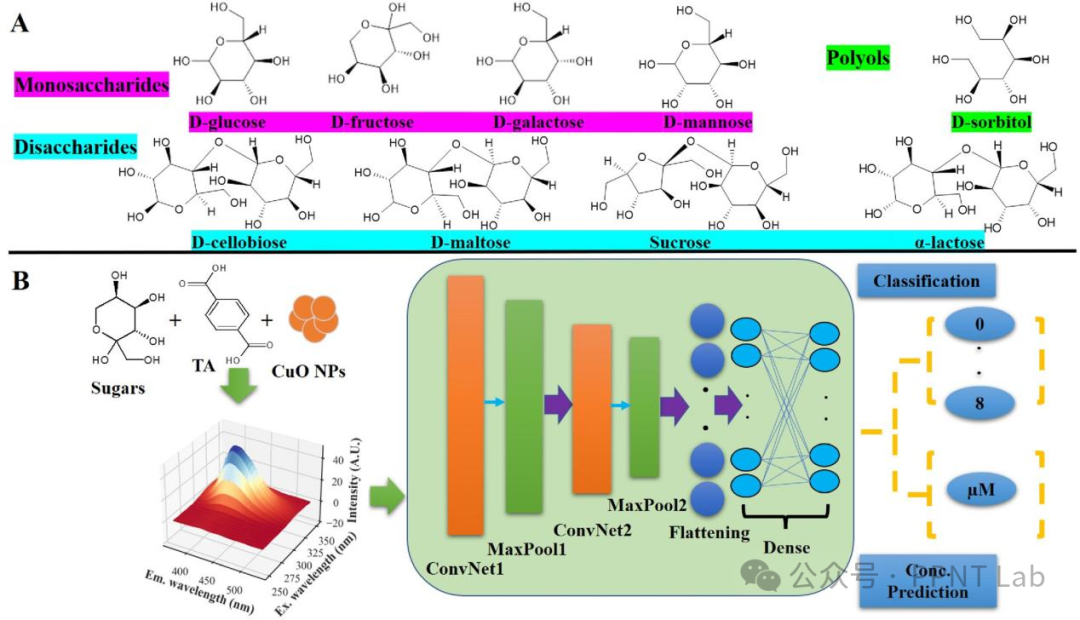
Figure 1 Chemical structures of nine selected sugars (A) and representation of the proposed sensor array method for classifying and predicting target sugar concentrations (B)
Research Content
Figure 2 shows the 3D FL spectra of the TA-phosphate-CuO NPs system before (Figure 2A) and after (Figure 2B-J) the addition of different carbohydrates, reflecting the interaction between the probe and sugars. The importance of fructose in the system is highlighted, while the similarity among other carbohydrates arises from the single functional group (-OH) in their chemical structures and larger stereochemical differences. The 3D FL spectra provide a comprehensive understanding of the interactions between the probe and sugars, revealing the unique characteristics of each sugar. Given the advantages of CNN in handling such tasks, the combination of the designed CNN and 3D FL data is expected to effectively distinguish structurally similar carbohydrates, even in complex environments.
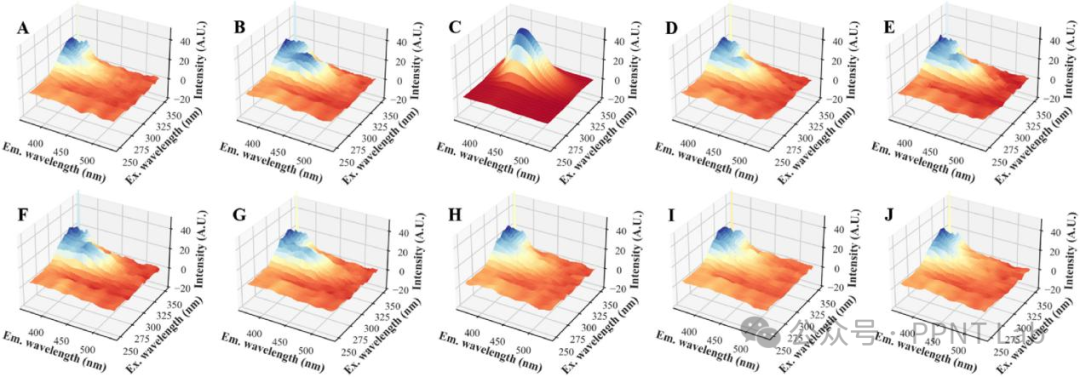
Figure 2 TA-phosphate-CuO NPs system (A) and the 3D FL spectra of the TA-phosphate-CuO NPs system mixed with D-cellobiose (B), D-fructose (C), D-galactose (D), D-glucose (E), D-maltose (F), D-mannose (G), D-sorbitol (H), sucrose (I), and α-lactose (J) at a final concentration of 100 μM
Figure 3 shows the loss and accuracy curves during the training process of the selected model over 977 epochs, with the best results occurring at 977 epochs. The confusion matrix in Figure 4 indicates a 100% accuracy for the training set, with no overlap among the selected sugars. The validation and test sets showed slight overlap only between d-cellobiose and sucrose, and between d-cellobiose and α-lactose, with an accuracy of 99% for each sugar. The ROC curves for the training, validation, and test sets were all 100%. These excellent results may be related to the use of the max pooling layer, which addresses overfitting by reducing feature redundancy, lowering dimensions, and stabilizing outputs, thereby enhancing the computational efficiency and stability of the model.
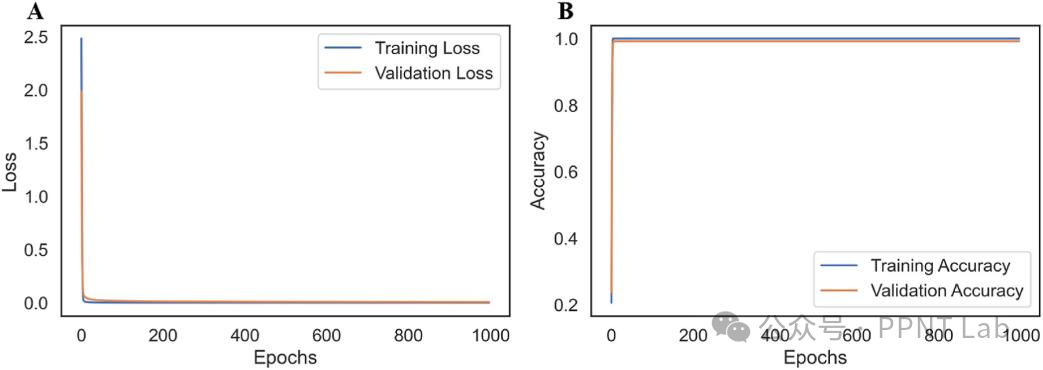
Figure 3 Convergence curves of the CNN-Max model during training and validation over 997 epochs, depicting loss (A) and accuracy (B)
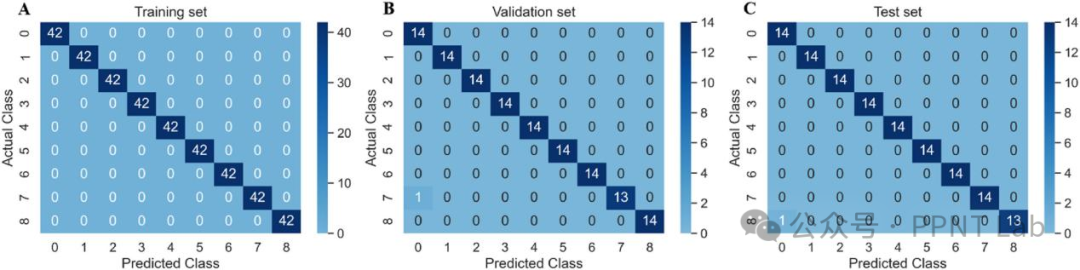
Figure 4 Confusion matrices of the CNN-Max model for the training set, test set, and validation set (A-C). Samples labeled 0-8 represent D-cellobiose, D-fructose, D-galactose, D-glucose, D-maltose, D-mannose, D-sorbitol, sucrose, and α-lactose respectively
Transfer learning involves applying an established model to similar tasks. After successfully classifying structurally similar sugars, the model was used to predict sugar concentrations at seven different levels. The best results were obtained at 811 epochs during training over 1000 epochs (Figure 5). The training process was smooth, with good consistency between the training and validation sets. Figure 6 shows that the R2 values for the model in the training, validation, and test sets were 100%, 98%, and 97%, respectively, validating the CNN’s ability to extract information from the high-dimensional 3D FL spectra and enhancing the model’s learning effectiveness.
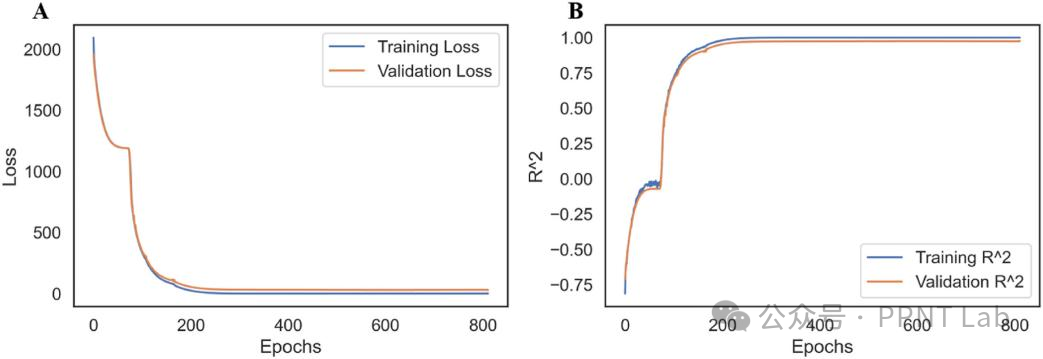
Figure 5 Convergence curves of model training and validation at 811 epochs, showing loss (A) and R2 (B) for the CNN-Max model
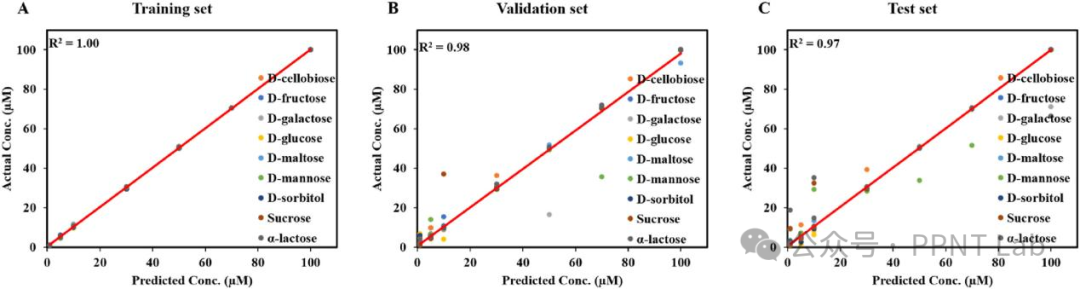
Figure 6 Quantitative analysis of nine selected sugars, showing the predicted and actual concentrations for the training, validation, and test sets of the CNN-Max model (A-C). An R2 value is provided to illustrate the overall performance of the model
Conclusion
This study developed a CNN-Max deep learning model that integrates a max pooling layer based on the oxidase-like properties of CuO NPs and the 3D fluorescence spectra generated from their reactions with carbohydrates. The model achieved high-precision classification (99-100%) of nine structurally similar carbohydrates and wide concentration range (1-100 μM) quantification (R²=97-100%), successfully applied to the detection of sugar mixtures in serum and polysaccharides in lake water, with a detection limit for fructose as low as 4.23 nM, enhancing sensitivity by 120 times. This method significantly outperforms existing deep learning models, demonstrating robustness against interference and applicability in multiple scenarios, providing a new paradigm for intelligent detection of sugar molecules in complex samples, with significant promotional value in biomedical and environmental monitoring fields.
This work was published in the international journal TALANTA under the title “Deep convolutional neural network-based 3D fluorescence sensor array for sugar identification in serum based on the oxidase-mimicking property of CuO nanoparticles”. Wei Chen and Hao-Hua Deng from Fujian Medical University are the corresponding authors of this paper, with Hamada A.A. Noreldeen and Shao-Bin He from the Second Affiliated Hospital of Fujian Medical University as co-first authors.
Article Link:
https://doi.org/10.1016/j.talanta.2024.126679
Contributed by: Xiaoyin Feng
Edited by: PPNT Lab
Reviewed by: Shao-Bin He

WeChat ID: PPNT Lab
Scan to follow us