This article introduces several practical tools for Linux system administration, hoping to assist Linux administrators.
1. Monitor Process Bandwidth Usage – Nethogs
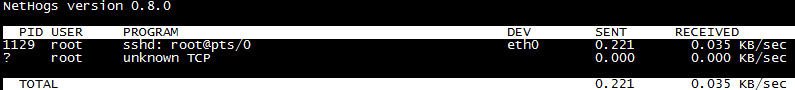
Nethogs is a network traffic monitoring tool that runs in the terminal and can visually display the bandwidth used by each process.
Download: http://sourceforge.net/projects/nethogs/files/nethogs/0.8/nethogs-0.8.0.tar.gz/download
[root@localhost ~]# yum -y install libpcap-devel ncurses-devel
[root@localhost ~]# tar zxvf nethogs-0.8.0.tar.gz
[root@localhost ~]# cd nethogs
[root@localhost nethogs]# make && make install
[root@localhost nethogs]# nethogs eth0
2. Disk Read Performance Testing – IOZone
IOZone is a Linux file system performance testing tool that can test the read and write performance of file systems across different operating systems.
Download: http://www.iozone.org/src/current/
[root@localhost current]# tar xvf iozone3_420.tar
[root@localhost ~]# cd iozone3_420/src/current/
[root@localhost current]# make linux
[root@localhost current]# ./iozone -a -n 512m -g 16g -i 0 -i 1 -i 5 -f /mnt/iozone -Rb ./iozone.xls
- -a uses fully automatic mode
- -n sets the minimum file size (Kbytes) for automatic mode.
- -g sets the maximum file size (Kbytes) available for automatic mode.
- -i specifies which test to run.
- -f specifies the name of the test file to be automatically deleted after completion
- -R generates an Excel output to standard output
- -b specifies the output to a specified file
3. Real-time Disk IO Monitoring – IOTop
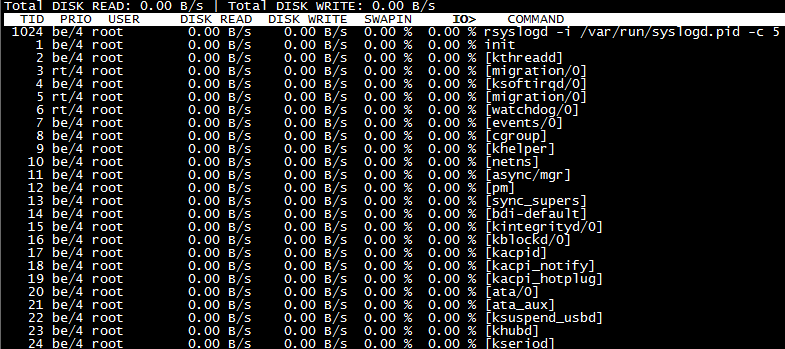
The IOTop command is specifically designed to display disk IO, with an interface style similar to the top command.
[root@localhost ~]# yum -y install iotop
4. Network Traffic Monitoring – IPtraf
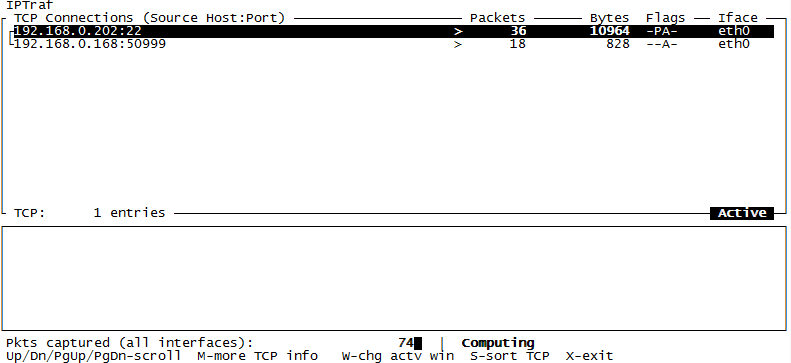
IPtraf is a simple network status analysis tool that runs on Linux.
[root@localhost ~]# yum -y install iptraf
5. Network Traffic Monitoring – IFTOP
iftop is a real-time traffic monitoring tool similar to top in Linux. It is more intuitive than iptraf.
Download: http://www.ex-parrot.com/~pdw/iftop/
[root@localhost ~]# tar zxvf iftop-0.17.tar.gz
[root@localhost ~]# cd iftop-0.17
[root@localhost iftop-0.17]# ./configure
[root@localhost iftop-0.17]# make && make install
[root@localhost iftop-0.17]# iftop
[root@localhost iftop-0.17]# iftop -i eth0 # Specify the network interface to monitor
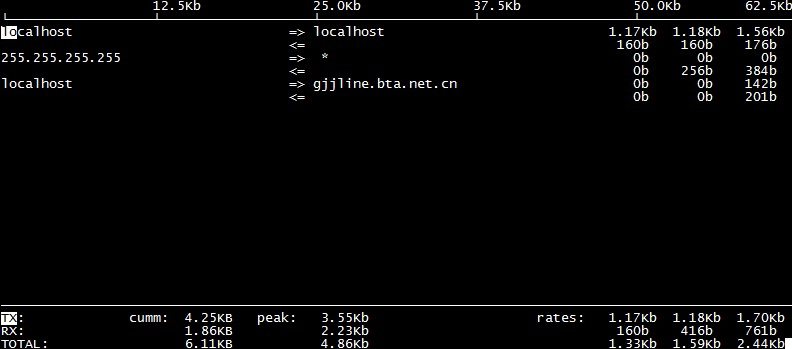
- TX: Transmit traffic
- RX: Receive traffic
- TOTAL: Total traffic
- Cumm: Total traffic since running iftop
- peak: Traffic peak
- rates: Average traffic over the past 2s, 10s, and 40s
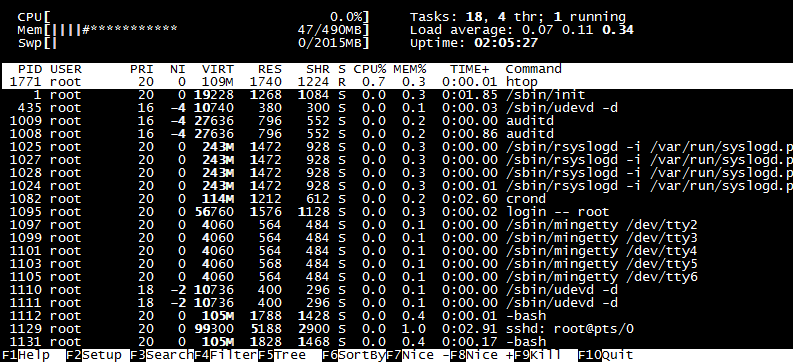
6. Real-time Process Monitoring – HTop
HTop is an interactive process viewer for Linux that can replace the top command.
rpm -ivh http://pkgs.repoforge.org/rpmforge-release/rpmforge-release-0.5.2-2.el6.rf.x86_64.rpm # Install third-party YUM repository

[root@localhost ~]# yum -y install htop
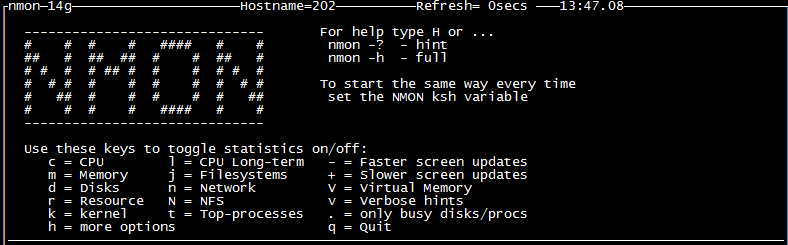
7. System Resource Monitoring – NMON
NMON is a widely used monitoring and analysis tool on AIX and various Linux operating systems.
Download: http://sourceforge.jp/projects/sfnet_nmon/releases/
[root@localhost ~]# chmod +x nmon_x86_64_rhel6
[root@localhost ~]# mv nmon_x86_64_rhel6 /usr/sbin/nmon
[root@localhost ~]# nmon
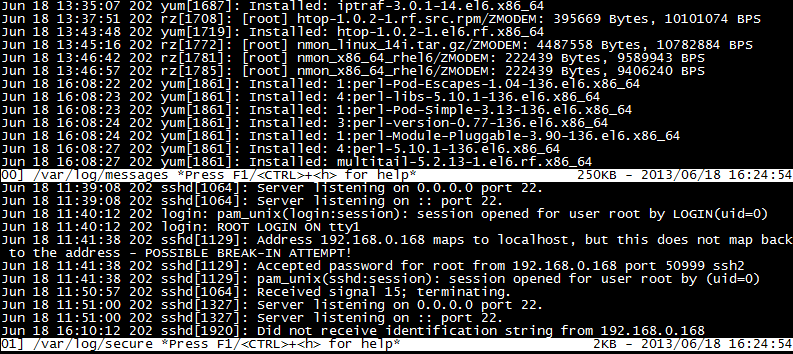
8. Monitor Multiple Logs – MultiTail
MultiTail is software that opens multiple windows in the console to monitor multiple log files simultaneously, similar to the tail command.
rpm -ivh http://pkgs.repoforge.org/rpmforge-release/rpmforge-release-0.5.2-2.el6.rf.x86_64.rpm # Install third-party YUM repository

[root@localhost ~]# yum -y install multitail
[root@localhost ~]# multitail -e "fail" /var/log/secure # Monitor with keyword filtering
[root@localhost ~]# multitail -l "ping baidu.com" # Monitor the command to be executed
[root@localhost ~]# multitail -i /var/log/messages -i /var/log/secure # -i specifies a file name
9. SSH Brute Force Protection – Fail2ban
Fail2ban can monitor your system logs and match error messages using regular expressions to execute corresponding blocking actions, usually by calling the firewall to block.
Download: http://www.fail2ban.org/wiki/index.php/Downloads
[root@localhost ~]# cd fail2ban-0.8.11
[root@localhost fail2ban-0.8.11]# python setup.py install
[root@localhost fail2ban-0.8.11]# cd files/
[root@localhost files]# cp ./redhat-initd /etc/init.d/fail2ban
[root@localhost files]# service fail2ban start
[root@localhost files]# chkconfig --add fail2ban
[root@localhost files]# chkconfig fail2ban on
Note: It is necessary to configure iptables. If iptables is restarted, fail2ban must also be restarted, as fail2ban works by calling iptables to block external attacks in real-time.
[root@localhost ~]# grep -v "^#" /etc/fail2ban/jail.conf | grep -v "^$"

[DEFAULT] ignoreip = 127.0.0.1/8

# Ignore local IP bantime= 600
# Block time after matching rules findtime= 600
# Duration to match rules for blocking, e.g., if 3 matches occur within 600 seconds then execute maxretry =
# Maximum attempts backend = auto
# Log modification detection loggamin, polling, and auto these three usedns = warn [ssh-iptables] enabled= true
# Default is disabled false filter = sshd action = iptables[name=SSH, port=ssh, protocol=tcp]
# sendmail-whois[name=SSH,dest=recipient email, sender=sender email, sendername="Fail2Ban"] logpath= /var/log/sshd.log
# The corresponding error log is usually in /var/log/secure maxretry = 5
# Number of error attempts overrides the global maxretry
Note: By default, all application protections are disabled and need to be manually enabled. The fail2ban.conf file contains log information, while the jail.conf file contains specific service and action configuration information for protection.
[root@localhost ~]# touch /var/log/sshd.log
[root@localhost ~]# service fail2ban restart
[root@localhost ~]# fail2ban-client status # Check the monitoring status
Status
|- Number of jail:1
`- Jail list: ssh-iptables
[root@localhost ~]# iptables -L # iptables filter table has a fail2ban rule
fail2ban-SSH tcp -- anywhere anywhere tcp dpt:ssh
10. Persistent Connection Session – Tmux
Tmux is an excellent terminal multiplexing software similar to GNU Screen, but more convenient, flexible, and efficient. It ensures that disconnections during SSH do not affect task execution.
rpm -ivh http://pkgs.repoforge.org/rpmforge-release/rpmforge-release-0.5.2-2.el6.rf.x86_64.rpm # Install third-party YUM repository
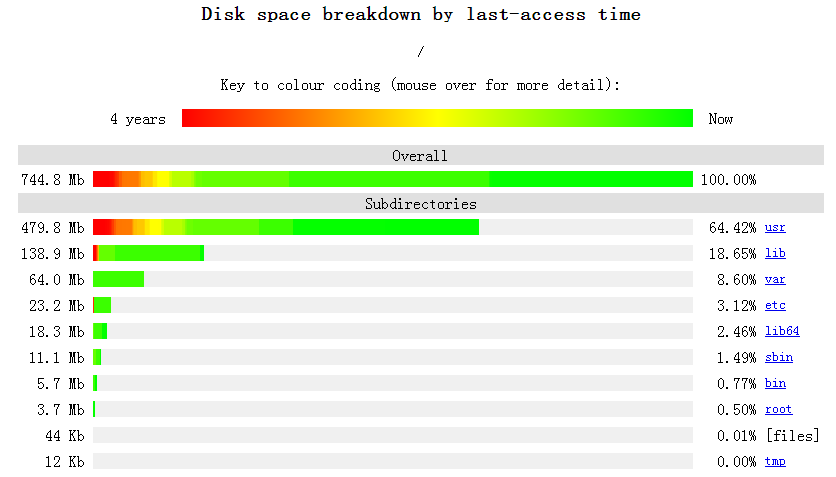
11. Display Disk Space Usage – Agedu
Download: http://www.chiark.greenend.org.uk/~sgtatham/agedu/
[root@localhost ~]# tar zxvf agedu-r9723.tar.gz
[root@localhost ~]# cd agedu-r9723
[root@localhost ~]# ./configure
[root@localhost ~]# make && make install
[root@localhost ~]# agedu -s / # -s scan
[root@localhost ~]# agedu -w --address 192.168.0.10:80 # -w input a web link
[root@localhost ~]# agedu -w --address 192.168.0.108080 --auth none # --auth disable authentication; if no port number is added, a random one will be generated for browser access
12. Security Scanning Tool – NMap
NMap is a network connection scanning and sniffing toolkit for Linux, used to scan open network connection ports on computers.
Download: http://nmap.org/download.html
[root@localhost ~]# tar jxvf nmap-6.40.tar.bz2
[root@localhost nmap-6.40]# ./configure
[root@localhost nmap-6.40]# make && make install
[root@localhost ~]# nmap 192.168.0.10 # Get basic information
[root@localhost ~]# nmap -O 192.168.0.10 # Get system version information
[root@localhost ~]# nmap -A 192.168.0.10 # Get comprehensive system information
[root@localhost ~]# nmap 192.168.0.0/24 # Get basic information on devices in a subnet
-sS TCP scan
-sV system version detection
13. Web Stress Testing – Httperf
Httperf is more powerful than ab, capable of testing the maximum service load that a web service can handle and identifying potential issues such as memory usage and stability. Its greatest advantage is the ability to specify patterns for stress testing, simulating a real environment.
Download: http://code.google.com/p/httperf/downloads/list
[root@localhost ~]# tar zxvf httperf-0.9.0.tar.gz
[root@localhost ~]# cd httperf-0.9.0
[root@localhost httperf-0.9.0]# ./configure
[root@localhost httperf-0.9.0]# make && make install
[root@localhost ~]# httperf --hog --server=192.168.0.202 --uri=/index.html --num-conns= 10000 --wsess=10,10,0.1
Parameter Explanation
- –hog: Allows httperf to create as many connections as possible; httperf will generate access connections in a regular pattern based on hardware configuration.
- –num-conns: Number of connections, initiating a total of 10000 requests.
- –wsess: Simulates the timing pattern of user webpage access; the first 10 indicates generating 10 session connections, the second 10 indicates each session connection will make 10 requests, and 0.1 indicates the interval time between requests per session connection in seconds.
Two ways to obtain materialsBoth can be obtained for free1. Follow the operations in the video to obtain2. Scan the code with the note: devops collection100% direct acquisition~