Problem Description
After downloading the elf file, a message box pops up as shown in Figure 1, indicating that there is a problem with the software operation. However, the software runs correctly; for instance, the VGA interface displays images normally, as shown in Figure 2. Moreover, this error does not appear in Debug mode.
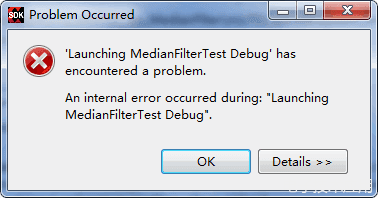
Figure 1: Error Indication During Full Speed Operation

Figure 2: Normal Program Operation Result
Click the Details button in Figure 1, as shown in Figure 3.
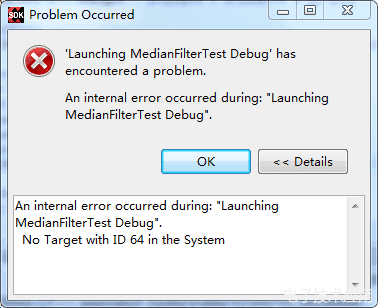
Figure 3: Detailed Error Description
It indicates that the target with ID 64 cannot be found…
At this point, click the red square button shown in Figure 4 to attempt to stop the program.
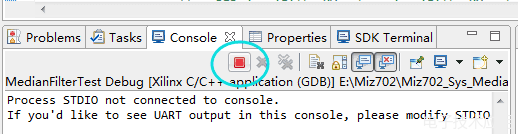
Figure 4: Stop Program Execution
The stop attempt fails, and a message box pops up as shown in Figure 5.
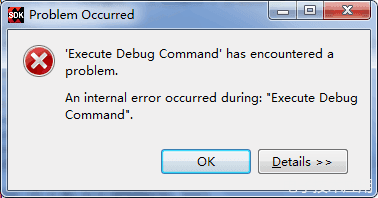
Figure 5: Stop Execution Error
Click the Details button in the message box to view the detailed prompt message:
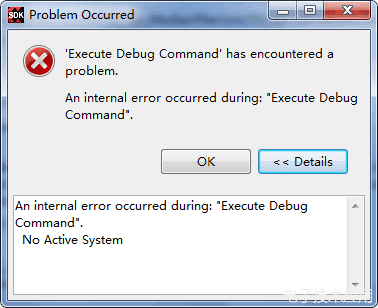
Figure 6: Stop Execution Error Description
After this error occurs, the software cannot be run again; you need to exit the SDK, then reopen the SDK and enter the workspace.
Solution
Solution 1:
Open the XMD command line window and input connect arm hw to establish a connection with the ARM core. Once connected successfully, you can use the GUI to stop the program, and no error message will pop up. However, you will still need to exit the SDK and reopen it.
Note: After a successful connection, the prompt information will appear in the red box of Figure 7. By combining this with the error in Figure 3, you can see that the GUI operation failed to establish a connection with the ARM core.
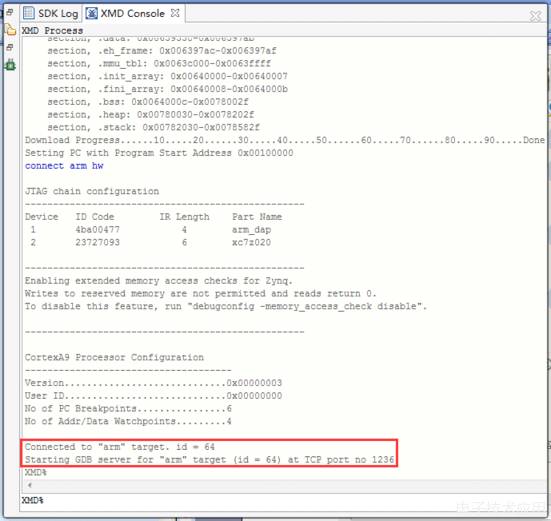
Figure 7: Command Connection Established
However, this method does not solve the issue of the error message popping up after the elf download is complete. In other words, if you continue to use the GUI to load the elf, an error will occur after the elf is loaded, and the program cannot be stopped.
Solution 2:
A better approach is to avoid using the GUI and utilize the XMD command line to execute the entire program process. The steps are as follows:
-
Establish a connection with the ARM core.
-
Load the bitstream.
-
Load the elf.
Note: You need to specify the full path of the bit and elf files here, and use / for separation, not \. For example:
E:/Miz702/Miz702_Sys_MedianFilter/miz702_sys.sdk/MedianFilterTest/Debug/MedianFilterTest.elf
-
Run the software at full speed.
-
Stop the program.
-
Disconnect; here you need the ARM core ID, which should match the ID printed when establishing the connection, usually 64, as shown in the printed information in the red box of Figure 7.
-
Power off the development board.
The entire command sequence is as follows:
|
connect arm hw fpga *.bit dow *.elf con stop disconnect 64 |
Note: You need to specify the detailed paths for *.bit and *.elf according to your situation.