Non-contact · Panoramic Temperature Measurement · Intelligent Diagnosis — Infrared Technology Redefines Fault Prediction and Health Management of Electronic Devices
Application in R&D Stage
(1) Thermal Design Verification
Real-time observation ofPCBboardthermal distribution uniformity, optimizing component layout
(2) Heat Dissipation Scheme Evaluation
Comparing the effects of different heat dissipation schemes (heat sinks/thermal grease/fans), quantifying temperature rise differences
(3) Load Testing
Simulating full load and overload conditions, identifyingthermal bottleneck areas
Application in Production Testing
(1) Online Quality Control
100%productthermal distribution map inspection, detecting soldering defects and component errors
(2) Rapid Fault Localization
Locating short circuits, overloads, and cold solder joints within3minutes, improving efficiency by10times
(3) Aging Test Optimization
Reducing aging time to one-third of the original, based ontemperature rise curve predictionsof lifespan
1. Component-level Precision Diagnosis
(1) Thermal Anomaly Detection in Integrated Circuits
1. CPU/FPGAOverheating Warning
When the temperature difference on the chip surface exceeds5℃, it warns of internal structural anomalies, detecting potential faults earlier than electrical performance testing
2. Power Management IC Failure Prediction
MonitoringLDO and DC-DCconverter efficiency: abnormal temperature rise > 8℃indicates efficiency drop > 15%
(2) Passive Component Fault Diagnosis
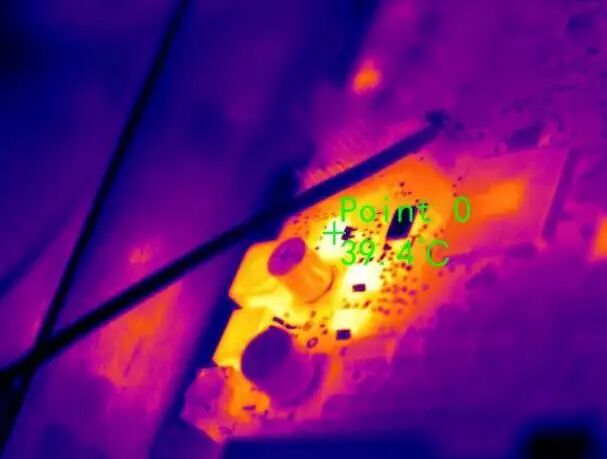
1. Capacitor ESR Increase Detection
Electrolytic capacitor top temperature rise > 3℃indicates an increase in ESR by more than30%
2. Resistor Overload Failure
Resistor body temperature > 125℃(150% of rated power) triggers an alarm
2. PCB Board-Level Thermal Management Optimization
(1) Copper Foil Trace Current Distribution
Using thermal images to backtrackcurrent density distribution, optimizing trace width design:
(1) Identifying current congestion areas (temperature rise > 10℃/cm)
(2) Locating impedance mismatch points (temperature anomaly fluctuations)
(2) Solder Quality Assessment
1. BGA Soldering Defects
Ball temperature difference > 15℃indicates cold soldering or void rate > 25%
2. Through-hole Solder Joint Cold Soldering
Solder joint temperature lower than surrounding by20℃ or moreindicates insufficient soldering heat
|
Fault Type |
Infrared Thermal Characteristics |
Temperature Anomaly Range |
Detection Efficiency Improvement |
|
Component Short Circuit |
Local hotspot > surrounding30℃ |
80℃~150℃ |
10times (3 minutes → 18 seconds) |
|
Solder Joint Cold Soldering |
Low temperature point (lower than surrounding by15℃) |
25℃~40℃ |
8times (invisible to the naked eye → visible) |
|
Capacitor Failure |
Top temperature rise > 3℃ |
50℃~85℃ |
6times (requires disassembly → direct observation) |
|
Trace Overload |
Line-shaped high-temperature zone |
60℃~120℃ |
12times (calculation → visual display) |
3. Advanced Detection Methods and Technical Advantages
(1) Dynamic Thermal Testing Technology
1. Power-on Transient Thermal Analysis
Capturingmillisecond thermal shocks, identifying short-circuit components (current > 10A)
2. Power Cycling Testing
Analyzing power devices through thermal imagesjunction temperature fluctuations
(2) Intelligent Diagnosis Algorithms
1. Thermal Pattern Recognition
AIalgorithms automatically compare normal/anomalous thermal distribution maps, accuracy > 95%
2. Predictive Maintenance
Predicting component remaining lifespan based on historical temperature rise curves (error < 10%)
Typical Case: Communication Equipment Mainboard Inspection
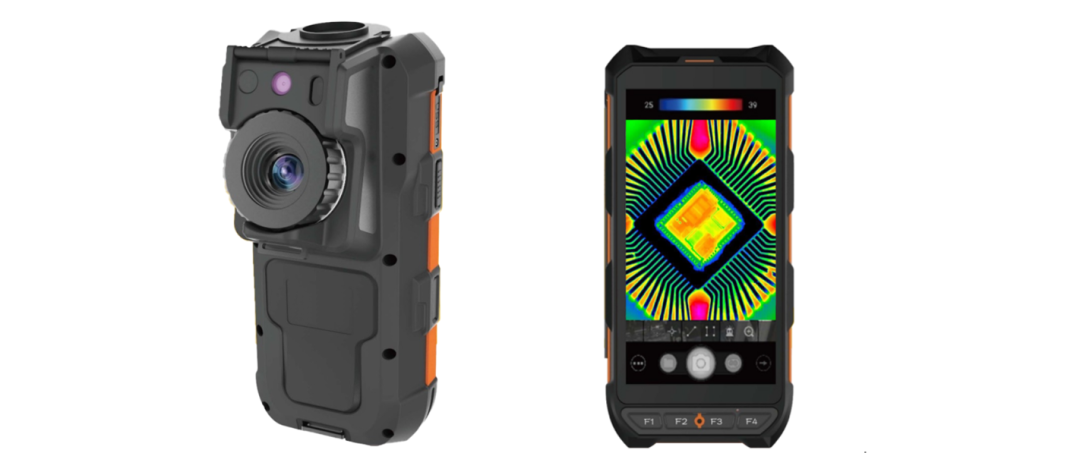
A company used theWavelab E16 infrared thermal imager (640×512resolution) to inspect5Gbase station mainboard:
(1) Identified Issues:FPGAchip local hotspot85℃ (surrounding65℃)
(2) Root Cause:BGAsolder void rate38% (X-ray verification)
(3) Improvement Effect:After rework, temperature dropped to68℃, failure rate decreased by90%
Economic Benefits: Annual savings on maintenance costs of ¥1.2M, avoiding base station downtime losses of ¥5.8M
4. Optical Research Technology Circuit Board Inspection Solutions
(1) Recommended Equipment Selection
1. In-depth Analysis for R&D
Wavelab E16:640×512resolution,0.05℃ thermal sensitivity, supports macro lenses
2. Rapid Production Testing
Wavelab E13:384×288resolution, automatic over-temperature alarm,8hours of battery life
(2) Professional Analysis Software
1. Thermal Distribution Comparison
Automatically comparing good and bad product thermal images, highlighting differences > 2℃ areas
2. Trend Prediction
Generating componentlifespan prediction curves based on big data
5. Advantages Compared to Traditional Testing Methods
|
Testing Method |
Infrared Thermal Imaging |
Multimeter/ Oscilloscope |
Visual Inspection |
|
Testing Speed |
Fast (second-level panoramic) |
Slow (point measurement) |
Average (depends on experience) |
|
Fault Prediction |
Early warning |
Post-failure detection |
Basically unable to predict |
|
Visualization |
Global thermal distribution map |
Values/Waveforms |
Surface defects only |
|
Coverage |
100%component simultaneous detection |
Single point sequential detection |
Prone to missed detection |
Infrared Product Consultation Contact:
Phone:15623212855 (WeChat same number)
 ·END·— If you like it, share it with your friends —Click the “See More” button in the lower right corner to let more people see it!Disclaimer: The writing or reprinting of this article is to convey more information and contribute to the optical industry. If any text or images in the article unintentionally infringe upon your legal rights or have other inappropriate aspects, please contact the author within 20 working days, and we will coordinate to address it. Friends are welcome to supervise the content on the public account and provide valuable opinions!Contact Email:[email protected], industry friends are welcome to submit articles to us.Thank you.