Please follow me if you like, I share new knowledge every day.
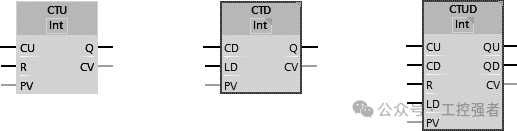
1. Types of Counters As shown in the figure, the Siemens S7-1200 PLC has three types of counters: Count Up Counter (CTU), Count Down Counter (CTD), and Count Up/Down Counter (CTUD). They belong to software counters. The maximum counting rate is limited by the execution rate of the organizational block. If a higher rate counter is needed, the built-in high-speed counter of the CPU can be used.

Types of Counters
When calling the counter instruction, a background data block to store the counter data needs to be generated, as shown in Figure 2-34. In the figure, CU and CD are the inputs for counting up and counting down, respectively. When CU or CD changes from 0 to 1, the actual count value CV increases or decreases by 1; when the reset input R is 1, the counter is reset, CV is cleared to 0, and the counter input Q becomes 0. The instruction parameter descriptions for the three types of counters are shown in the table.
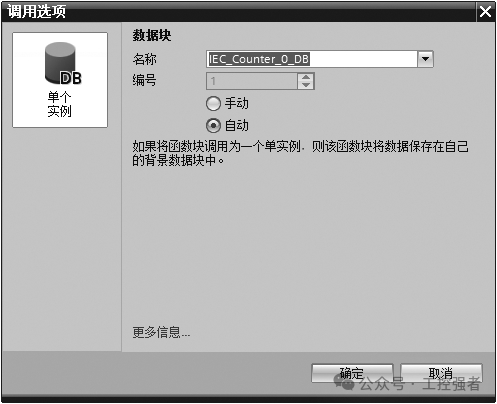
Calling Options
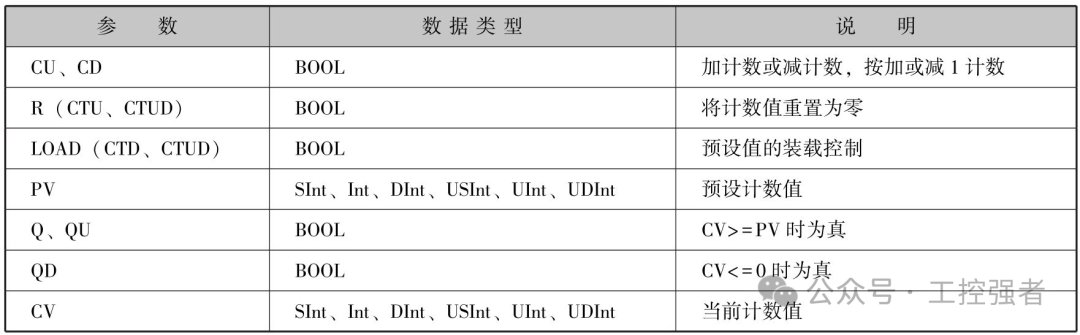
Instruction Parameters for the Three Types of Counters
Instruction Parameter Descriptions for the Three Types of Counters
2. CTU Counter
When the parameter CU value of the CTU counter changes from 0 to 1, the CTU increases the count value by 1. If the value of parameter CV (current count value) is greater than or equal to the value of parameter PV (preset count value), the counter output parameter Q=1. If the reset parameter R changes from 0 to 1, the current count value is reset to 0. Therefore, the CTU counter is also known as a count up counter. Figures 2-36 and 2-37 show the application and timing diagram of the CTU counter instruction, respectively.
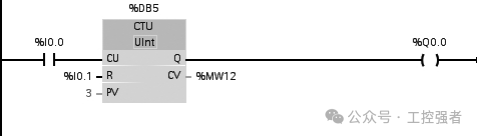
Figure 2-36 Application of CTU Counter Instruction
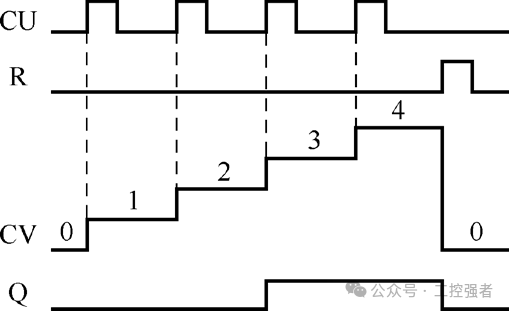
Figure 2-37 Timing Diagram of CTU Counter Instruction
3. CTD Counter
When the parameter CD value of the CTD counter changes from 0 to 1, the CTD decreases the count value by 1. If the value of parameter CV (current count value) is equal to or less than 0, the counter output parameter Q=1. If the value of parameter LOAD changes from 0 to 1, the value of parameter PV (preset value) will be loaded as the new CV (current count value) into the counter. Therefore, the CTD counter is also known as a count down counter. Figures 2-38 and 2-39 show the application and timing diagram of the CTD counter instruction, respectively.
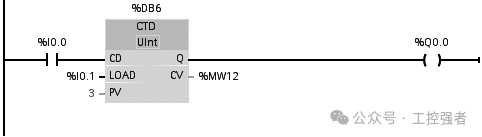
Figure 2-38 Application of CTD Counter Instruction
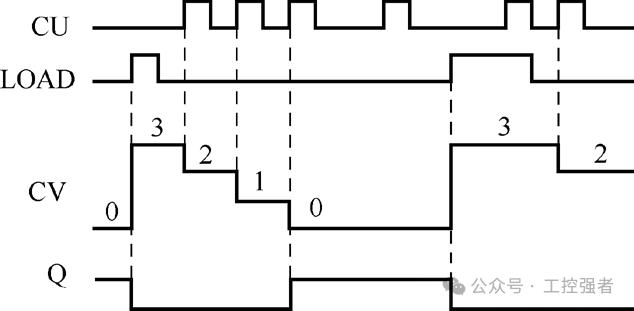
Figure 2-39 Timing Diagram of CTD Counter Instruction
4. CTUD Counter
In the CTUD counter, when the count up (CU) or count down (CD) input changes from 0 to 1, the CTUD will increase or decrease the count value by 1. If the value of parameter CV (current count value) is greater than or equal to the value of parameter PV (preset value), the counter output parameter QU=1. If the value of parameter CV is less than or equal to zero, the counter output parameter QD=1.
If the value of parameter LOAD changes from 0 to 1, the value of parameter PV (preset value) will be loaded as the new CV (current count value) into the counter. If the reset parameter R changes from 0 to 1, the current count value is reset to 0. Figures 2-40 and 2-41 show the application and timing diagram of the CTUD counter instruction, respectively.
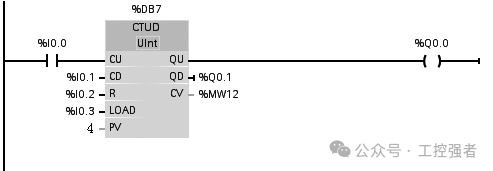
Figure 2-40 Application of CTUD Counter Instruction
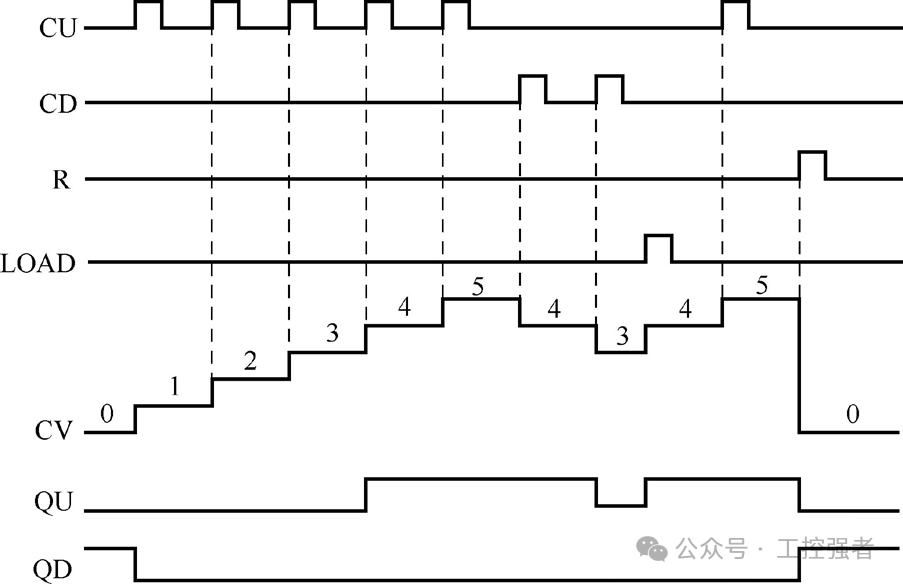
Figure 2-41 Timing Diagram of CTUD Counter Instruction
5. Example 7: Production Line Output Counting
1. PLC Control Task Description
Figure 2-42 shows the application of output counting for a production line. The product is counted through the sensor input I0.0. When the output count reaches 10, the indicator light Q0.0 turns on; when the output count reaches 15, the indicator light Q0.0 flashes. The reset signal is provided by the reset button I0.1.
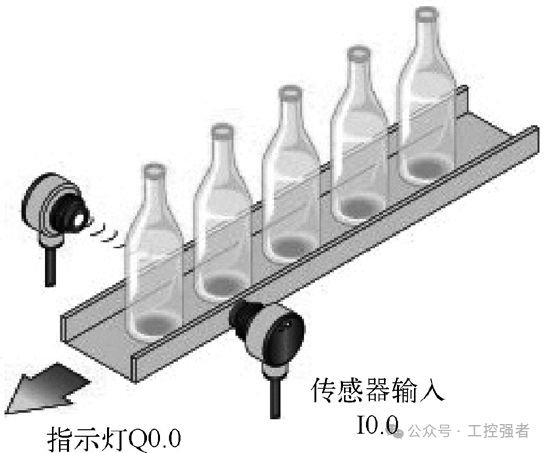
Figure 2-42 Application of Production Line Output Counting
2. Electrical Wiring
Figure 2-43 shows the electrical wiring for the production line output counting application.
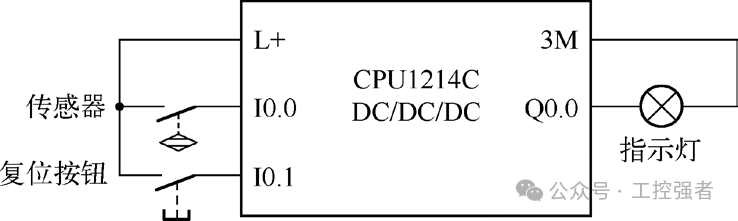
Figure 2-43 Electrical Wiring for Production Line Output Counting Application
3. PLC Programming
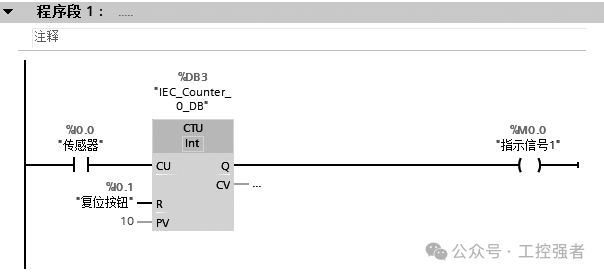
Figure 2-44 Ladder Diagram for Production Line Output Counting Application
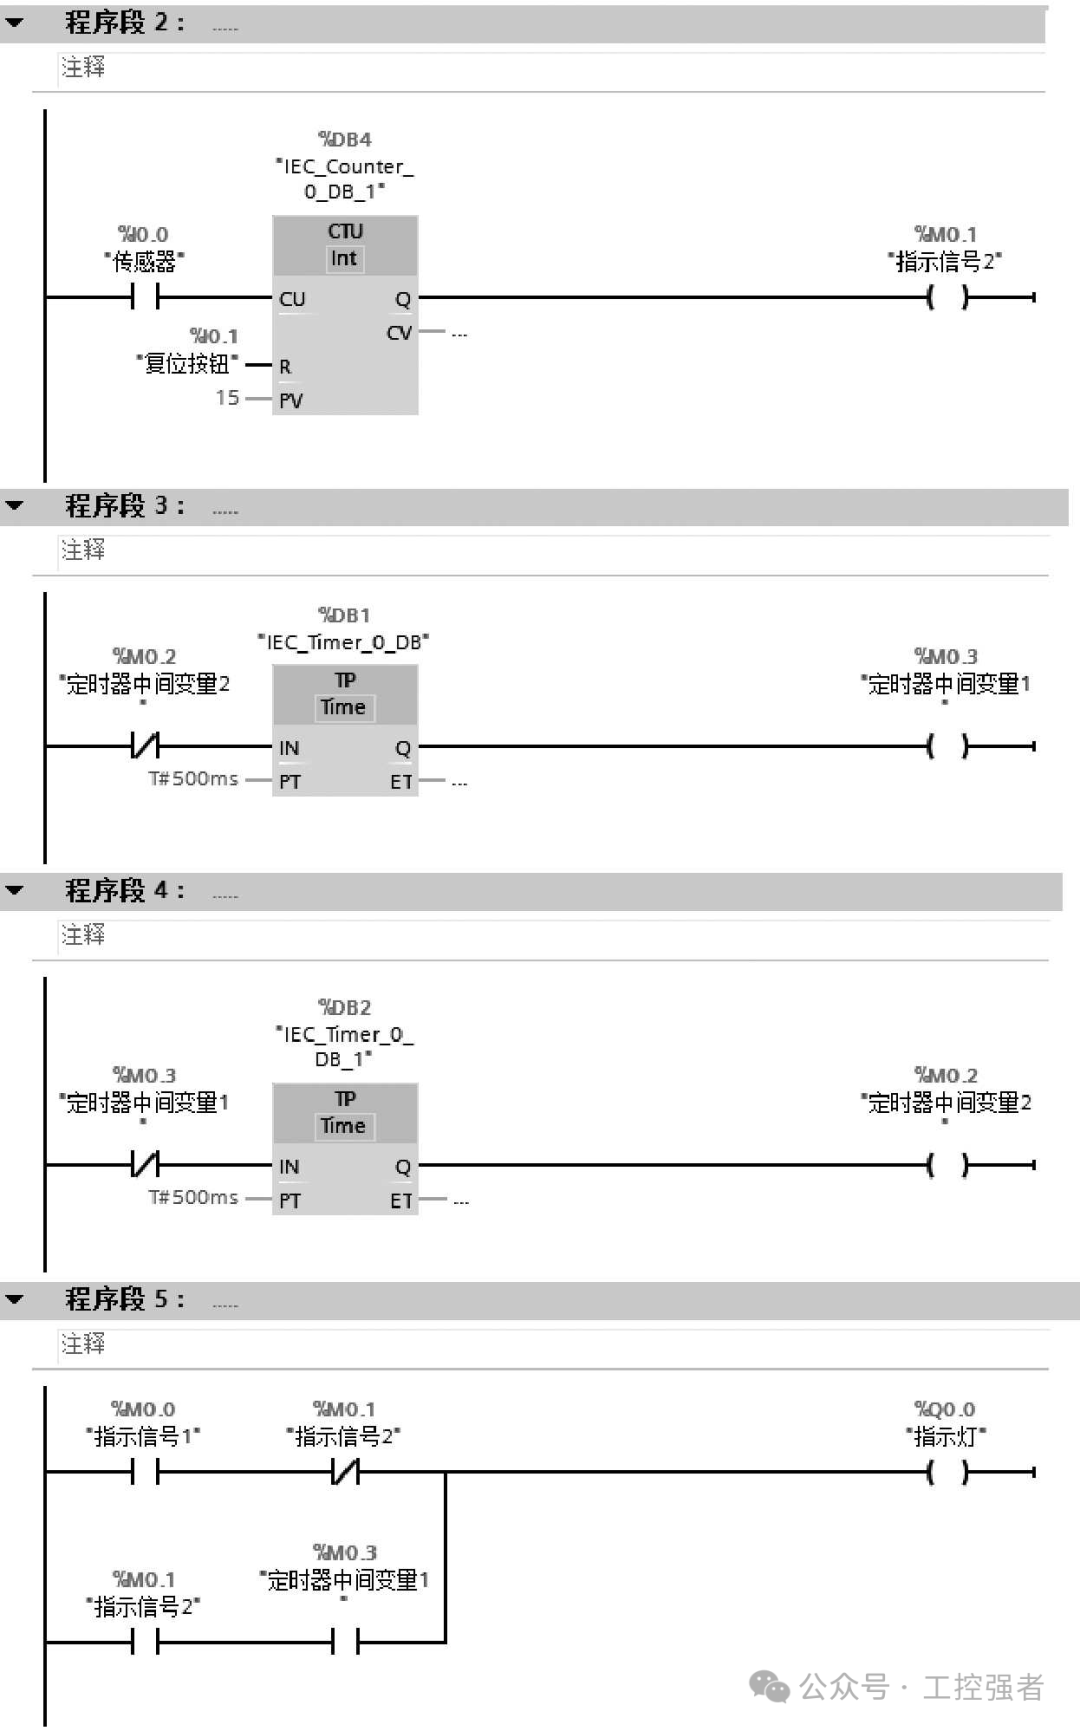
Figure 2-44 Ladder Diagram for Production Line Output Counting Application (Continued)
Figure 2-44 is the ladder diagram for the production line output counting application, which requires setting up two counters and two timers. Among them, Counter 1 is used to count 10 (specifically program segment 1); Counter 2 is used to count 15 (specifically program segment 2); Timer 1 and Timer 2 are set with different PT values to form a flashing (oscillation) circuit (specifically program segment 3, program segment 4). There are a total of 4 DBs, corresponding to the above counters and timers, as shown in Figure 2-45.
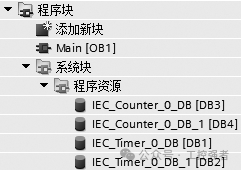
Figure 2-45 Corresponding DB
6. Example 8: Exhibition Hall People Count Indicator
1. PLC Control Task Description
There is an exhibition hall that can accommodate a maximum of 50 people at the same time. A sensor is installed at both the entrance and exit of the exhibition hall. Each time a person enters or exits, the sensor sends a pulse signal. The programming should be implemented so that when there are fewer than 50 people in the exhibition hall, the green light is on, indicating that entry is allowed; when the exhibition hall is full with 50 people, the red light is on, indicating that entry is not allowed.
2. Electrical Wiring Diagram
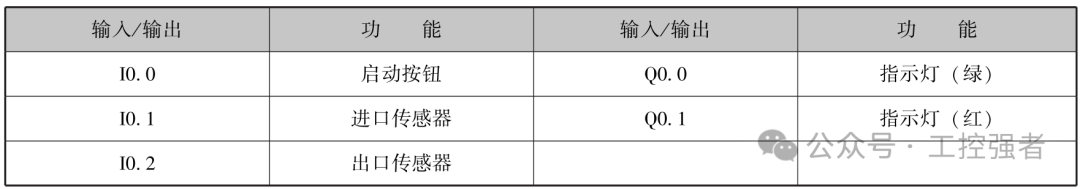
Figure 2-46 shows the electrical wiring for the exhibition hall people count indicator. Table 2-19 lists the input/output components and their control functions.
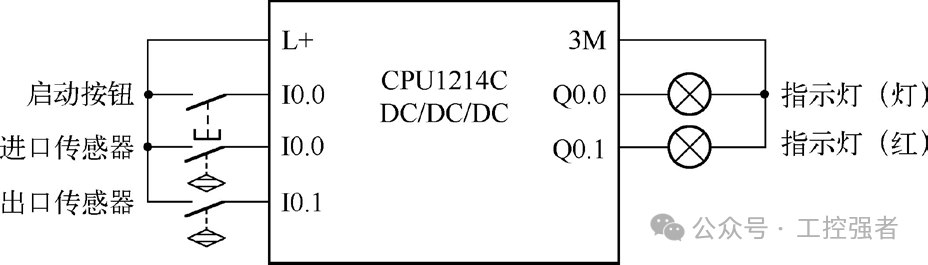
Figure 2-46 Electrical Wiring for Exhibition Hall People Count Indicator
Table 2-19 Input/Output Components and Their Control Functions
3. PLC Programming
Figure 2-47 shows the ladder diagram for the exhibition hall people count indicator, which requires setting up 1 CTUD counter (program segment 1). The CU connects to the entrance sensor, counting the number of people entering the exhibition hall; the CD connects to the exit sensor, counting the number of people leaving the exhibition hall. Program segment 2 indicates the green light status, indicating that entry is allowed. Program segment 3 indicates the red light status, indicating that entry is not allowed.
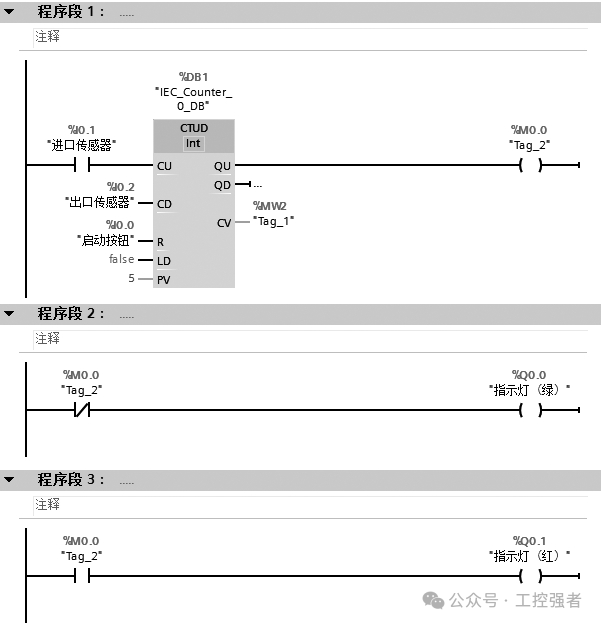
Figure 2-47 Ladder Diagram for Exhibition Hall People Count Indicator
Please help follow the teacher’s public account (click to follow) and feel free to share. Good articles are pure content, with no advertisements, so you can share them with confidence in your WeChat moments and industrial control groups. Remember to give a thumbs up, a heart, and follow for more technical articles in the future.