
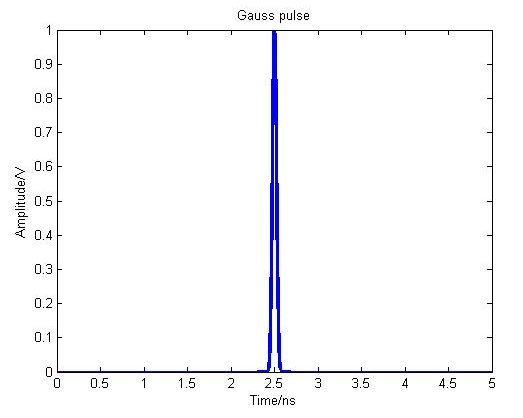
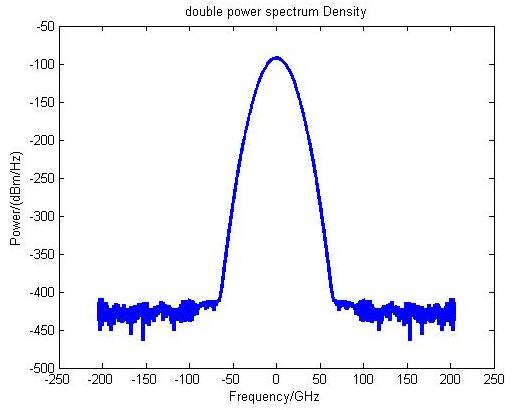
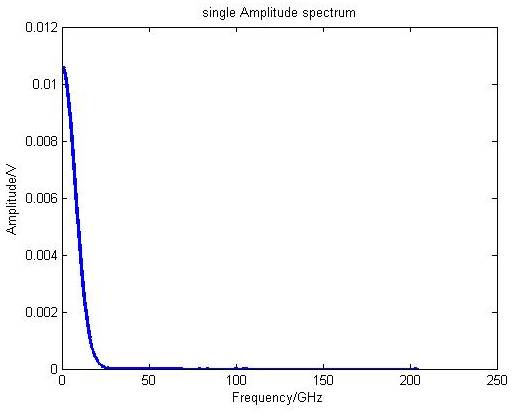
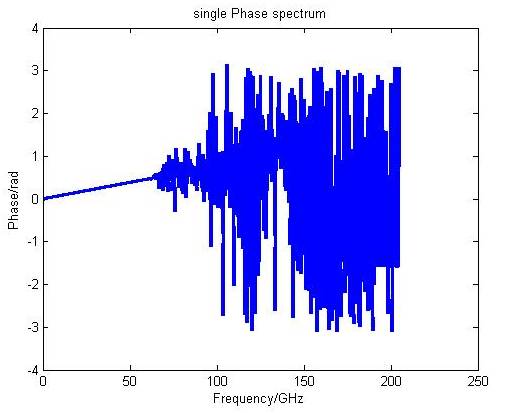
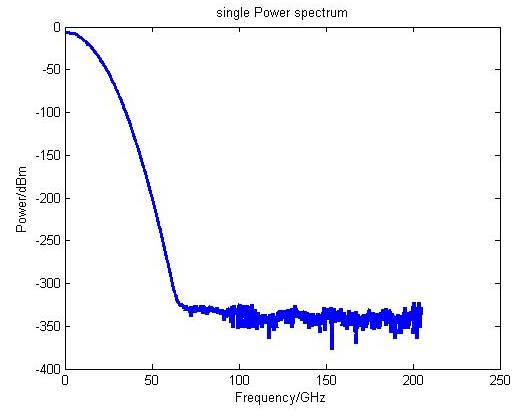
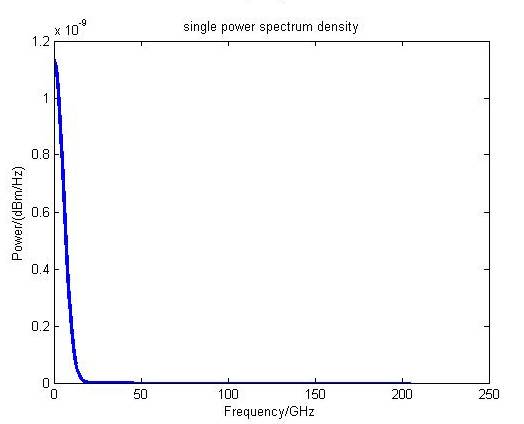
This example uses a Gaussian signal to calculate the amplitude spectrum, phase spectrum, two-sided power spectrum, two-sided power spectral density, one-sided power spectrum, and one-sided power spectral density.The full width at half maximum (FWHM) of the Gaussian signal is 50 ps, with the center point located at 2.5 ns.
MATLAB Code:
%================
%Author:yoyoba
%Email: [email protected]
%================
clc;
clear;
FWHM=50e-12;
% FWHM width of Gaussian signal is 50 ps
time_window=100*FWHM;
% Sampling window width of Gaussian signal, this value determines the frequency resolution after Fourier transform
Ns=2048;
% Number of sampling points
dt=time_window/(Ns-1);
% Sampling time interval
t=0:dt:time_window;
% Sampling time
gauss_time=exp(-0.5*(2*sqrt(2*log(2))*(t-2.5e-9)/FWHM).^2);
% Gaussian pulse, centered at 2.5 ns.
plot(t*1e+9,gauss_time,’linewidth’,2.5);
xlabel(‘Time/ns’);
ylabel(‘Amplitude/V’);
title(‘Gauss pulse’);
%================
% Below calculates two-sided spectrum, two-sided power spectrum, two-sided power spectral density
%================
gauss_spec=fftshift(fft(ifftshift(gauss_time)));
% Fourier transform and perform fftshift operation.
gauss_spec=gauss_spec/Ns;
% Calculate the actual amplitude value;
df=1/time_window;
% Frequency resolution
k=floor(-(Ns-1)/2:(Ns-1)/2),
double_f=k*df;
% Frequency points corresponding to two-sided spectrum
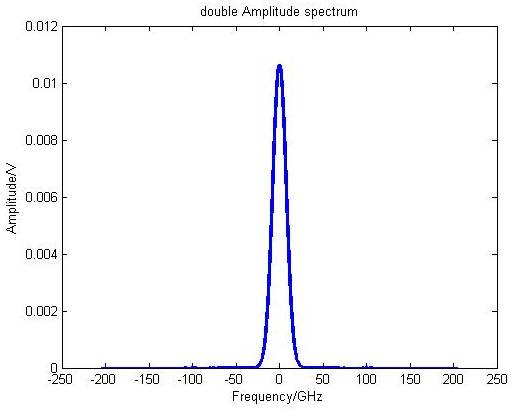
figure;% Amplitude spectrum
plot(double_f*1e-9,abs(gauss_spec),’linewidth’,2.5);
xlabel(‘Frequency/GHz’);
ylabel(‘Amplitude/V’);
title(‘double Amplitude spectrum’);
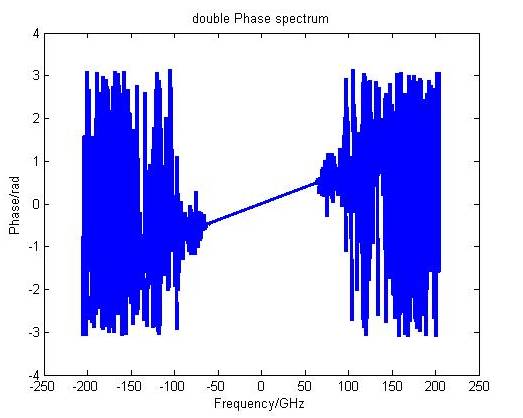
figure;% Phase spectrum
plot(double_f*1e-9,angle(gauss_spec),’linewidth’,2.5);
xlabel(‘Frequency/GHz’);
ylabel(‘Phase/rad’);
title(‘double Phase spectrum’);
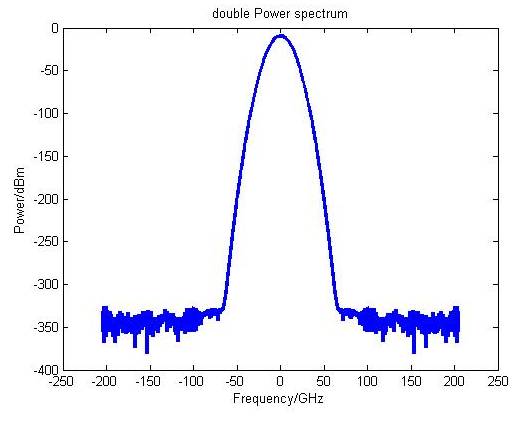
figure;% Power spectrum
double_power_spec_W=abs(gauss_spec).^2;
% Two-sided power spectrum, unit W;
double_power_spec_mW=double_power_spec_W*1e+3;
% Two-sided power spectrum, unit mW;
double_power_spec_dBm=10*log10(double_power_spec_mW);
% Two-sided power spectrum, unit dBm;
plot(double_f*1e-9,double_power_spec_dBm,’linewidth’,2.5);
xlabel(‘Frequency/GHz’);
ylabel(‘Power/dBm’);
title(‘double Power spectrum’);
figure;% Power spectral density
double_power_specD_W=abs(gauss_spec).^2/(df);
% Two-sided power spectral density, unit W/Hz
double_power_specD_mW=double_power_specD_W*1e+3;
% Two-sided power spectral density, unit mW/Hz
double_power_specD_dBm=10*log10(double_power_specD_mW);
% Two-sided power spectral density, unit dBm/Hz
plot(double_f*1e-9,double_power_specD_dBm,’linewidth’,2.5);
xlabel(‘Frequency/GHz’);
ylabel(‘Power/(dBm/Hz)’);
title(‘double power spectrum Density’);
%================
% Below calculates one-sided spectrum, one-sided power spectrum, and one-sided power spectral density
%================
gauss_spec=fft(ifftshift(gauss_time));
% One-sided spectrum calculation does not require fftshift
gauss_spec=gauss_spec/Ns;
% Calculate the real amplitude value
single_gauss_spec=gauss_spec(1:floor(Ns/2));
single_f=(0:floor(Ns/2)-1)*df;
figure;% Amplitude spectrum
plot(single_f*1e-9,abs(single_gauss_spec),’linewidth’,2.5);
xlabel(‘Frequency/GHz’);
ylabel(‘Amplitude/V’);
title(‘single Amplitude spectrum’);
figure;% Phase spectrum
plot(single_f*1e-9,angle(single_gauss_spec),’linewidth’,2.5);
xlabel(‘Frequency/GHz’);
ylabel(‘Phase/rad’);
title(‘single Phase spectrum’);
figure;% Power spectrum
double_power_spec_W=abs(gauss_spec).^2;
single_power_spec_W=2*double_power_spec_W(1:floor(Ns/2));
% One-sided power spectrum, unit W
single_power_spec_mW=single_power_spec_W*1e+3;
% One-sided power spectrum, unit mW;
single_power_spec_dBm=10*log10(single_power_spec_mW);
% One-sided power spectrum, unit dBm;
plot(single_f*1e-9,single_power_spec_dBm,’linewidth’,2.5);
xlabel(‘Frequency/GHz’);
ylabel(‘Power/dBm’);
title(‘single Power spectrum’);
figure;% Power spectral density
double_power_specD_W=abs(gauss_spec).^2/(df);
single_power_specD_W=2*double_power_specD_W(1:floor(Ns/2));
% One-sided power spectral density, unit W/Hz
single_power_specD_mW=single_power_specD_W*1e+3;
% One-sided power spectral density, unit mW/Hz
single_power_specD_dBm=10*log10(single_power_specD_mW);
% One-sided power spectral density, unit dBm/Hz
plot(single_f*1e-9,single_power_specD_mW,’linewidth’,2.5);
xlabel(‘Frequency/GHz’);
ylabel(‘Power/(dBm/Hz)’);
title(‘single power spectrum density’);
Results:

This article is sourced from the blog of stuyou on chinaunix.

Disclaimer: This WeChat reprinted article is for non-commercial educational and research purposes and does not imply endorsement of its views or verification of its content. The copyright belongs to the original author. If there are any copyright issues with the reprinted article, please contact us immediately, and we will modify or delete the related articles to ensure your rights!