Share interest, spread happiness,
increase knowledge, and leave beautiful.
Dear, this is the LearningYard Academy!
Today, the editor brings the
“Hui Xue (25): Learning MATLAB 3D Surface Plotting”
Welcome to visit!
1. Mind mapping
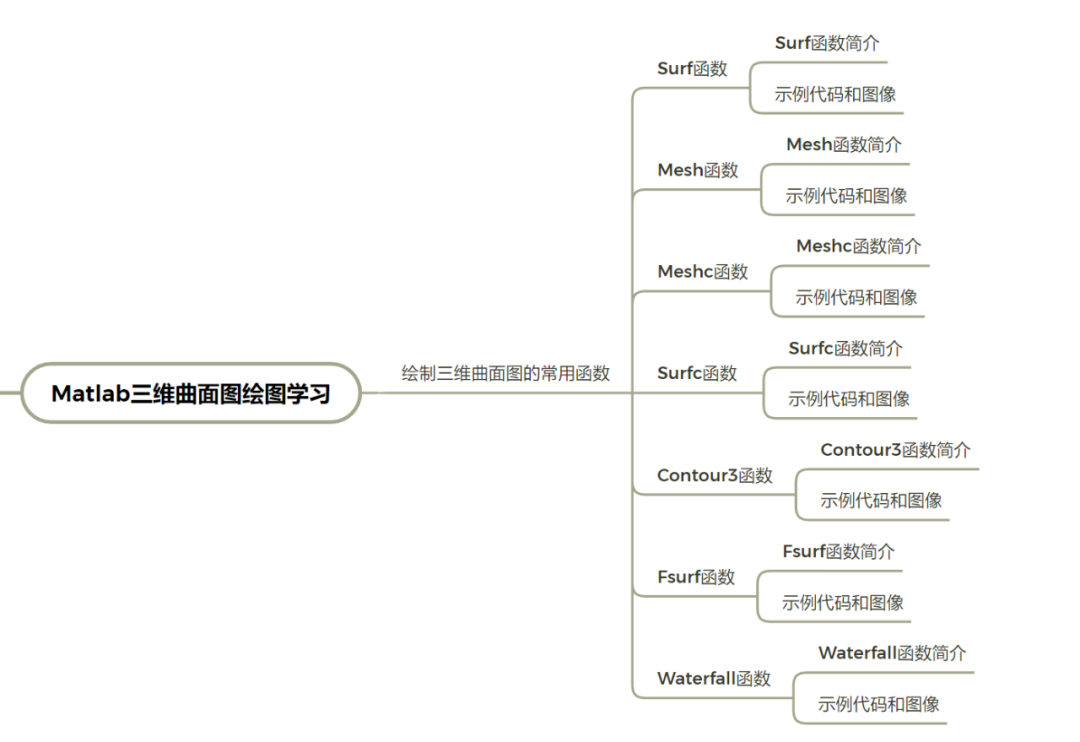
2. Common functions for drawing 3D surface plots
1. surf function
(1) Introduction to surf function
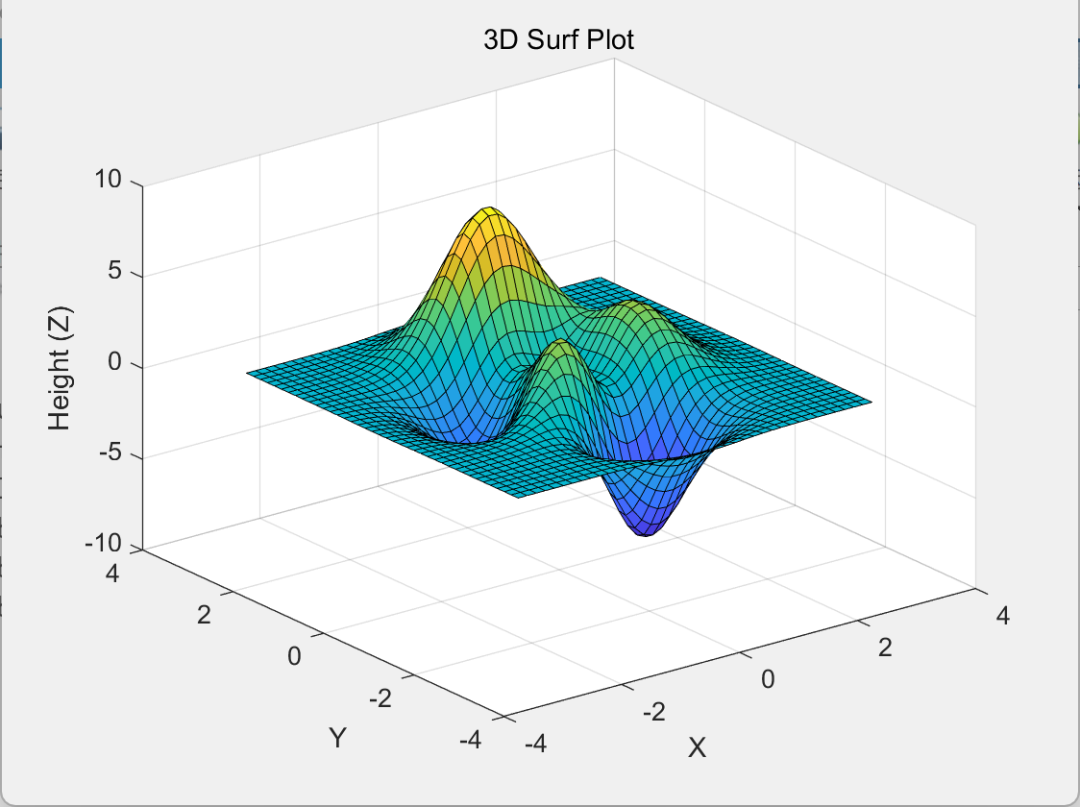
The surf function generates a three-dimensional surface plot with a color fill. The colors are obtained by applying a colormap to the Z values, which more clearly illustrates changes in elevation. Its main features include: a color fill for the surface; a color map corresponding to the elevation values; and a visualization of elevation distribution and surface details.
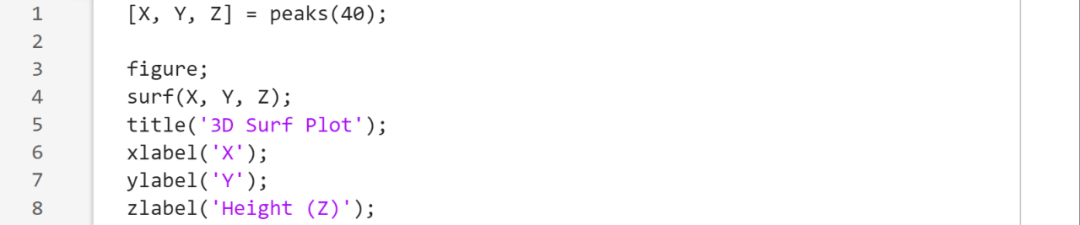
(2) Sample code and images
2. mesh function
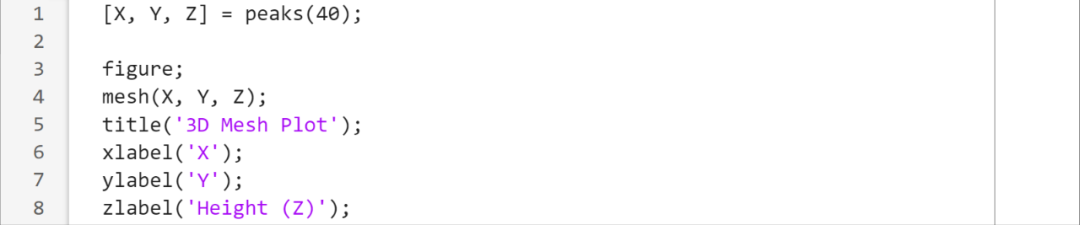
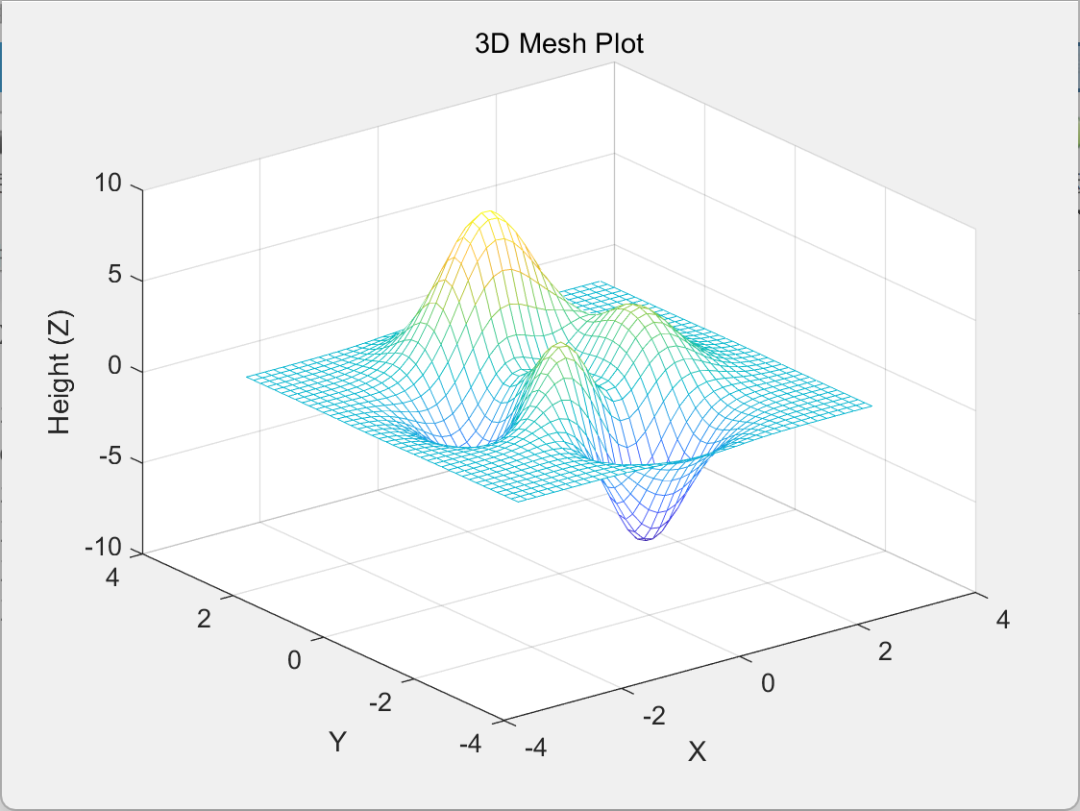
(1) Introduction to mesh function
The mesh function draws a 3D wireframe surface, displaying only the mesh lines without color fill. It’s suitable for demonstrating the structure and contours of a surface. It’s typically used in conjunction with a height matrix Z and its corresponding X and Y coordinate grids. Key features include: rendering only the mesh lines without fill color; height information is presented as a wireframe; and high rendering efficiency, making it suitable for visualizing overall shapes.
(2) Sample code and images
3. meshc function
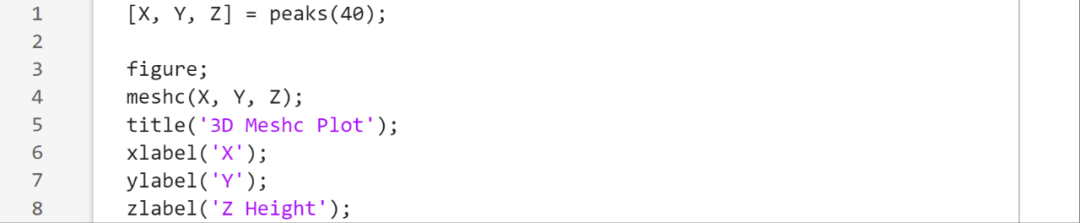
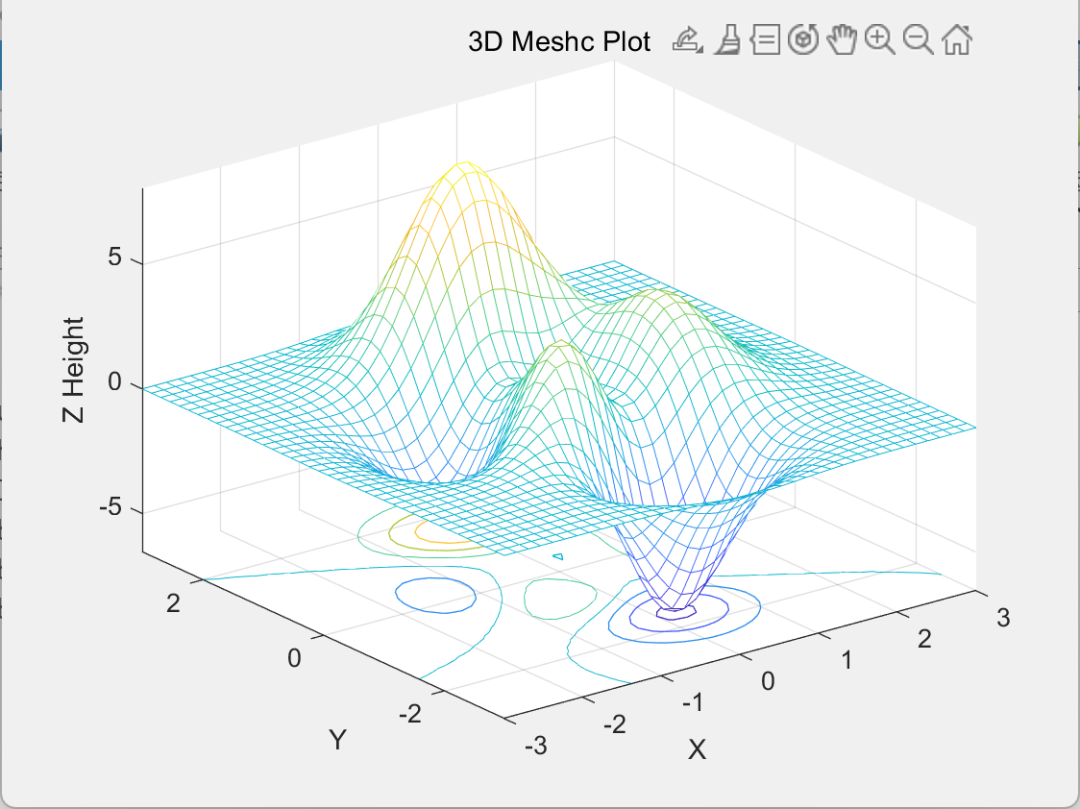
(1) Introduction to meshc function
The meshc function draws a 3D wireframe surface, similar to the mesh function, and overlays a contour plot on the bottom plane, allowing you to simultaneously view the surface’s morphology and height distribution. Key features include: displaying the wireframe surface; drawing contour lines on the bottom plane with different colors for different heights; and presenting height information using both the wireframe and the contour lines.
(2) Sample code and images
4. surfc function
(1) Introduction to surfc function
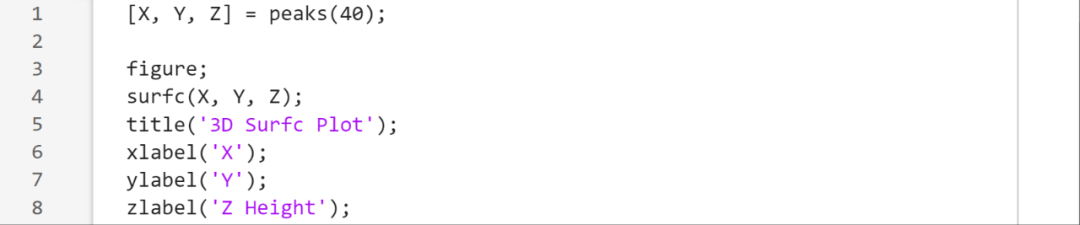
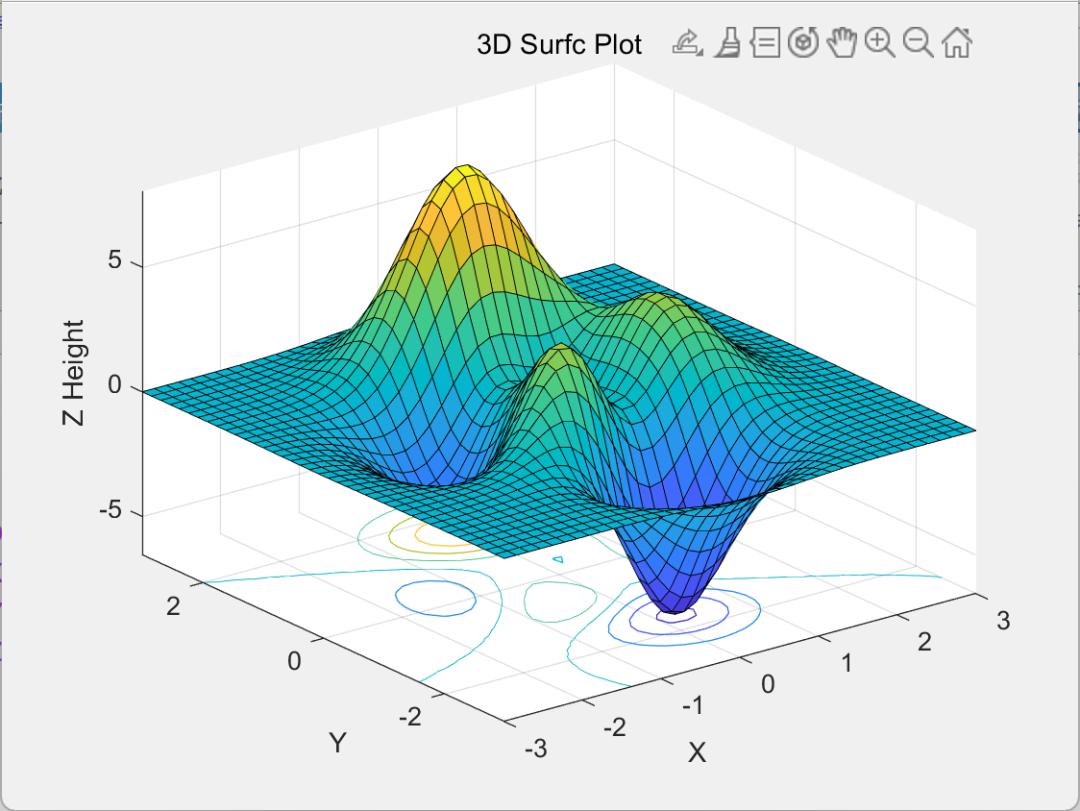
The surfc function plots a three-dimensional surface with a color fill, similar to the surf function. It also overlays a contour plot on the bottom plane, making the height distribution more intuitive. Its main features include displaying a colored surface, drawing contour lines on the bottom plane, and expressing height information through color, surface shape, and contour lines.
(2) Sample code and images
5. contour3 function
(1) Introduction to contour3 function
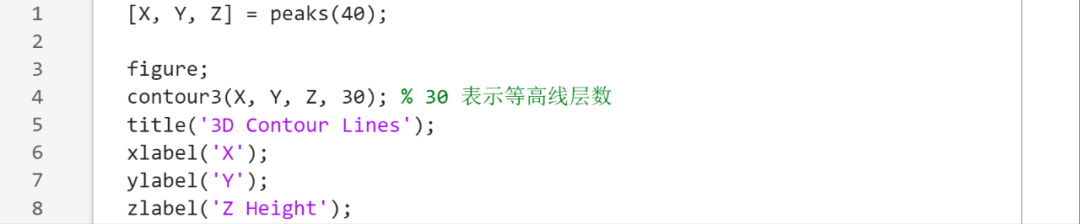
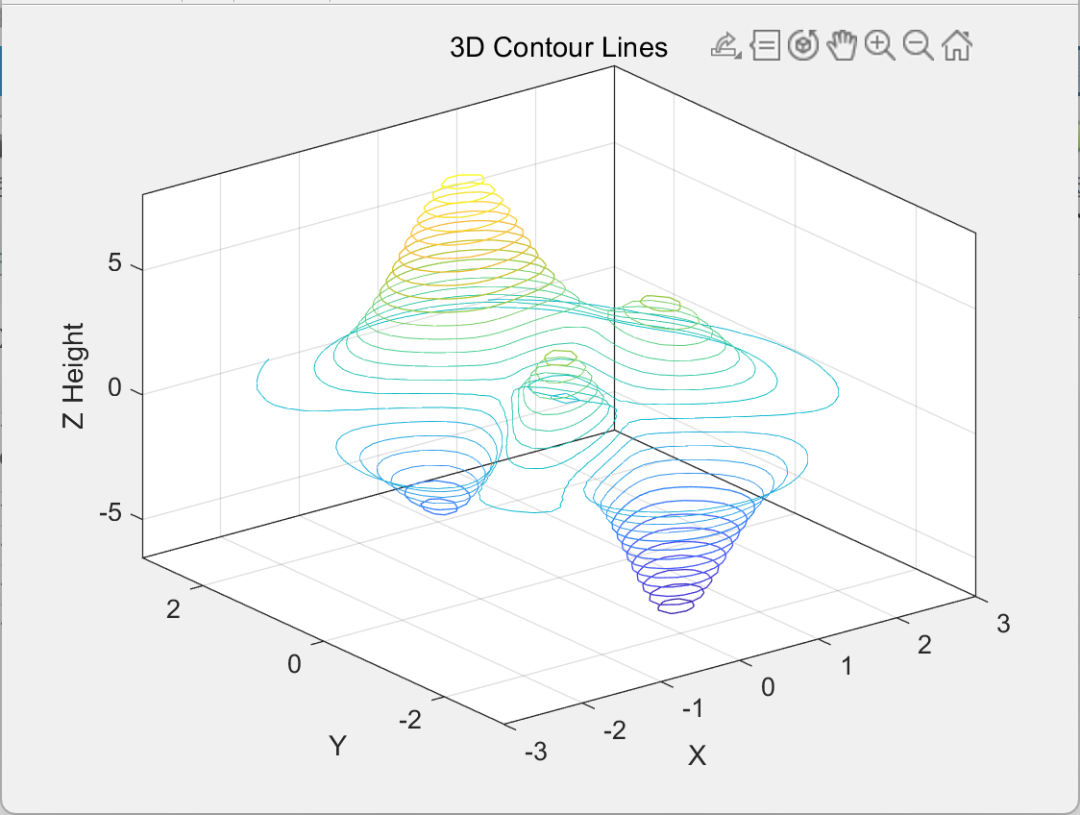
The contour3 function creates a 3D contour plot, displaying contour lines of varying heights as curves in 3D space. Unlike contour, contour3 suspends contour lines at their corresponding Z heights rather than projecting them onto the base plane. Its key features include: contour lines are presented as 3D lines; their heights are determined by their Z values; and it’s suitable for simultaneously observing contour line shape and height variations.
(2) Sample code and images
6. fsurf function
(1) Introduction to fsurf function
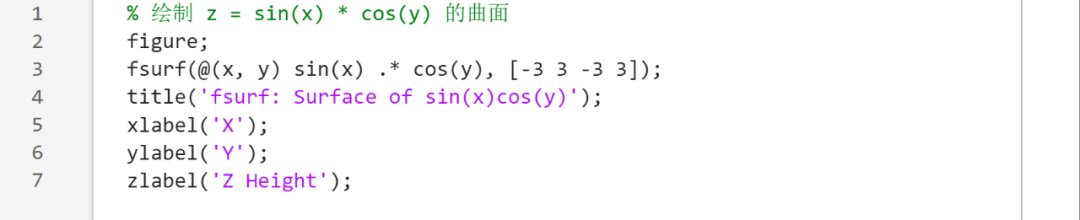
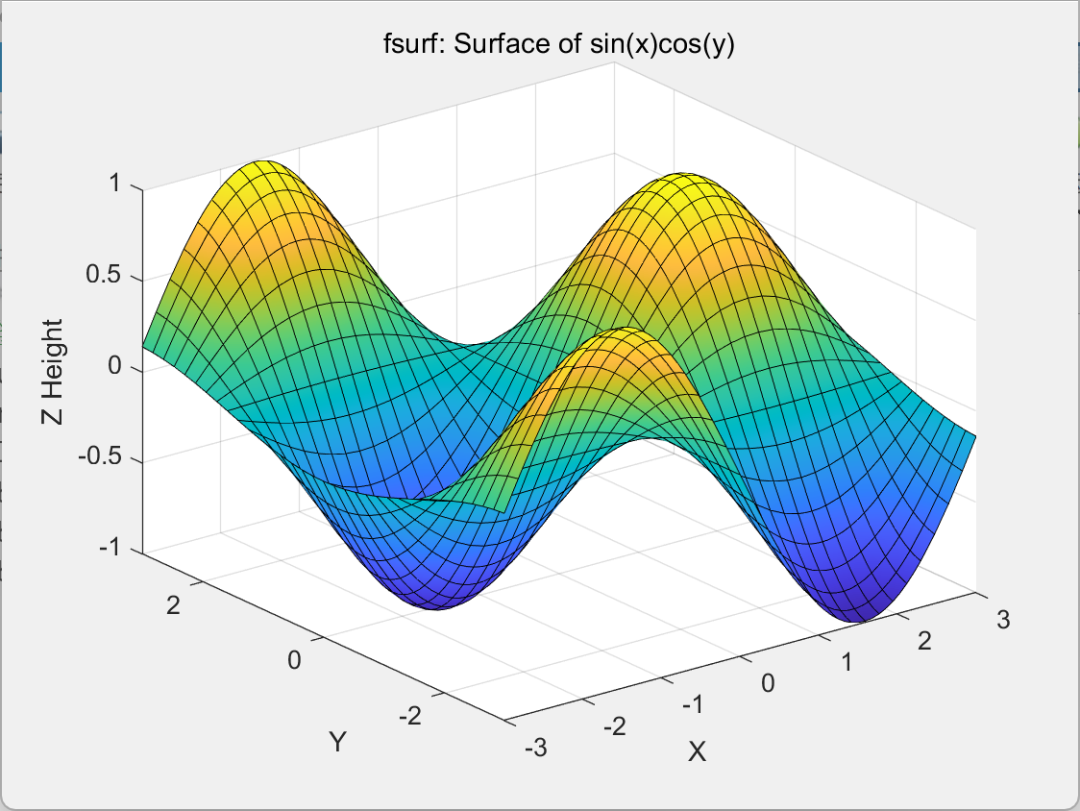
The fsurf function directly plots a three-dimensional surface of a function, eliminating the need to manually create X and Y grid data. It automatically samples the given function and generates a smooth three-dimensional surface. Key features include the ability to directly pass in a function handle for plotting, eliminating the need for manual grid generation; support for custom plotting ranges; and smooth, detailed surfaces, ideal for visualizing functions.
(2) Sample code and images
7. waterfall function
(1) Introduction to waterfall function
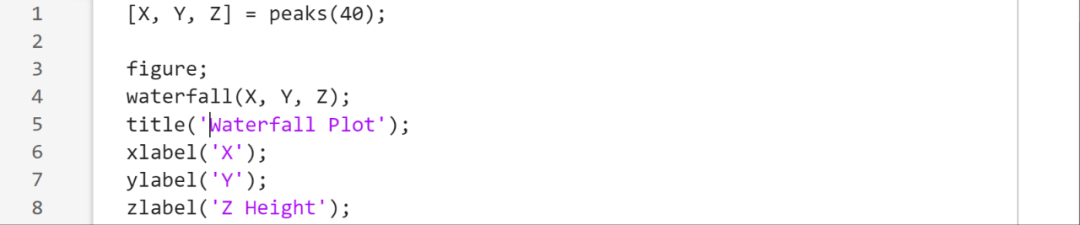
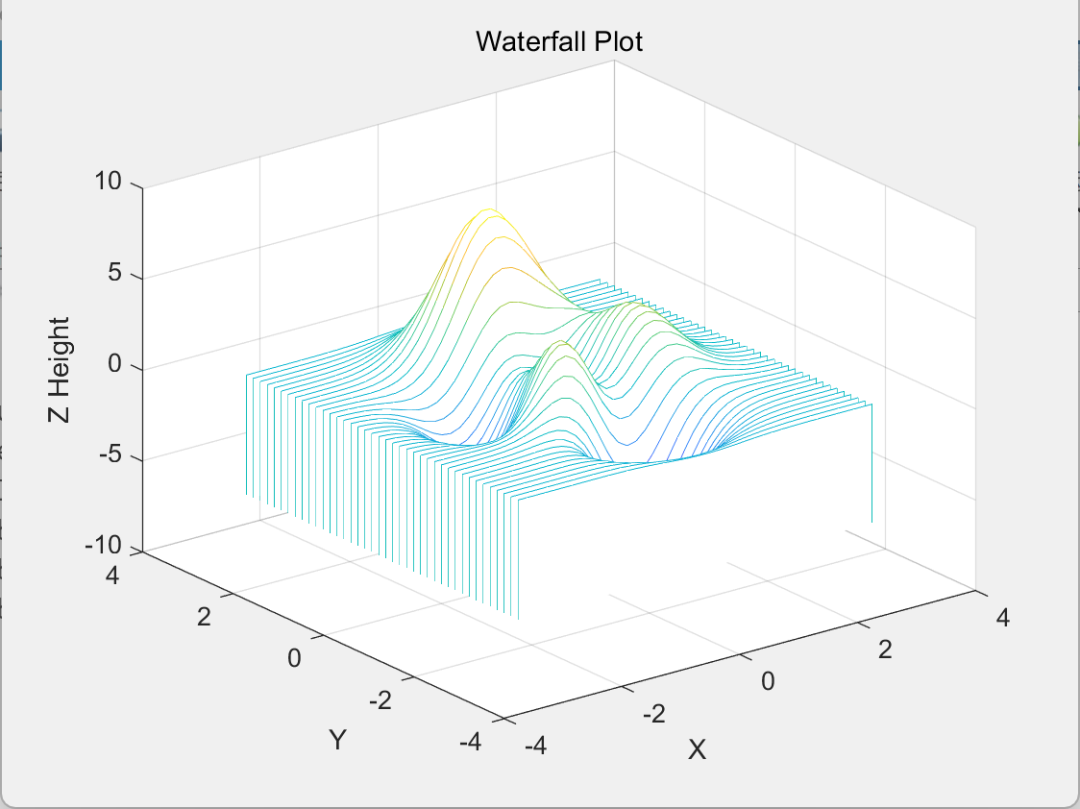
The waterfall function creates a graph similar to a mesh, but retains only lines in a single direction, creating a waterfall-like effect. It’s often used to visualize time series or segmented data. Its key features include: a form similar to a wireframe graph, but displaying only a subset of lines; a column-by-column waterfall-like presentation of data; and its suitability for depicting dynamically changing or segmented data.
(2) Sample code and images
That’s all for today’s sharing.
If you have a unique idea about the article,
please leave us a message,
and let us meet tomorrow.
I wish you a nice day!
Translation:
Google Translate
References: Baidu, CSDN Community, ChatGPT, MATLAB Official Website
This article is organized and published by LearningYard. If there is any infringement, please leave a message in the background!
Copywriting|chen
Typesetting|chen
Review|hzy