
Rockchip Electronics Co., Ltd. was listed in 2020, with “Li Min” as the actual controller. The company’s main business is dedicated to the design, development, and sales of large-scale integrated circuits and application solutions, providing customers with complete reference solutions including chips and algorithms. The main products of the company are smart application processor chips, power management chips, and other chips and component products.
According to Rockchip’s 2024 annual financial report, the company achieved revenue of 3.136 billion yuan in 2024, a significant increase of 46.94% year-on-year. The net profit excluding non-recurring items was 538 million yuan, a substantial increase of 3.26 times year-on-year. The net profit for 2024 was 595 million yuan, with a year-on-year increase of 3.41 times.

Significant Growth in Integrated Circuit Revenue Drives Substantial Increase in Company Revenue
1. Composition of Main Business
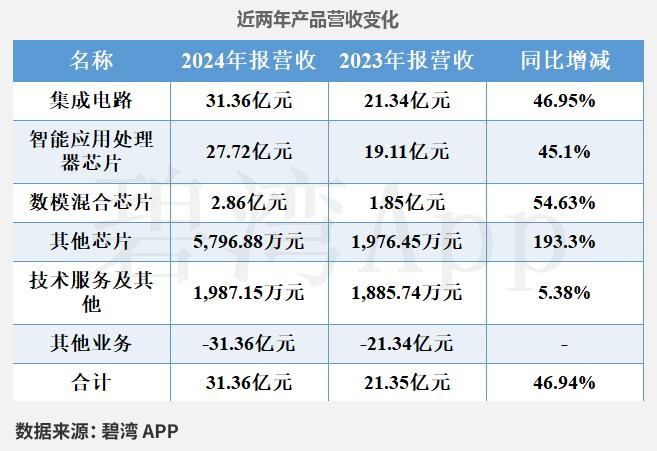
The company’s main business is integrated circuits, with smart application processor chips being the largest source of revenue, accounting for 88.40%.

2. Significant Growth in Integrated Circuit Revenue Drives Substantial Increase in Company Revenue
In 2024, the company achieved revenue of 3.136 billion yuan, a significant increase of 46.94% compared to 2.135 billion yuan in the same period last year.
The main reasons for the substantial revenue growth are:
(1) Integrated circuit revenue for this period was 3.136 billion yuan, compared to 2.134 billion yuan in the same period last year, a significant increase of 46.95% year-on-year.
(2) Revenue from smart application processor chips for this period was 2.772 billion yuan, compared to 1.911 billion yuan in the same period last year, a significant increase of 45.1% year-on-year.
3. Slight Increase in Integrated Circuit Gross Margin
It is worth mentioning that while the revenue of integrated circuits is increasing, the gross margin is also improving. The gross margin for integrated circuits in 2024 was 37.59%, a slight increase of 9.75% year-on-year.

4. Main Development in Domestic Market
In terms of sales model, the main channel for the company is domestic, accounting for 51.6% of main business revenue. In 2024, domestic revenue was 1.618 billion yuan, an increase of 63.06% compared to last year, with a gross margin of 36.79%, an increase of 3.67 percentage points year-on-year.

Significant Increase in Main Business Profit Drives Substantial Increase in Net Profit
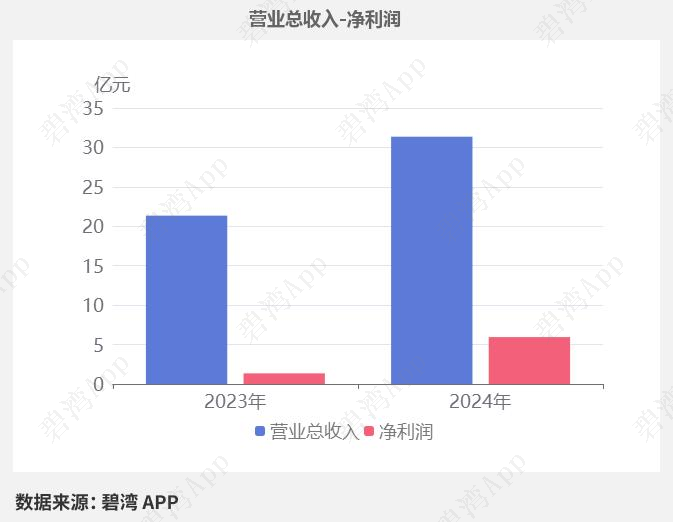
1. Total Operating Revenue Increased by 46.94% Year-on-Year, Net Profit Increased by 3.41 Times Year-on-Year
In 2024, Rockchip’s total operating revenue was 3.136 billion yuan, compared to 2.134 billion yuan in the same period last year, a significant increase of 46.94%. The net profit was 595 million yuan, compared to 135 million yuan in the same period last year, a substantial increase of 3.41 times.
The reasons for the substantial increase in net profit are:
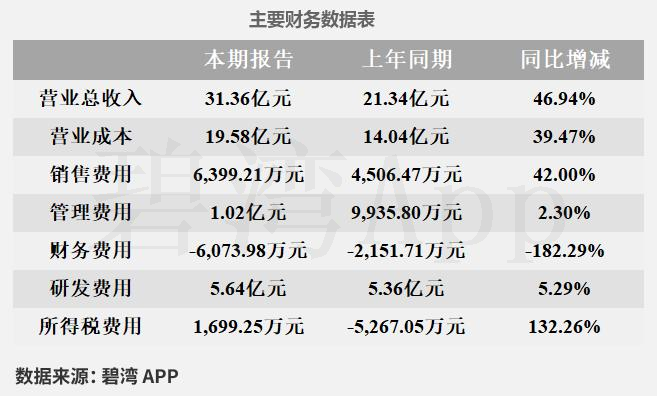
Although the income tax expense for this period was 16.9925 million yuan, a significant decrease from 52.6705 million yuan in the same period last year;
However, the main business profit for this period was 498 million yuan, compared to 66.3045 million yuan in the same period last year, a substantial increase year-on-year.
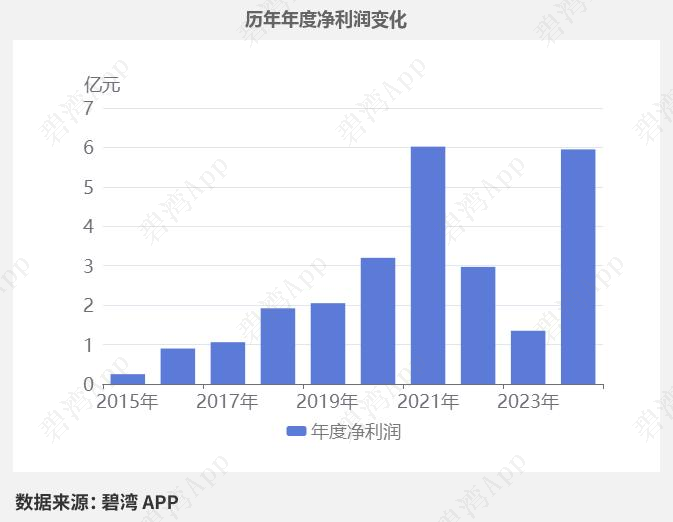
Net profit showed a downward trend from 2021 to 2023, decreasing from 602 million yuan to 135 million yuan, while from 2023 to 2024, it showed an upward trend, increasing from 135 million yuan to 595 million yuan.
2. Main Business Profit Increased by 6.51 Times Year-on-Year
In 2024, the main business profit was 498 million yuan, compared to 66.3045 million yuan in the same period last year, a substantial increase of 6.51 times year-on-year.
The significant increase in main business profit is mainly due to (1) total operating revenue for this period was 3.136 billion yuan, a significant increase of 46.94% year-on-year; (2) the gross margin for this period was 37.59%, a slight increase of 3.34% year-on-year.

3. Significant Increase in Financial Income
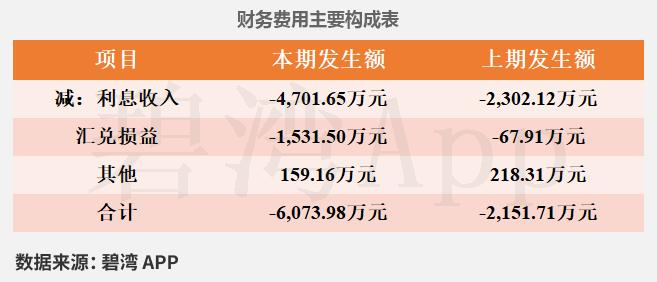
The financial expenses for this period were -60.7398 million yuan, indicating financial income, which increased significantly by 182.29% compared to the previous period. It is worth mentioning that the financial income for this period accounted for 10.21% of net profit. The important reasons are:
(1) Interest income for this period was 47.0165 million yuan, compared to 23.0212 million yuan in the same period last year, a significant increase of 104.23% year-on-year.
(2) Exchange gains for this period were 15.3150 million yuan, compared to 679,100 yuan in the same period last year, a significant increase of nearly 22 times year-on-year.

Government Subsidies Contribute Significantly to Net Profit, Accounting for 12.88% of Net Profit
(1) The contribution of government subsidies to profit for this period was 76.6430 million yuan, of which the amount of government subsidies included in non-recurring gains and losses was 14.7984 million yuan.
(2) A total of 76.6430 million yuan in government subsidies was received this period, mainly distributed as shown in the table below:
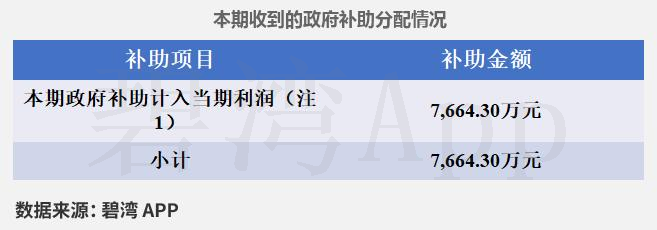
The main components of government subsidies are shown in the table below:

(3) The remaining balance of government subsidies for this period was 17.2305 million yuan, which will be retained for profit in future years.

Low Return on Financial Investments
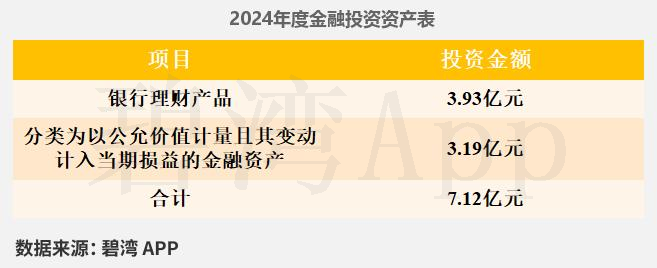
1. Financial Investments Account for 16.68% of Total Assets, Shift from Venture Capital to Wealth Management Investments
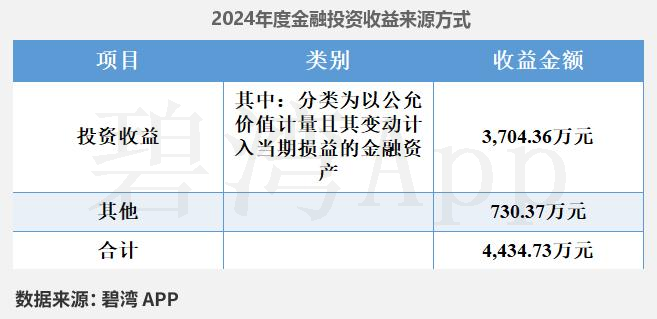
At the end of the 2024 reporting period, Rockchip had 712 million yuan in assets for financial investments. The contribution of financial investments to net profit was 44.3473 million yuan.
The main investment content for financial investments in 2024 is shown in the table below:
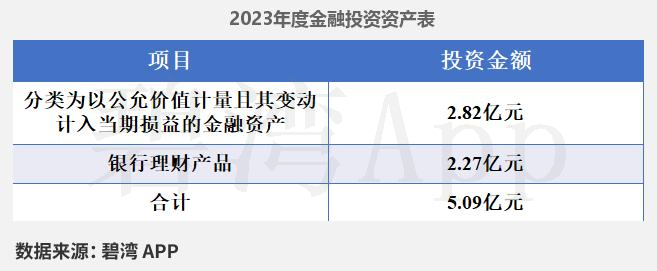
The main investment content for financial investments in 2023 is shown in the table below:
In terms of sources of financial investment income, it mainly comes from financial assets classified as measured at fair value with changes recognized in profit or loss for the period.
2. Financial Investment Assets Increase Year by Year
The company’s financial investment assets have continued to rise, increasing from 382 million yuan in 2022 to 712 million yuan in 2024, a change rate of 86.56%.


Significant Increase in Accounts Receivable Turnover Rate
In 2024, the company’s total accounts receivable was 287 million yuan, accounting for 6.72% of total assets, which was basically unchanged from 294 million yuan in the same period last year.
In this period, the accounts receivable turnover rate was 10.80. From 2023 to 2024, the accounts receivable turnover rate increased significantly from 7.45 to 10.80, and the average collection period decreased from 48 days to 33 days, significantly improving the company’s collection capability.
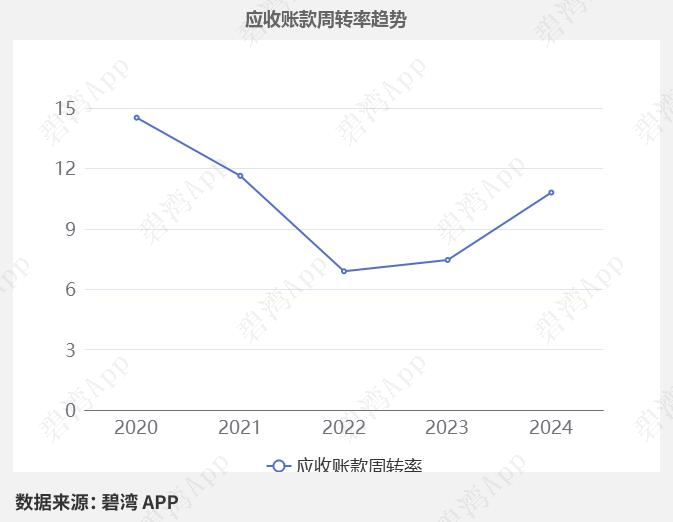
(Note: In 2020, bad debts of 597,000 yuan were provided, in 2021, bad debts of 1.5342 million yuan were provided, in 2022, bad debts of 1.07027 million yuan were provided, in 2023, bad debts of 2.65643 million yuan were provided, in 2024, bad debts of 157,200 yuan were provided.)

Significant Increase in Inventory Turnover Rate
In 2024, the company’s inventory turnover rate was 3.08, significantly increasing from 1.57 in 2023 to 3.08 in 2024, with inventory turnover days decreasing from 229 days to 116 days. In 2024, Rockchip’s total inventory balance was 784 million yuan, accounting for 20.16% of total assets, a significant decrease of 37.36% compared to 1.251 billion yuan last year.
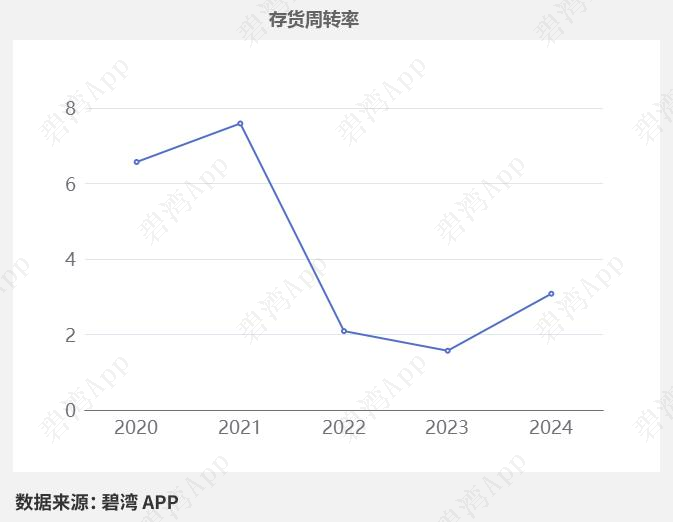
(Note: In 2020, inventory of 5.1039 million yuan was provided, in 2021, inventory of 3.0726 million yuan was provided, in 2022, inventory of 10.7027 million yuan was provided, in 2023, inventory of 26.5643 million yuan was provided, in 2024, inventory of 24.81 million yuan was provided.)

Industry Analysis
1. Industry Development Trends
Rockchip belongs to the system-on-chip (SoC) segment of the integrated circuit design industry. In the past three years, the global Internet of Things (IoT) connection compound annual growth rate reached 16%. By 2025, the demand for edge computing will surge, driving SoC chips towards high performance and low power consumption iterations. AIoT will empower various industries, pushing the market space to exceed 100 billion USD, with emerging scenarios such as automotive electronics and AR/VR continuously releasing incremental growth. It is expected that the industry will maintain an annual growth rate of 12%-15% over the next three years.
2. Market Position and Share
Rockchip is a leading SoC design company in China, with leading technology in AIoT edge computing chips. Its flagship product, the RK3588 platform, fills the gap in domestic high-performance SoCs, holding a leading market share in niche markets such as smart security and automotive cockpit. By 2025, its core customer base will include top smart hardware manufacturers.
3. Major Competitors
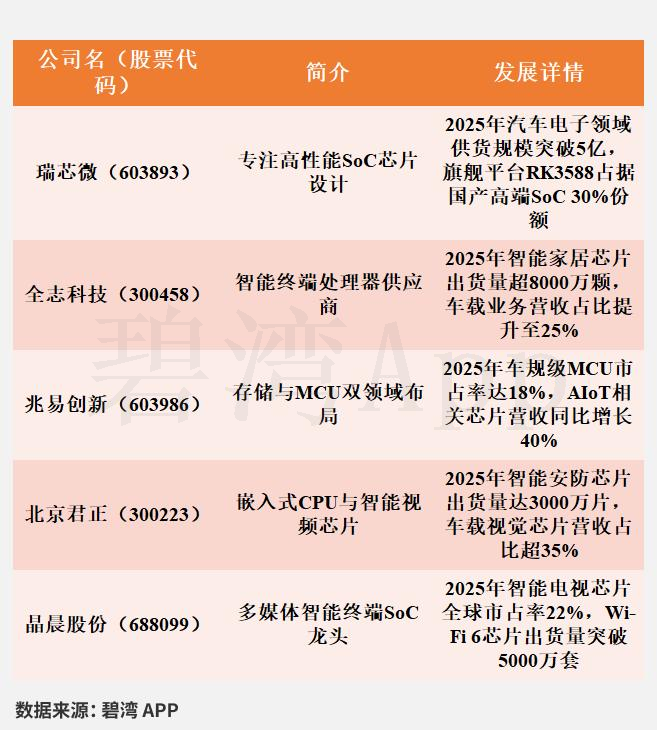

Conclusion
1. Summary of Operational Analysis
The company’s profitability is excellent. From 2021 to 2023, the company’s net profit continued to decline, but in 2024, the net profit reached 595 million yuan, a significant increase compared to the previous period.
From 2021 to 2023, the company’s main profit continued to decline. However, due to the simultaneous growth of revenue and gross margin, the main profit in 2024 was 498 million yuan, a significant increase compared to the same period last year.
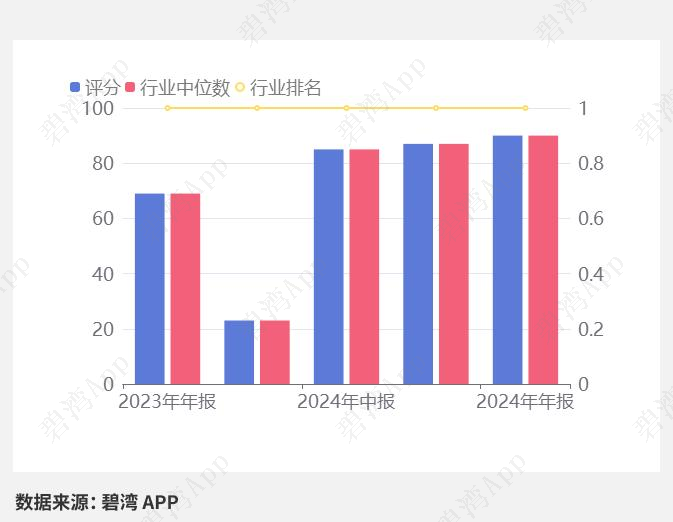
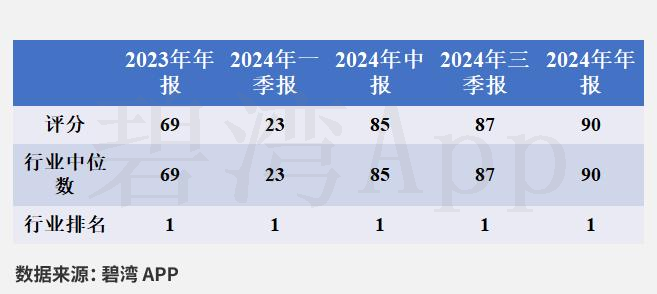
2. Operational Rating and Ranking
Operational Rating: 90 Overall Ranking: 84/5468
Industry Ranking (Multimedia Chips): 1/1
3. Valuation Data
In the past five years, the PE-TTM (as of May 23, 2025) has been at a relatively low level historically.
As of May 23, 2025, Rockchip’s PE-TTM was 84.31, while the PE-TTM for the digital chip design industry was 86.45, indicating that Rockchip is below the industry average.
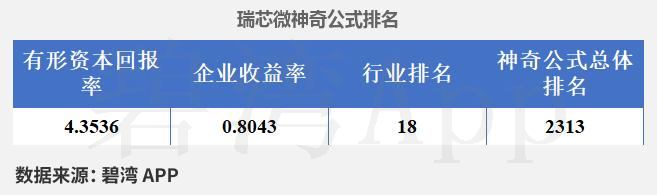
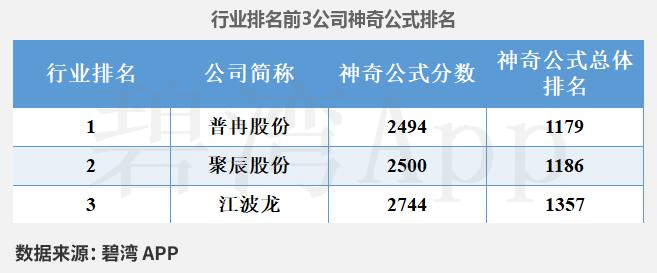
4. Magic Formula Valuation Ranking
The Magic Formula is an investment strategy proposed by investor Joel Greenblatt. He achieved a 30% annual return over 20 years using this strategy. The core idea is to buy good companies at cheap prices.
1) Use Return on Invested Capital (ROIC) to measure company performance. ROIC = EBIT / (Total Assets – Intangible Assets)

2) Use Enterprise Yield to measure price. Enterprise Yield = EBIT / (Total Market Value + Net Debt).

3) Rank both in descending order; the lower the score, the higher the cost-performance ratio.
#Rockchip #603893 #2024AnnualReport
Disclaimer: The information in this article is based on publicly available data and is for reference only. Biwan strives for accuracy but does not guarantee correctness, nor does it constitute investment advice. Please make prudent decisions.
Long press or scan the QR code below to add the corporate WeChat for consultation.

 END
END
 If you like the article, please like, share, save, and view.