
Electrochemical Impedance Spectroscopy (EIS) is a widely used, simple, practical, and non-destructive technique in battery analysis. However, traditional analytical techniques can only provide an overall performance of all electrochemical processes within the battery, and much useful information remains vague or difficult to obtain. This poses a major challenge when analyzing complex chemical systems using EIS, such as lithium-sulfur (Li-S) batteries. This work demonstrates the application of relaxation time distribution (DRT) analysis for quantitative unwrapping of EIS spectra, revealing contributions to the overall battery polarization from (8) different electrode processes. The DRT distribution is strongly dependent on the charge-discharge state of the battery, providing a pathway for automated and onboard analysis of Li-S batteries.
Due to the high theoretical capacity of sulfur as a cathode material (1675mAh/g), low cost, and low toxicity, lithium-sulfur (Li-S) batteries have become one of the most promising “beyond lithium-ion” technologies. Although capacities close to the theoretical value have been achieved in the initial cycles, rapid capacity decay and poor rate performance are significant bottlenecks hindering widespread commercialization.A typical Li-S battery typically consists of a lithium anode and a carbon-loaded sulfur composite cathode, undergoing many complex battery reactions during operation. During discharge, elemental sulfur is converted to Li2S, forming a series of different intermediate polysulfides (PS), including Li2S8, Li2S6, Li2S4, Li2S2, whereas during charging, the reverse occurs.Many of the PS are soluble, meaning that components formed at the S cathode are transported to the Li anode during cycling, where they can be reduced back to Li2S or to shorter soluble chain-like PS, which can return to the S electrode for further reduction (during discharge) or oxidation (during charging). This “shuttling” of PS leads to the loss of active sulfur and capacity decay during cycling. The complexity of these chemical reactions makes non-destructive diagnostics of battery processes and performance a highly challenging task. Careful analysis of these battery processes during operation is crucial for solving performance-limiting steps.In-situ analysis of the battery under different states of charge (SoC) can provide a wealth of information about the processes driving degradation and failure, thus facilitating battery stability and extending cycle life. Among the existing in-situ techniques, electrochemical impedance spectroscopy (EIS) is a powerful tool due to its non-destructive nature and ability to provide real-time information about electrode processes under normal operating conditions.EIS has been widely used to study Li-S batteries, with factors such as battery SoC, temperature, and health state shown to affect the obtained spectral results. Early studies by Cañas et al. proposed an equivalent circuit model (ECM) for quantifying different electrochemical processes in their batteries at different SoCs. They attributed the high-frequency semicircle (real part vs. imaginary part of complex impedance) of their Nyquist plot to the charge transfer reaction of the negative electrode, while attributing the mid-frequency semicircle to the positive electrode reaction, primarily the charge transfer reaction of sulfur intermediates and the formation and dissolution of S8 and Li2S. However, other studies conducted at the same time reached different conclusions. For instance, Deng et al. also measured EIS at different SoCs and temperature dependencies, attributing the mid-frequency semicircle to charge transfer processes and their relative capacitance, while attributing the high-frequency semicircle to interfacial contact resistance at the sulfur electrode. Cañas et al. attributed these features to the generation and dissolution of S8 and Li2S or the charge transfer of sulfur intermediates and anodic interfacial charge transfer. Similarly, Yan et al. utilized EIS to study capacity decay in Li-S batteries and compared the effects of electrolyte-to-sulfur ratios. The semicircle in the high-frequency region was attributed to charge transfer processes at the carbon (cathode) interface, while the semicircle in the mid-frequency region was related to the formation of solid-state Li2S2/Li2S films. Recently, Kilic and Eroglu studied the impact of battery design on the EIS of Li-S batteries, observing two semicircles and a diffusion feature in their analysis, attributing it purely to the positive electrode reaction. Despite the inconsistencies in interpretations, these studies indeed highlight the enormous potential of EIS in non-destructively diagnosing processes in operating Li-S batteries.The EIS spectrum is a global representation of the relaxation processes occurring in the system under consideration. Unfortunately, traditional EIS analysis, i.e., equivalent circuit modeling, often fails to resolve or differentiate overlapping relaxation processes occurring within overlapping frequency ranges. Battery studies using EIS typically employ complex nonlinear least squares (CNLS) circuit fitting, a method that is largely based on intuition and characteristics of impedance data, easily missing overlapping processes or processes occurring near time constants. For complex systems like Li-S batteries, analysis becomes even more challenging due to the multiple reactions occurring at both electrodes, leading to the formation of different products. Another approach is to transform frequency-dependent EIS data into the time domain, also known as relaxation time distribution (DRT).In DRT analysis, EIS spectra are fitted to an infinite Voight circuit (a series of parallel RQ elements, where R is a resistor and Q is a constant phase element), where each RQ element represents a time constant {τ = (RQ)1/α, where τ is the time constant and α is a number between 0 and 1.}Thus, DRT analysis can decompose overlapping relaxation processes into a series of local maxima, where each maximum represents one electrochemical process. This allows for the resolution of subtle changes in EIS data. Peak area, position, and height can provide quantitative information about reaction kinetics and performance-limiting processes.DRT was initially applied to the impedance data analysis of solid electrolytes by Franklin and De Bruin, and has gained increasing popularity in device research over the past 20 years, successfully applied to solid oxide fuel cells, polymer electrolyte membrane fuel cells, and lithium-ion batteries, revealing internal phenomena during operation. A few studies have previously utilized DRT to decompose selected EIS data from Li-S batteries to provide insights into factors such as capacity decay processes, the impact of electrode microstructure on performance, or the kinetics of interfacial processes. Unfortunately, these studies often relied on symmetric C||C or CS||CS systems, or primarily focused on the contributions of PS, neglecting other important components in Li-S batteries. When testing full batteries, the distribution of DRT features was mainly achieved by using literature data or predicted time constants, rather than empirical experiments using equivalent batteries or electrodes, leading to many known Li-S battery processes being unable to be associated with DRT features.Figure 1a shows EIS data recorded after formation cycling of a Li-S battery with an E/S ratio of 5 in a fully charged (100% SoC) state, presented in the form of a Nyquist plot. Two semicircles can be observed, one in the high-frequency region, one in the mid-frequency region, and a diffusion line in the low-frequency region. Similar features have also been observed in previous studies.However, as discussed above, the assignment of these two semicircles to specific battery processes is controversial. Many literature reports assign the high-frequency semicircle to the negative electrode reaction and the mid-frequency semicircle to the positive electrode reaction, while other studies assign both semicircles to the positive electrode reaction. 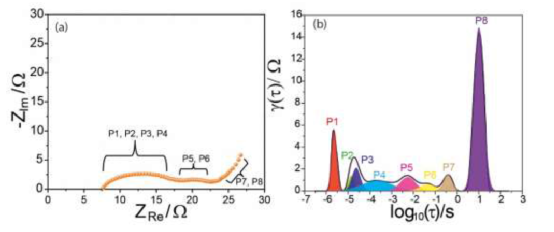 Figure 1. (a) Nyquist plot of LiS-5 recorded at 100% SoC and (b) DRT plot of the impedance data shown in (a).Figure 1b shows the DRT plot derived from the data in Figure 1a, featuring 8 local maxima, each representing a contribution of a battery process to the total polarization resistance of the battery. The time constant (τ) is characteristic of each polarization process, and the area under the peak indicates the contribution of a specific reaction to the total battery polarization resistance.Thus, the changes in the DRT curve can directly indicate variations in the nature and magnitude of electrode reactions.Each of the 8 peaks (P1-P8) has a characteristic time constant. Peaks P1, P2, P3, and P4 at 2.28, 14.14, 23.6, and 217 µs, respectively, represent the polarization processes constituting the high-frequency semicircle; while P5 and P6 with time constants of 5.51 and 47.5 ms represent reactions identified in the mid-frequency semicircle; finally, P7 and P8 in the low-frequency region at 0.384 and 10.12 s represent diffusion processes. Interestingly, two peaks are observed in the diffusion region, indicating the presence of two distinct ionic diffusion processes, a phenomenon previously unobserved in Li-S batteries. Although Danzer observed multiple diffusion-related peaks in commercial Li-ion batteries, they were assigned to a single process (solid-state diffusion), in this analysis of Li-S batteries, the two peaks in the diffusion region were found to represent different processes.To clarify the origins of P1–8, their behaviors were monitored at different SoCs. The battery was discharged to specific voltages representing different known battery reactions and rested to perform EIS measurements after reaching steady state. This process was repeated until the battery was fully discharged. Figure 2 shows the results of DRT analysis of these data. To identify peaks with negative or positive impedance contributions, complementary measurements were performed on symmetric S||S batteries and Li||Li batteries (DRT plots 3a, b), C paper||C paper batteries with PS (Li2S4 and Li2S6) dissolved in the electrolyte, and Cu||Li2S batteries.In a brand-new battery (at 100% SoC, without any formation process), sulfur is the only component present in the cathode, and the electrolyte is expected to be close to the initial formulation, without the formation of a solid electrolyte interface | cathode/electrolyte interface. Therefore, the appearance of the DRT spectrum is relatively simple (Figure 2a), characteristic of the blocking behavior of sulfur electrodes previously reported. It is noteworthy that in Figure 2, the “F” prefix is used because the time constants of the peaks are in transition and have not stabilized to their “P” positions. This is because the electrode/electrolyte interface and electrode structure, as well as the capacitance and resistance of the battery, undergo significant changes during its first (i.e., formation) cycle.Once discharge begins, the DRT becomes very complex, as at 2.3V, sulfur is reduced to higher-order PS, such as Li2S8 and Li2S6, which may participate in a series of battery processes. At this SoC, changes in the cathode structure also occur, resulting in new pore structures and the loss of blocking behavior of the electrode. The impact of this can be observed from the polarization resistance related to ionic diffusion processes (F8 at 7.05 s), which drops significantly from 162Ω at 100% SoC to 3.70Ω at 2.30V (Figure 2b). Upon further discharging to 2.13V (Figure 2c), an increase in overall polarization resistance is observed, which may be associated with the known increase in electrolyte viscosity at this potential, as more PS form and dissolve in the electrolyte.By 2.03V, processes including PS precipitation within the cathode and the formation of Li2S2 layers have been observed, although any changes in the DRT here are relatively subtle (Figure 2d). However, by 1.95V, a major change occurs in the region where an electron-insulating (≈10-9 S cm-1) and low ionic conductivity (10-13 S cm-1) Li2S forms from Li2S2. The increase of peaks F5 and F8 and the decrease of peak F3 are observed. At full discharge (1.8V, Figure 2f), most PS are reduced to Li2S, where the amplitudes of F5 and F8 increase, while the second diffusion peak P7 also increases.Although the data is complex, the DRT spectra shown in Figures 2 and 3 allow us to temporarily assign each peak from P1 to P8 (Figure 1b) to a specific battery process, based on the correlation of time constants between peaks, and knowledge of dominant processes at certain potentials based on previous studies and control experiments. The following will argue this assignment.The polarization resistance of P1 exhibits rapid relaxation times and varies synchronously with the equivalent series resistance (ESR) of the battery, representing the total ohmic resistance, where contributions from ionic resistance from the electrode and electronic resistance are present during discharge. Thus, it can be preliminarily classified as particle-to-particle/distributed ohmic resistance generated by the interaction of ionic resistance in the electrolyte and electronic resistance in the porous electrode, exhibiting frequency dispersion due to the non-uniformity of particle size and their distribution in the porous electrode.In a newly prepared battery, no peaks close to P2 can be discerned (Figure 2a); only when the battery drops below 2.03V (Figure 2d) does the contribution from this region become significant, where processes including PS precipitation within the cathode and formation of Li2S2 layers are known to occur. However, there is still a significant contribution at lower potentials (Figure 2d, e), and it appears even in the formation of the battery at 100% SoC (Figure 1b). A similar peak appears at the same time constant (29.97 µs) in the DRT of S.
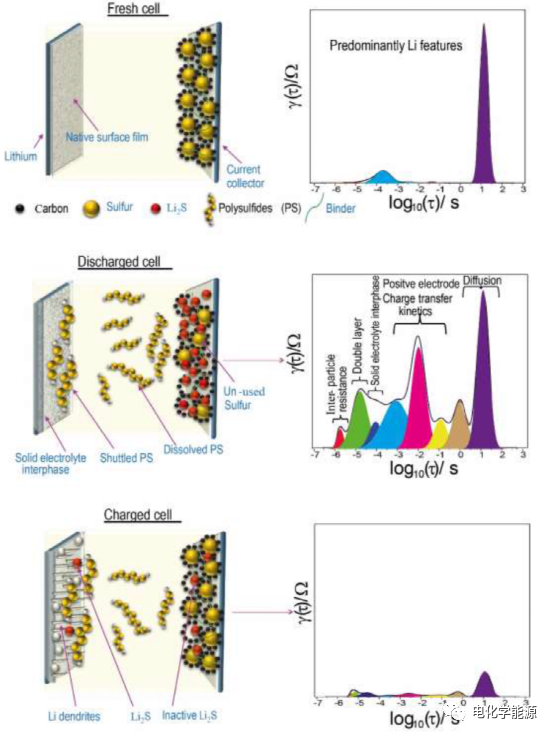 Figure 4. Schematic illustration of the changes in Li-S batteries during charge and discharge processes and the evolution of corresponding DRT features.Features observed in fresh batteries (Figure 2a) and symmetric Li||Li batteries (Figure 3a) indicate the origin of P3. The DRT curves of both batteries are remarkably similar, showing a large peak close to 250 µs, indicating that the EIS response of the fresh Li||S battery is dominated by the Li anode; the Nyquist plots of fresh batteries (Figure 1b) and Li symmetric batteries (Figure 2b) also display similar characteristics in the charge transfer region, consisting of a broad semicircle. Previous studies have identified lithium ion migration as the rate-determining step for metallic lithium anodes, while charge transfer and diffusion processes can be neglected, suggesting that P3 may be closely related to lithium ion migration. The presence of PSs also affects the migration and diffusion characteristics of lithium ions at the anode, as evidenced by the increase in peak area and distribution time constants in Li||Li batteries with Li2S6 injected into the electrolyte. Interestingly, once the Li-S battery begins to discharge, the DRT curve changes rapidly; after 2.30V (Figure 2b), the pseudo-peak F3′ overlaps with F3, forming a single peak with a significantly reduced total area. This indicates that a barrier must be overcome at the lithium anode during the formation of the battery.P4‘s nature is more ambiguous than the other peaks, partly because it appears as a broad and low contribution in the formed unit, centered between 10-3 and 10-4 s. In Figure 1b, its time constant is close to 220 µs. No peaks close to this time constant appear in newly prepared batteries (Figure 2a) or Li||Li batteries (Figure 3a); it is now known that the negative electrode contribution is dominant, but small features close to this value do appear in S||S batteries (Figure 2b 276 µs) and PS electrolyte C||C batteries (Figure 3c,d), inferred to be related to processes based on S, hence the polarization of the positive electrode.In the Li-S battery, only a very small feature appears in this region (Figure 2a), but as the battery discharges, the peak in this region (F5) becomes significantly more prominent (Figure 2b-f). The time constant of P5 is 5.51 ms, close to F5’s 8.68 ms (Figure 2f, 0% SoC), where maximum Rp is reached, indicating the completion of insulating Li2S deposition. This suggests that P5 is related to charge transfer at the positive electrode, as it is known that Li2S hinders this process. In Figure 3b, the S4 peak occurs at a similar τ value (2.06 ms), but with a very small Rp, which would be expected since carbon and sulfur form intimate composites in that electrode, increasing its conductivity.One feature of all symmetric batteries containing PSs (Figure 3b-d) is a strong feature close to 50 ms. This same feature also appears during the formation of the fresh battery (Figure 2), but the contribution in this region only becomes significant when dropping below 2.13V, where the positive electrode and electrolyte are flooded with PSs. The peak P6 eventually stabilizes in this region, known to be related to charge transfer reactions, so this contribution may be associated with the charge transfer of PSs.As previously pointed out, at 100% SoC, the DRT curve of the post-formation battery exhibits two unusual peaks in the diffusion region, P7 and P8 (Figure 1b). In the newly prepared battery, no features appear in the P7 region, with a reaction only occurring at 0.76 s (F7) during discharge at 2.3V or below (Figure 2b), where PS is present. During the remaining discharge time, a peak appears in this region (Figure 2c-f). The DRT of the symmetric C||C paper battery with injected PS (Figure 3d,e) also shows a peak at a similar τ (Li2S6 at 0.46 s), indicating this peak is related to PS diffusion in the positive electrode diffusion layer. Interestingly, at 2.3V (Figure 2b), the diffusion characteristics of the fresh battery are similar to those in the original Cu||Li2S battery. Cu||Li2S batteries also show two peaks in the diffusion region at τ values of 1.12 s and 12.23 s, similar to the C||C battery with injected PS. These observations further support the assertion that P7 is most likely related to PS diffusion.Conversely, in the newly prepared battery, a very pronounced peak appears in the region associated with P8, indicating its relation to bulk ionic diffusion (Figure 2a). This is supported by the fact that at 2.3V, the polarization resistance of this ionic diffusion peak (7.05 s in Figure 2a) drops from 162 to 3.70Ω, as at this potential, sulfur dissolves (sulfur has low ionic conductivity) and PS formation leads to structural changes in the positive electrode, improving the mobility of lithium ions throughout the electrode. It is then observed that after the initial drop, the diffusion resistance increases with further discharge, possibly due to the deposition of poorly conducting Li2S (Figure 2c-f).These results indicate that during charge and discharge processes, irreversible changes in electrode structure and battery performance occur, likely related to the gradual deposition of Li2S and the reduction of PS at the anode.Figure 1. Summary of DRT peaks calculated for the Li-S battery at 100% SoC
| DRT Peak | Approximate Time Constant, τ | Attribution |
| P1 | 3 µs | Inter-particle Resistance |
| P2 | 14.14–28.4 µs | Double Layer Relaxation |
| P3 | 44.88 µs | SEI |
| P4 | 0.3 ms | Positive Electrode Charge Transfer |
| P5 | 5 ms | Positive Electrode Charge Transfer |
| P6 | 50 ms | Positive Electrode Charge Transfer |
| P7 | 0.4 s | Polysulfide Diffusion |
| P8 | 10 s | Diffusion |
Table 1 summarizes the distribution of P1-P8, while Figure 4 schematically summarizes the chemical changes occurring in the Li-S battery from 100% SoC (new battery) to 0% SoC and back to 0% SoC.By understanding these key polarizations, it is possible to dynamically diagnose the processes occurring within Li-S batteries. The power of this technique is demonstrated below, showing the impact of the electrolyte: the effect of sulfur loading on battery performance.DRT Analysis of Li-S Batteries Under Lean and Flooded Electrolyte Conditions To realize the potential of Li-S batteries, their performance must be optimized under lean electrolyte conditions, where volumetric and weight energy densities are maximized. Therefore, understanding the performance-limiting steps of low electrolyte capacity batteries is crucial for the commercial advancement of Li-S batteries. To this end, in-situ EIS measurements were conducted on batteries under lean electrolyte (LiS-5, 5µlelectrolyte/mgsulfur) and flooded electrolyte (LiS-15, 15µlelectrolyte/mgsulfur) conditions.Figure 5a displays the charge-discharge curves of the batteries measured at C/20 after formation; the battery using lean electrolyte exhibited a capacity of approximately ≈273 mAh g-1, which is only 60% of the capacity obtained by the flooded electrolyte battery (≈445 mAh g-1). The larger capacity indicates a higher utilization of sulfur and is consistent with the increased electrolyte dissolving more PS, i.e., forming a greater cathode electrolyte phase.Figure 5b shows the Nyquist plots of the two batteries recorded at 100% SoC. The LiS-5 battery shows an ESR of 7.67Ω, about twice that of the flooded electrolyte battery (3.64Ω). This increased battery conductivity is also reflected in the charge-discharge curves of the LiS-15 battery, which displays higher discharge voltages and lower charge voltages (Ecell = E◦-IR, where E◦ is the standard electrode potential and R is ESR). Interestingly, both systems show significant differences in their Rct and diffusion curves, highlighting the impact of electrolyte content on charge transfer kinetics; the measured Rct value in the LiS-15 battery is lower than that in the LiS-5 battery. The impedance spectra of both batteries produce two semicircles: a large semicircle in the high-frequency region and a small semicircle in the mid-frequency region, followed by a diffusion line in the low-frequency region. However, these broad generalizations do not allow for the assessment of the impact on individual battery processes.Figures 5c and d provide the corresponding DRT plots for LiS-5 and LiS-15, where each battery’s 8 local maxima, characteristic of Li-S batteries, can be observed. Firstly, it is noteworthy that at 100% SoC (Figures 5c and d), the features observed here differ from those of the freshly prepared (pre-formation) battery at 100% SoC (Figure 2a), indicating that the PS and Li2S formed during discharge do not fully convert back to sulfur during charging.At the minimum τ (highest frequency), the P1 (inter-particle resistance) of LiS-5 (Rp=1.76Ω) is significantly larger than that of LiS-15 (Rp=0.926Ω) (higher Rp). It is also observed that the peak of LiS-15 has a slightly larger τ value (3.35 vs 2.28 µs), which can be interpreted as a result of larger electrolyte volume causing higher capacitance, increasing the surface area of the electrochemical interface (τ = RQ1/α). In fact, all polarizations of Rp in LiS-5 are significantly higher than in LiS-15, indicating that all processes in the electrolyte-reduced battery are relatively hindered, and the peaks in LiS-15 also show a slight trend towards higher τ, indicating slower relaxation.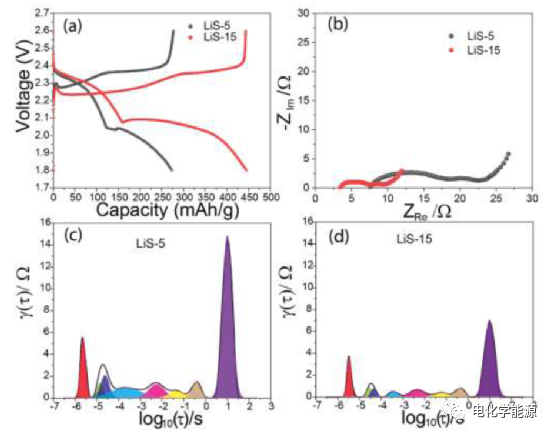 Figure 5a shows the charge-discharge curves of the batteries measured at C/20 after formation; the battery using lean electrolyte exhibited a capacity of approximately ≈273 mAh g-1, which is only 60% of the capacity obtained by the flooded electrolyte battery (≈445 mAh g-1). The larger capacity indicates a higher utilization of sulfur and is consistent with the increased electrolyte dissolving more PS, i.e., forming a greater cathode electrolyte phase.Overall differences noted in the post-formation 100% SoC batteries indicate differences in battery chemistry. The peak P2, identified as the double-layer relaxation of the positive electrode, shows the presence of more PS at the electrochemical interface of the flooded electrolyte battery. The saturation point of PS in LiS-15 is higher than that in LiS-5, thus reflecting higher PS concentrations in LiS-15, as indicated by the peak height and position of P2. P3, related to the polarization of the negative electrode, indicates that more resistive SEI may have formed in LiS-5. P4 highlights the polarization of sulfur in the positive electrode, indicating faster charge transfer kinetics in batteries with more electrolyte. The subsequent two peaks (P5 and P6) indicate the charge transfer kinetics of the positive electrode, showing lower polarization resistance for LiS-15 compared to LiS-5, characteristic of faster charge transfer in batteries with more electrolyte. In LiS-15, due to the high solubility of sulfur, more exposed carbon is present in the positive electrode, providing faster electrode kinetics. A similar trend can be observed in the diffusion resistance region (P7 and P8), where the polarization resistance of the flooded electrolyte battery is lower than that of the lean electrolyte battery. This trend can be rationalized as higher electrolyte capacity facilitates the movement of ions to the reaction centers, helping more sulfur and PSs to dissolve in the LiS-15 battery, thus generating more porosity in the positive electrode.The increase in anion concentration in LiS-5 will also lead to an increase in electrolyte viscosity (the impact of dissolved PSs on viscosity may be more pronounced under lean electrolyte conditions), increasing diffusion resistance.From the above observations, we see that changes in battery and electrode characteristics, such as resistance, electrochemical double layer, charge transfer kinetics, and mass transfer characteristics, can be directly analyzed by tracking changes in the position, height, and area of DRT peaks, making it a powerful diagnostic tool for LiS batteries.It is well known that Li-S batteries exhibit different electrode reactions at different SoCs, so it is necessary to reveal the impact of electrolyte volume throughout the entire battery cycle. EIS measurements of LiS-5 (Figure 6a) and LiS-15 (Figure 6b) batteries, recorded at 100, 80, 40, 20, and 0% SoC, provide Nyquist plots showing similar features at the same SoC, but with significant differences in their impedance values.
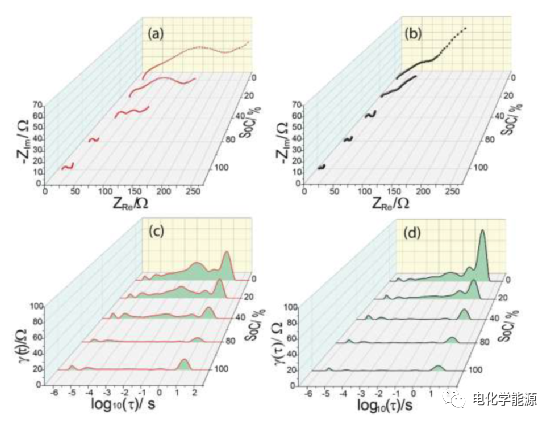 Figure 7. Comparison of DRT curves of LiS-5 and LiS-15 at 100, 80, 40, 20, and 0% SoC (a-h) and the evolution of various electrode processes (P1-8) in LiS-5 and LiS-15 at different SoCs (i, j).Figures 6c and d show the DRT curves of LiS-5 and LiS-15 at different SoCs; the Rp value of LiS-5 is higher than that of LiS-15, which is very relevant to the EIS measurement results. When the LiS-5 battery is discharged to 80% SoC and the LiS-15 to 40% SoC, the Rp values show gradual changes, with their respective batteries displaying a sharp increase in Rp in subsequent discharges. This indicates that under lean electrolyte conditions, kinetics and mass transfer limitations begin to dominate in the early stages of discharge.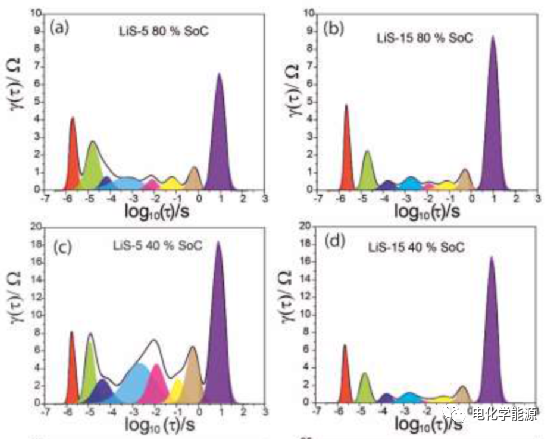
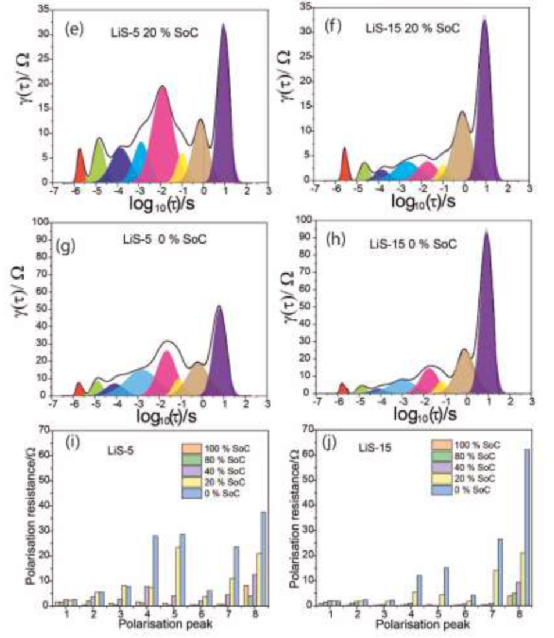 Figure 7. Comparison of DRT curves of LiS-5 and LiS-15 at 100, 80, 40, 20, and 0% SoC (a-h) and the evolution of various electrode processes (P1-8) in LiS-5 and LiS-15 at different SoCs (i, j).Figures 7a-h show the DRT analysis of LiS-5 and LiS-15 at each SoC.LiS-5 continues the general trend of higher Rp values, indicating that lean electrolyte conditions have a significant impact on electrode kinetics and mass transfer, but this is not the case for all polarization (P1-8) situations across all SoCs (Figure 7). The different DRT curves of lean and flooded batteries are caused by different degrees of solubility of sulfur and PS, battery conductivity, and electrochemically inactive solid precipitation. DRT can isolate various electrode polarizations that can be quantitatively measured, allowing for a better understanding of the impact of electrolyte content on battery behavior.At 80% SoC (Figures 7a and b), an increase in Rp for LiS-15 is observed, while the peak of LiS-5 broadens, indicating an increase in polarization at the electrode surface. Compared to LiS-5 (4.12Ω), the ionic diffusion Rp (P8) of LiS-15 (5.12Ω) is slightly larger, which can be attributed to a thicker Li2S layer on the positive electrode (formed during the initial charge-discharge); previously, thick Li2S precipitates have been observed under excessive electrolyte conditions. At 40% SoC (Figures 7c and d), when the conversion of Li2S4 to Li2S2 proceeds smoothly, the characteristic peaks of PS reactions and diffusion in LiS-5 exhibit a sharp increase in Rp and broaden significantly, while the Rp in the DRT curve of LiS-15 only increases slightly, indicating that higher electrolyte content can promote faster reaction kinetics. Larger volumes of electrolyte (LiS-15) can dissolve more polysulfides, which more greatly consumes the cathode and exposes more conductive carbon in the process. Since charge transfer reactions are more easily cleaved on conductive surfaces, LiS-15 shows lower charge transfer resistance. When the battery discharges to 20% SoC (Figures 7e and f), Li2S formed from Li2S2 is occurring in both batteries; Li2S is insulating, electrochemically inactive, and has a high ionic diffusion resistance. Compared to LiS-15 (Rp: P5=4.39Ω, P6=1.86Ω), LiS-5 shows very high Rp values (P5=23.42Ω, P6=3.7Ω) during PS reactions, indicating high polarization resistance, seemingly exacerbated by the effects of Li2S deposition in lean electrolyte where ionic diffusion is limited. At this point, both systems exhibit similar ionic diffusion characteristics, indicating that the impact of electrode kinetics on battery performance is more pronounced than ionic diffusion. When the battery is fully discharged to 0% SoC (Figures 7g and h), the batteries show very high Rp values; similarly, the resistance of LiS-5 is higher than that of LiS-15.However, the Rp value of the diffusion resistance (P8) in LiS-15 is almost twice that observed in LiS-5 (62.1 vs 37.5Ω), which we rationalize as being due to the greater dissolution of PS in LiS-15 during discharge, thus when reaching discharge limits, more Li2S is formed in LiS-15, resulting in high diffusion resistance. This is evident from the Rp value of P7 (LiS-15 26.5Ω and LiS-5 23.6Ω), which is characteristic of PS diffusion. It can be seen that the diffusion characteristics of Li-S batteries are a complex interplay of PS concentration in the electrolyte and electrode structure, evolving continually with the discharge of the battery.In Figures 7i-j, the Rp values of polarizations P1-P8 in LiS-5 and LiS-15 are compared. It can be seen that many peaks exhibit a direct correlation with the battery SoC. Importantly, several peaks from both battery compositions (P1-P8) can be observed to have a direct relationship with the battery SoC. This highlights their potential in battery diagnostics. P7 and P8 generally show a simple inverse relationship with SoC, with changes in γ(τ) and Rp being significant and easily identifiable, making them excellent candidates for Li-S battery management systems.With their origins now established, the unique “fingerprints” of P1-P8 imply their use in detecting specific patterns of battery change, evolution, and degradation also offers great potential for onboard battery metering.【Conclusion】This work utilizes DRT analysis to decompose the EIS spectra of Li-S batteries, identifying 8 characteristic local maxima related to inter-particle resistance, double-layer relaxation, negative electrode polarization, positive electrode polarization, and ionic diffusion resistance. These features represent the “fingerprints” of Li-S batteries.Importantly, through DRT analysis of original batteries and batteries at different SoCs, we found that the impedance response of Li-S batteries is dominated by the positive electrode after initial charge-discharge, while the impedance characteristics of original batteries are dominated by the metallic lithium negative electrode. During the formation of the battery, the positions, sizes, and numbers of peaks change to some extent, and crucially, the battery does not recover its original structure when charged after the first discharge, as reflected in the DRT analysis.A consistent DRT curve emerges post-battery formation, enabling the technology to be used for reliable diagnostics of battery changes; the DRT curves of Li-S batteries exhibit strong, systematic dependencies on SoC and several other battery parameters.Studies of lean electrolyte and flooded electrolyte batteries indicate that high electrolyte content improves electrode kinetics and ionic diffusion, leading to high capacity, while high polarization resistance is observed throughout the discharge process under lean electrolyte conditions. To utilize lean electrolytes in practical batteries, efforts should be made to minimize dead volume in the positive electrode while enhancing electrolyte wettability, and electrolyte formulations should be designed to maximize sulfur utilization. These valuable findings can guide the development of durable and efficient Li-S batteries.More broadly, the results presented here demonstrate the capability of the DRT method in analyzing complex electrochemical systems and should aid in the research of other emerging energy storage chemistries, including Na-S batteries, Zn-ion batteries, metal-air batteries, and more.