
What is Arthas?
Arthas is an open-source Java online diagnostic tool developed by Alibaba. It is extremely powerful and can solve many issues that are difficult to address online.
Arthas operates in a command-line interactive mode, supports JDK6+, and is compatible with Linux, Mac, and Windows operating systems. The commands also support tab key auto-completion for various information, making diagnostics very efficient.
Here is its official website:
https://alibaba.github.io/arthas/index.html
GitHub repository:
https://github.com/alibaba/arthas
What Problems Can Arthas Solve?
Let’s take a look at the official explanation of Arthas.
When you encounter the following problems and feel helpless, Arthas can help you solve them: 1. From which jar package is this class loaded? Why are various class-related exceptions being thrown? 2. Why is the code I modified not executed? Did I forget to commit? Did I get the branch wrong? 3. When encountering issues, is it only possible to add logs and redeploy? 4. There is a problem with data processing for a certain user online, but it cannot be debugged online, and it cannot be reproduced offline! 5. Is there a global view to check the system’s operational status? 6. Is there a way to monitor the real-time running status of the JVM? Arthas Official Website
Isn’t it impressive after reading this?
Especially since it can decompile classes online, allowing for debugging and tracking of problematic code without adding logs.
Since it is so powerful, many companies must be using it. Below is the usage login sequence diagram provided by the official documentation.

Quick Installation
The official recommendation is to use arthas-boot for installation, which is very convenient. The following is a demonstration based on a Linux system environment, as most online issues are resolved in a Linux environment.
Step 1: Download
Download the arthas-boot package in any directory.
wget https://alibaba.github.io/arthas/arthas-boot.jar
[root@VM_0_7_centos ~]# wget https://alibaba.github.io/arthas/arthas-boot.jar
--2019-07-30 14:48:31--  https://alibaba.github.io/arthas/arthas-boot.jar
Resolving alibaba.github.io (alibaba.github.io)... 185.199.108.153, 185.199.109.153, 185.199.110.153, ...
Connecting to alibaba.github.io (alibaba.github.io)|185.199.108.153|:443... connected.
HTTP request sent, awaiting response... 200 OK
Length: 98637 (96K) [application/java-archive]
Saving to: ‘arthas-boot.jar’

100%[==========================================================================================================>] 98,637      32.8KB/s   in 2.9s

2019-07-30 14:48:36 (32.8 KB/s) - ‘arthas-boot.jar’ saved [98637/98637]
Step 2: Run
Use the java -jar command to execute the arthas-boot package.
java -jar arthas-boot.jar
[INFO] arthas-boot version: 3.1.1
[INFO] Found existing java process, please choose one and hit RETURN.
* [1]: 13062 spring-boot-best-practice-0.0.1-SNAPSHOT.jar
Step 3: Select Process
After running arthas-boot, the console will display all Java processes. Select the process you need to diagnose.
As shown in step two, there is only one Java process here. Enter the number 1 and press Enter. Arthas will attach to the target process and output logs:
[INFO] Start download arthas from remote server: https://maven.aliyun.com/repository/public/com/taobao/arthas/arthas-packaging/3.1.1/arthas-packaging-3.1.1-bin.zip
[INFO] Download arthas success.
[INFO] arthas home: /root/.arthas/lib/3.1.1/arthas
[INFO] Try to attach process 13062
[INFO] Attach process 13062 success.
[INFO] arthas-client connect 127.0.0.1 3658
  ,---.  ,------. ,--------.,--.  ,--.  ,---.   ,---.
 /  O   |  .--. ''--.  .--'|  '--'  | /  O   '   .-'
|  .-.  ||  '--'.'   |  |   |  .--.  ||  .-.  |`.  `-.
|  | |  ||  |      |  |   |  |  |  ||  | |  |.-'    |
`--' `--'`--' '--'   `--'   `--'  `--'`--' `--'`-----'


wiki      https://alibaba.github.io/arthas
tutorials https://alibaba.github.io/arthas/arthas-tutorials
version   3.1.1
pid       13062
time      2019-07-30 14:49:34
At this point, the installation and startup are complete.
For more installation methods, see: https://alibaba.github.io/arthas/install-detail.html
Practical Usage
After startup, the current cursor will enter the arthas console, accepting various operational commands.
Next, I will demonstrate a few commonly used commands to give everyone a basic understanding and quick start capability.
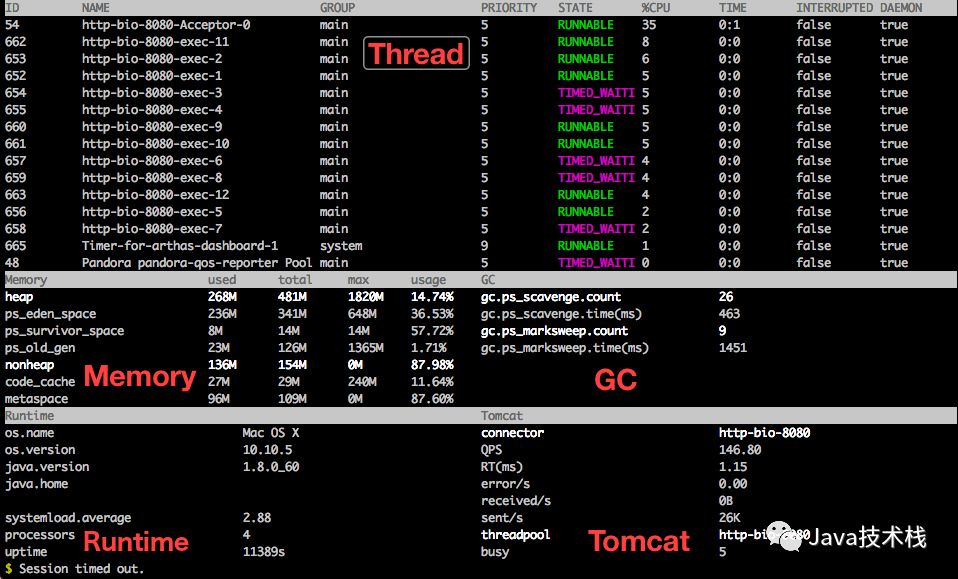
1. dashboard
Displays the real-time data panel of the current system. Press ctrl+c to exit.
$ dashboard
2. thread
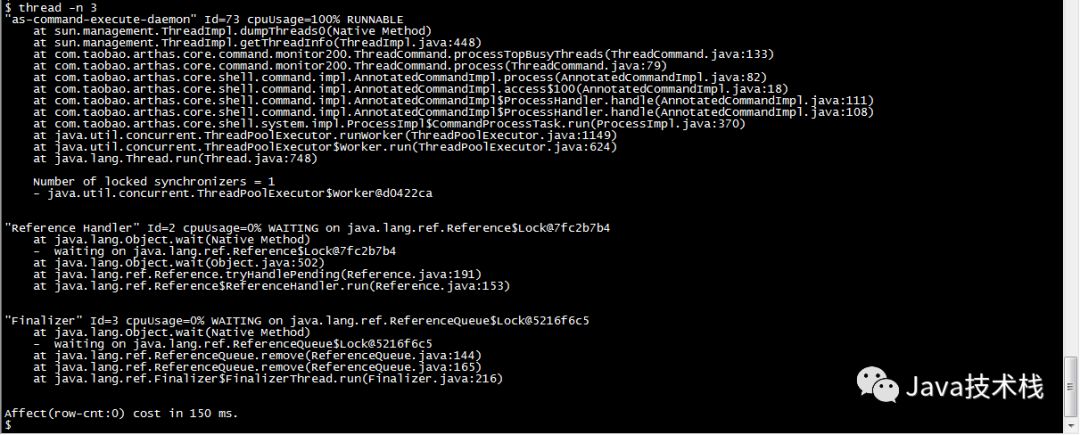
View the thread stack information of the current JVM.
To display the running stack of a specified thread:
$ thread 20

To display the top N busiest threads and print their stacks:
$ thread -n 3
3. sc
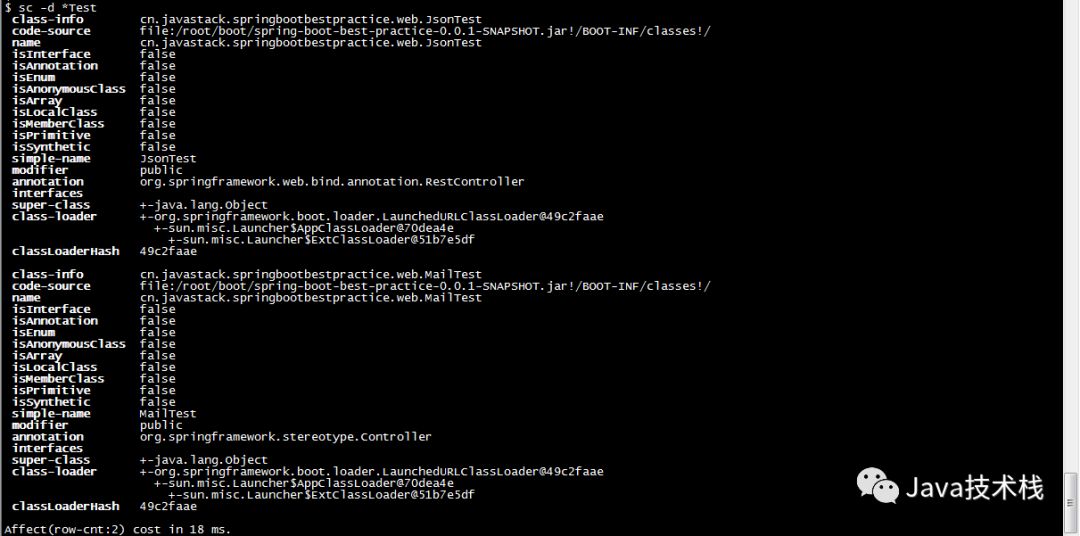
View detailed information about the classes loaded in the JVM.
$ sc -d *Test
4. sm
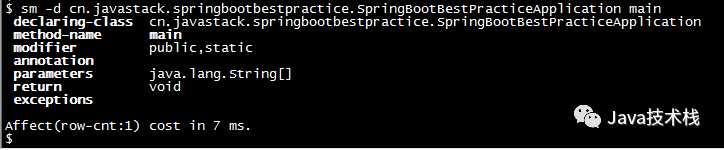
View method information of loaded classes.
$ sm -d cn.javastack.springbootbestpractice.SpringBootBestPracticeApplication main
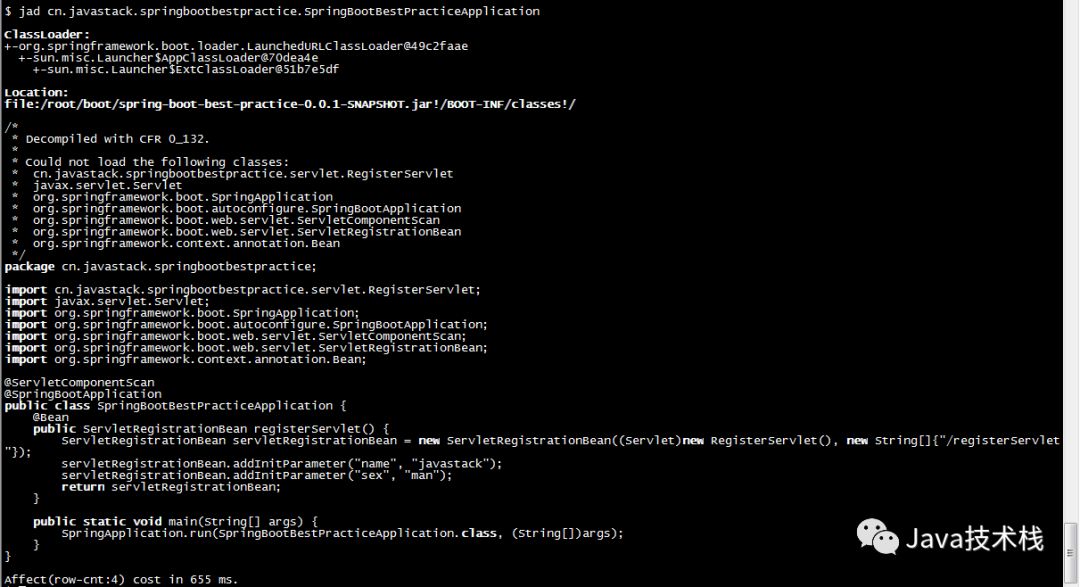
5. jad
Decompile the source code of a specified loaded class.
$ jad cn.javastack.springbootbestpractice.SpringBootBestPracticeApplication
6. trace
Displays the internal call path of a method, returning non-real-time commands and outputting the total time spent on the method path and detailed time spent at each node.
$ trace -j cn.javastack.springbootbestpractice.web.JsonTest getUserInfo
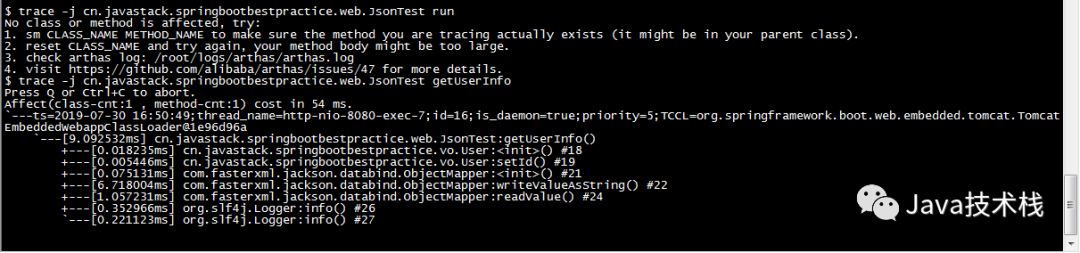
-j: Indicates skipping the method path in the JDK.
7. monitor
Perform timed monitoring of method calls.
$ monitor cn.javastack.springbootbestpractice.web.JsonTest getUserInfo -c 5
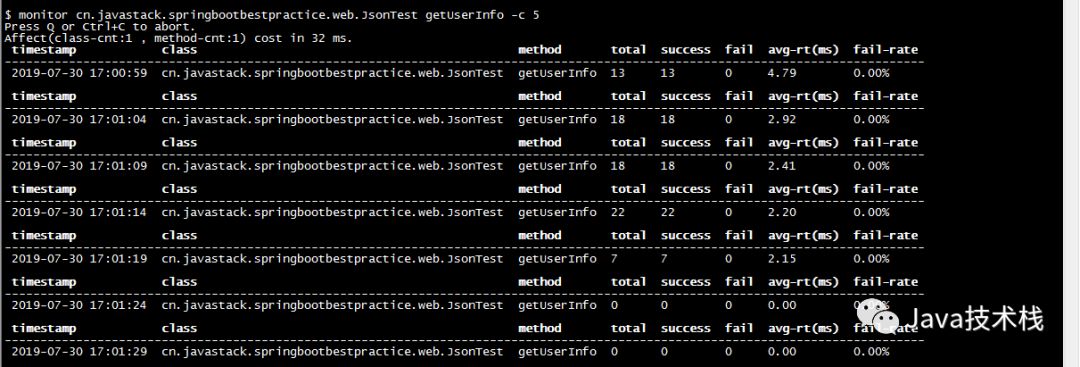
-c 5: Indicates that statistics are collected every 5 seconds, with a default period of 120 seconds.
Monitoring Dimension Description:
| Monitoring Item | Description |
|---|---|
| timestamp | Timestamp |
| class | Class Name |
| method | Method Name |
| total | Call Count |
| success | Success Count |
| fail | Failure Count |
| rt | Average Response Time |
| fail-rate | Failure Rate |
8. watch
Observe method execution data, allowing easy observation of the call situation of a specified method, such as return values, exceptions thrown, parameters, etc.
$ watch cn.javastack.springbootbestpractice.web.JsonTest getUserInfo ‘{params, returnObj}’ -x 2 -b
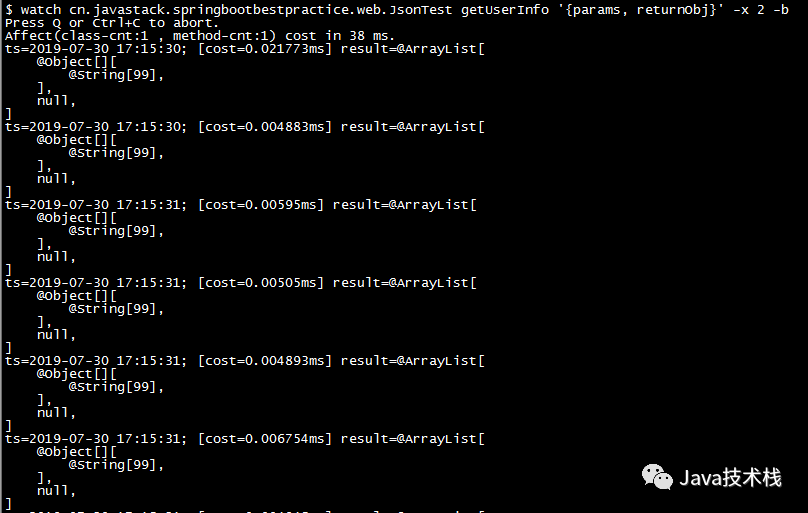
The above monitors the input parameters of a method before execution: -b, traversal depth: -x 2.
9. quit/exit
Exit the current Arthas session.
This command only exits the current connected client; Arthas attached to the target process will continue running, and the port will not close. You can connect directly next time.
10. shutdown
Shut down the Arthas server and exit all Arthas clients.
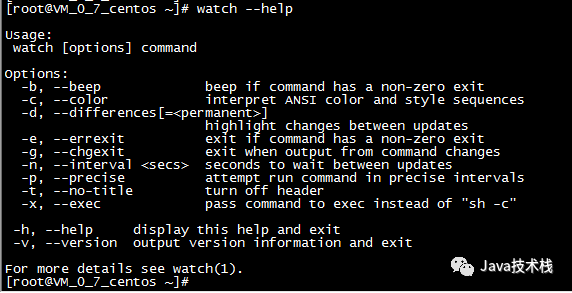
The above demonstrated the basic usage of 10 commands. For detailed usage of various commands, you can refer to the command with --help.
For more commands, please refer to:
https://alibaba.github.io/arthas/commands.html
Conclusion
In summary, using Arthas makes it very convenient to diagnose a Java application, such as system data panels, real-time JVM running status, class loading status, monitoring method execution, displaying method execution paths, etc.
The practical features of Arthas can indeed help us solve some common online issues and can operate independently of application code, but it is limited to a single JVM process. In a distributed system, Arthas may face challenges.
That’s all for today’s article. Are you also using Arthas? Feel free to leave a comment to share your experiences. If you find the article helpful, you can also share it with your classmates and colleagues.
—————END—————
If you like this article, feel free to follow the public account Programmer Xiao Hui, to see more exciting content.

Feel free to long press the QR code to follow Xiao Hui Learns English, you will learn more than just English!

Give a [like], it is the greatest support for Xiao Hui