To ask which technology in electrochemical testing is the most hair-pulling, I would say it’s EIS (Electrochemical Impedance Spectroscopy), and I think hardly anyone would disagree.
There is “poetry” to prove:
Measuring impedance is tough,
Equivalent circuits are hard to guess;
If you ask if performance improves?
We’re happy if the arc shrinks!
Although the equivalent circuit is still the most common method for processing EIS data, confirming and validating the equivalent circuit itself is indeed a difficult task. In recent years, the analysis method of Distribution of Relaxation Time (DRT) has been increasingly applied in EIS data processing, such as in an article cited by @NewEnergyLeader from the research group of Academician Ouyang Minggao at Tsinghua University.
As a layman, I’m a bit idle today and want to see how the impedance spectrum of the Warburg element performs in DRT analysis, whether it is true as mentioned in the literature: the Warburg element can be expanded into an infinite number of (RC) series. (This theory is quite complex, so I’ll skip a thousand words.)

Fortunately, I have the right tools in hand, so let’s get started. First, I used the simulator of the tool to generate a series of impedance spectra with the following parameters:
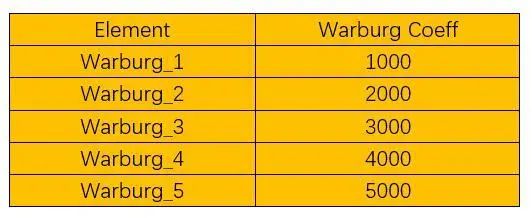
The impedance spectrum is as follows:
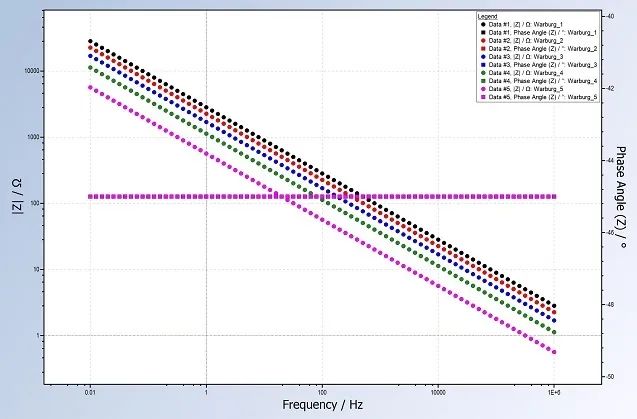
Bode plot
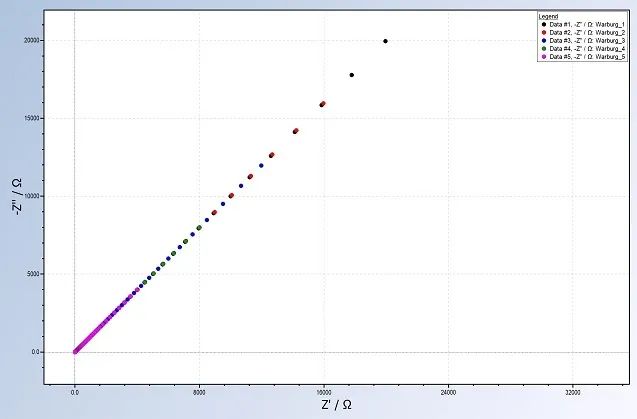
Nyquist plot
Based on the following spectra, I found a suitable λ value of 1E-7 (it is said that under the premise of ensuring a small SSR, the λ value should not be too large).
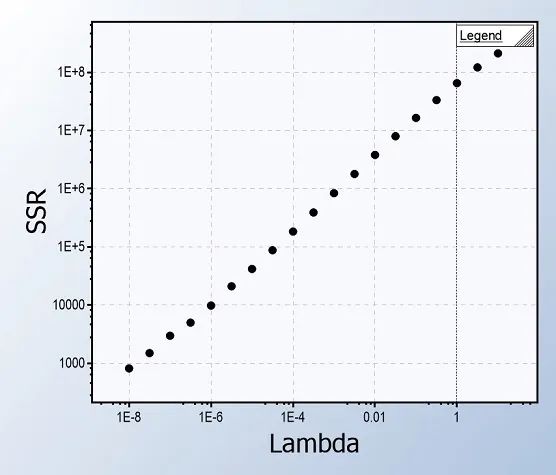
To further verify whether this λ value is appropriate, I reconstructed the EIS spectrum through the results of DRT and found that it aligns well with the original Bode spectrum (except for the oscillation in the high-frequency part).
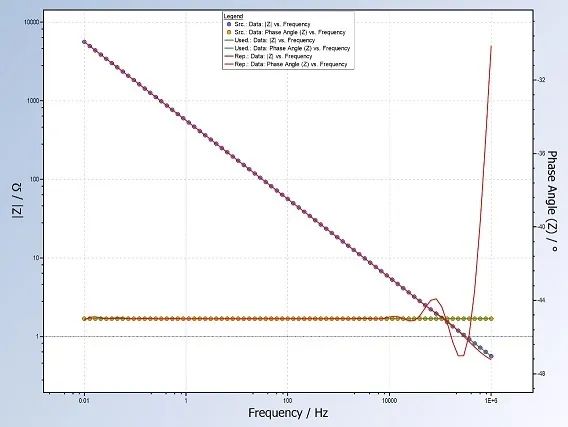
Having confirmed the suitable λ value, I easily obtained the following DRT analysis results:
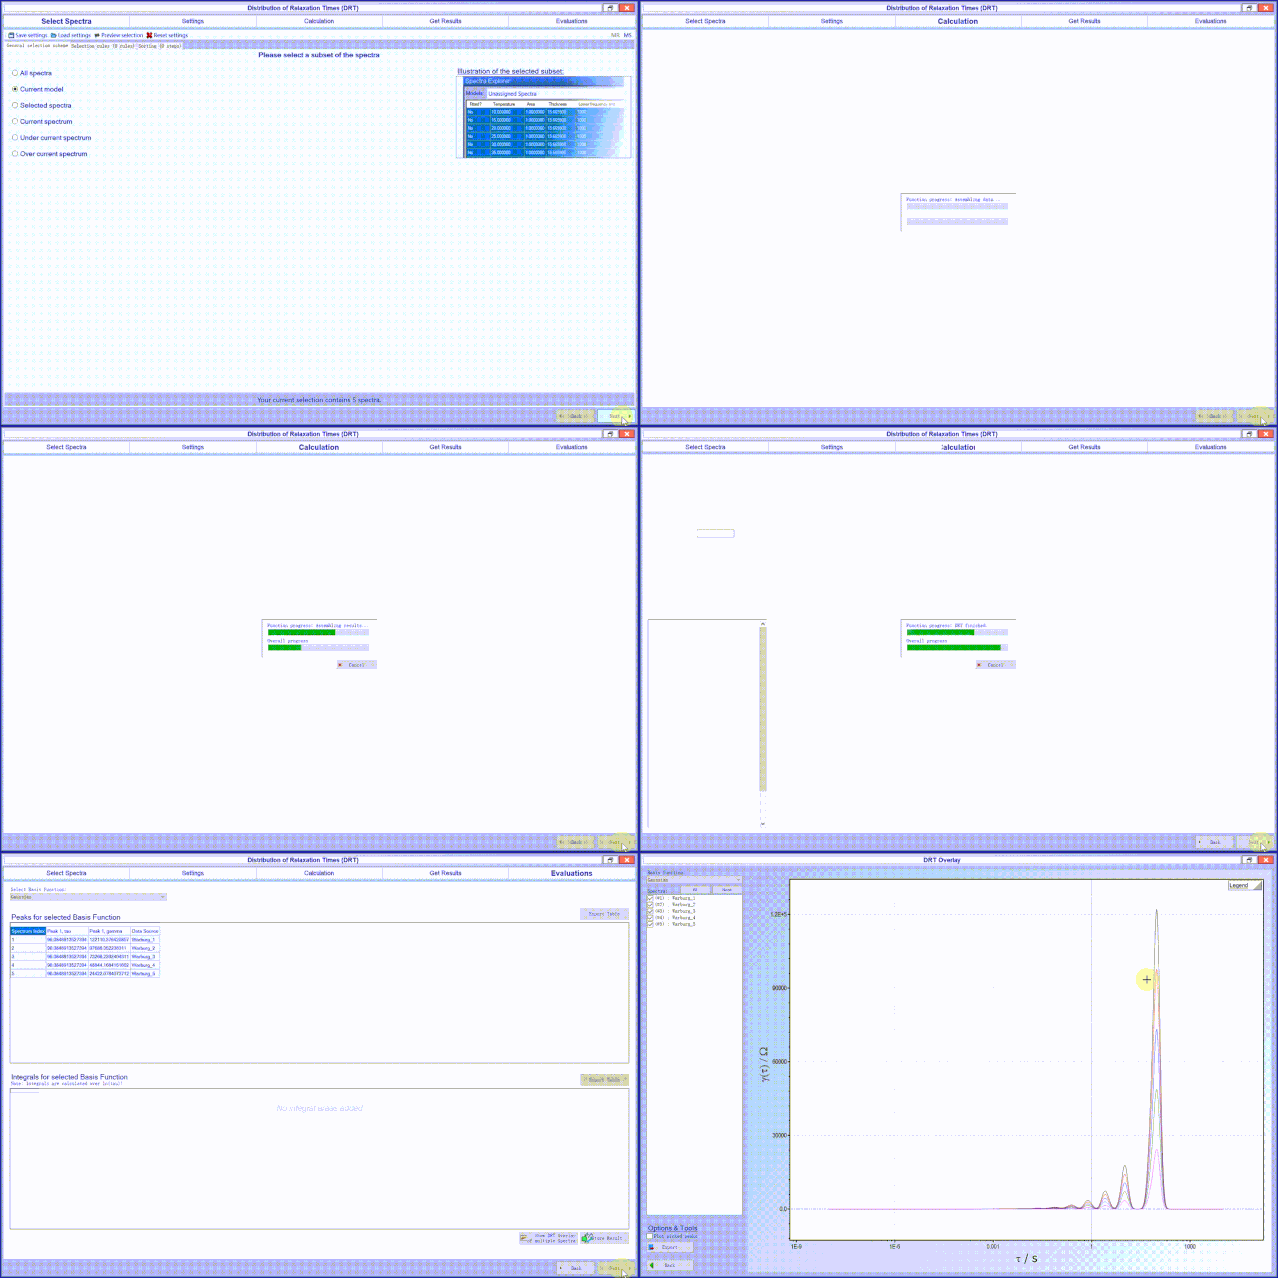
Finally, I got the following nice graph:
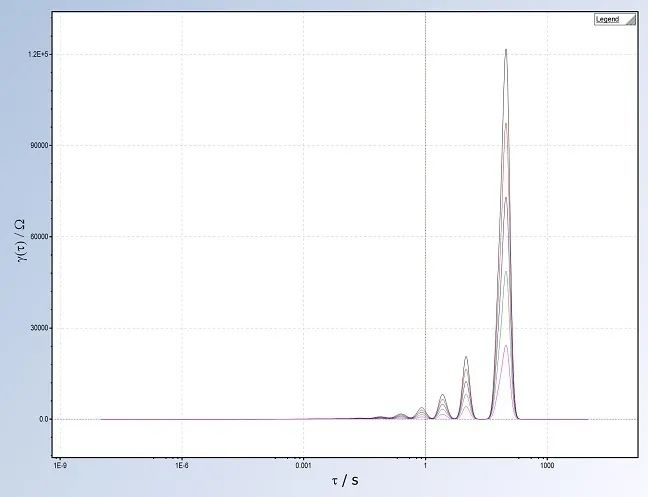
It seems the legends are true; the impedance spectrum of the Warburg element can indeed be decomposed into an infinite number of (RC) series.
To further reflect the scientific literacy of a layman, I also obtained the corresponding R values for the first few (RC) components through the following spectrum decomposition.
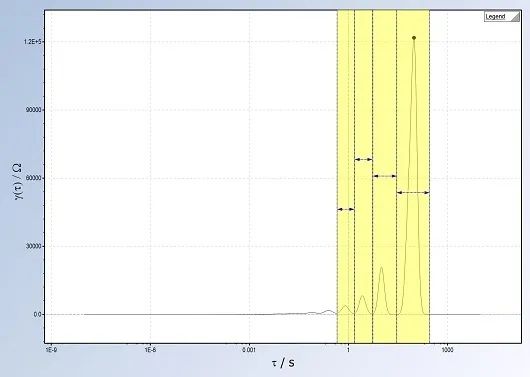

Isn’t the result cool?
After all this, it’s time to introduce the tool; it’s the RelaxIS software, which is powerful and straightforward.

DRT analysis is just the tip of the iceberg for the RelaxIS software; in addition, it provides the following functions:
Equivalent circuit scanning
Automatic fitting of equivalent circuits
Multi-weight fitting
Batch processing.
Monte Carlo component error analysis
Global fitting
Characteristic frequency search
Equivalent circuit noise simulation
Automatic report generation
……
Now, you just need to long-press the QR code below, scan it, and complete the application for certification to try this tool for free.

-since 1943-
Metrohm China
PEOPLE YOU CAN TRUST | All Trust, Expertise in Analysis
400-604-0088