Detailed Usage Notes for Raspberry Pi JTAG
-
1. Introduction
-
2. Environment Setup
-
2.1 Hardware Connection
-
2.2 Software Preparation
-
3. Conclusion
1. Introduction
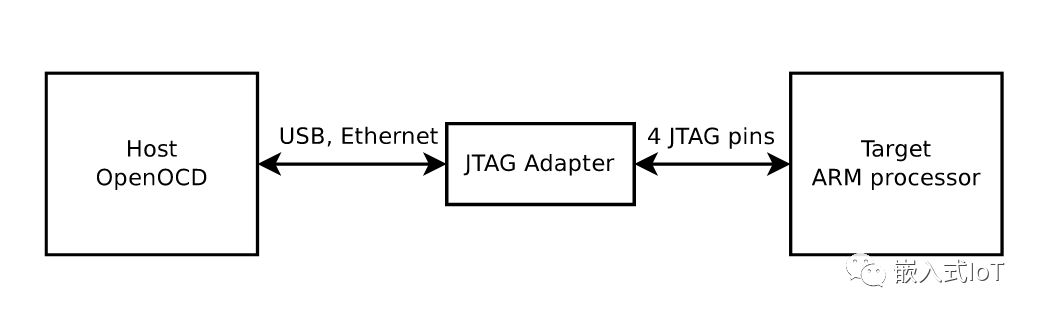
Sometimes, when debugging code, hardware debugging tools are often used, and JTAG is a very good debugging tool. Below is a detailed introduction on how to use JTAG for debugging on the Raspberry Pi.
This article mainly implements jlink debugging functionality on the Raspberry Pi 4. It uses jlink and openocd to debug the Raspberry Pi 4. After that, you can debug the Raspberry Pi 4 program using gdb commands.
To be successful, one must first equip themselves with the right tools. With better tools, the developed programs become more stable, and it is also easier to trace the program during later analysis.
Next, I will describe the environment setup and usage in detail.
2. Environment Setup
For using gdb, it is recommended to set up the environment on Ubuntu, as it provides better support. Therefore, the software part of this experiment mainly involves setting up the environment and development on Ubuntu.
2.1 Hardware Connection
The 40-pin GPIO header of the Raspberry Pi actually has a JTAG interface, so no flying leads are needed; you can connect it using Dupont wires.
The basic pin definitions are as follows:
| Pin Name | GPIO Function ALT4 |
|---|---|
| GPIO22 | ARM_TRST |
| GPIO24 | ARM_TDO |
| GPIO25 | ARM_TCK |
| GPIO26 | ARM_TDI |
| GPIO27 | ARM_TMS |
To make it easier to see the connections, the images are marked as follows:
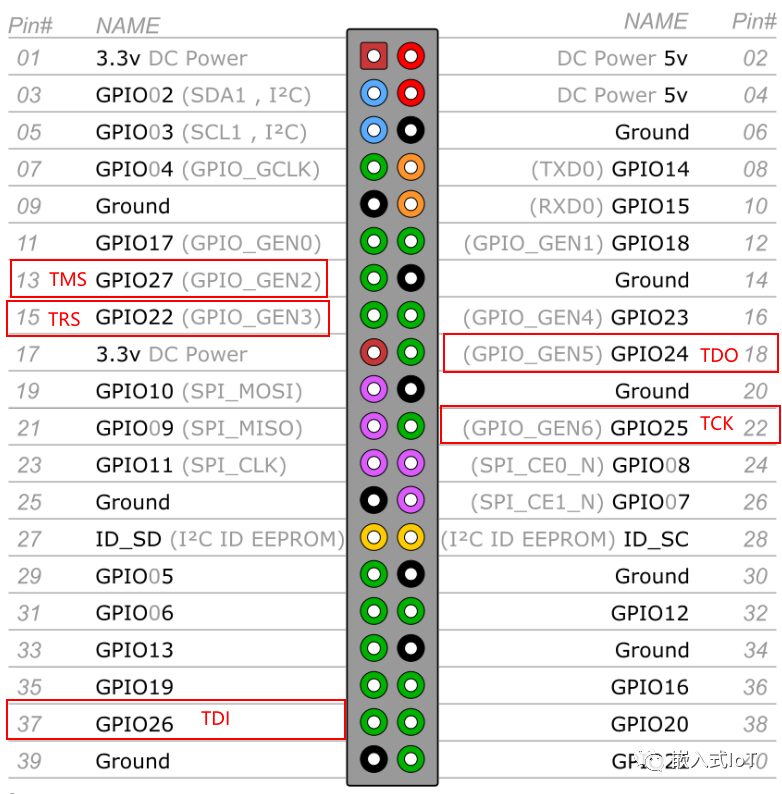
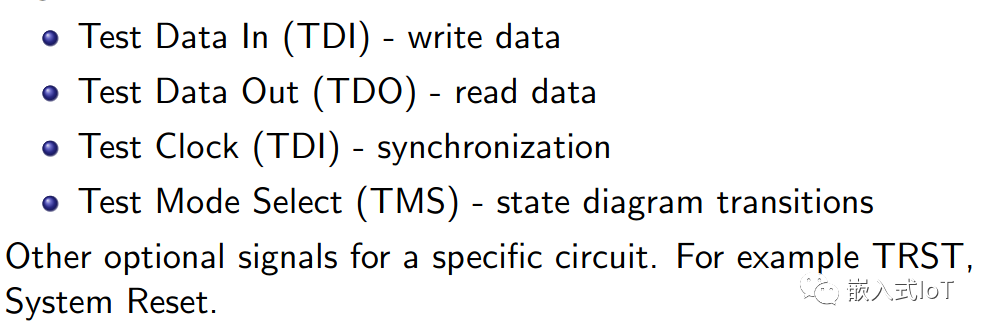
The pin definitions are as follows:
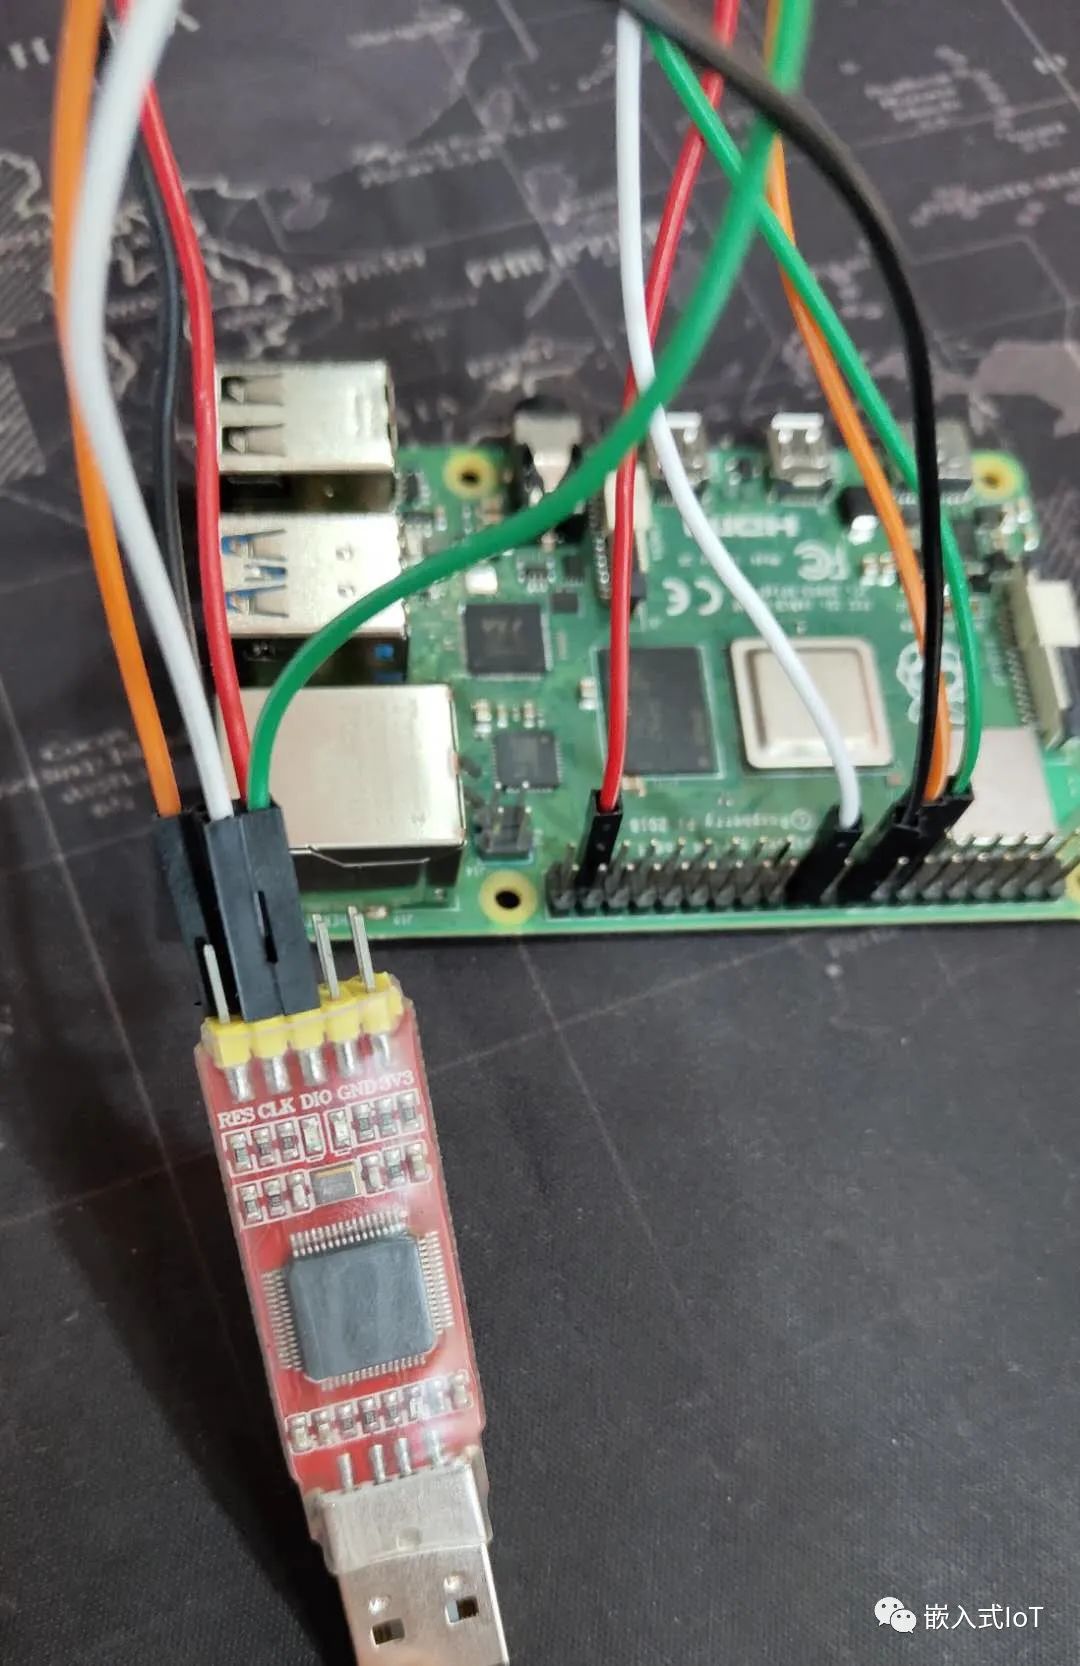
The physical connection can be seen in the image below:
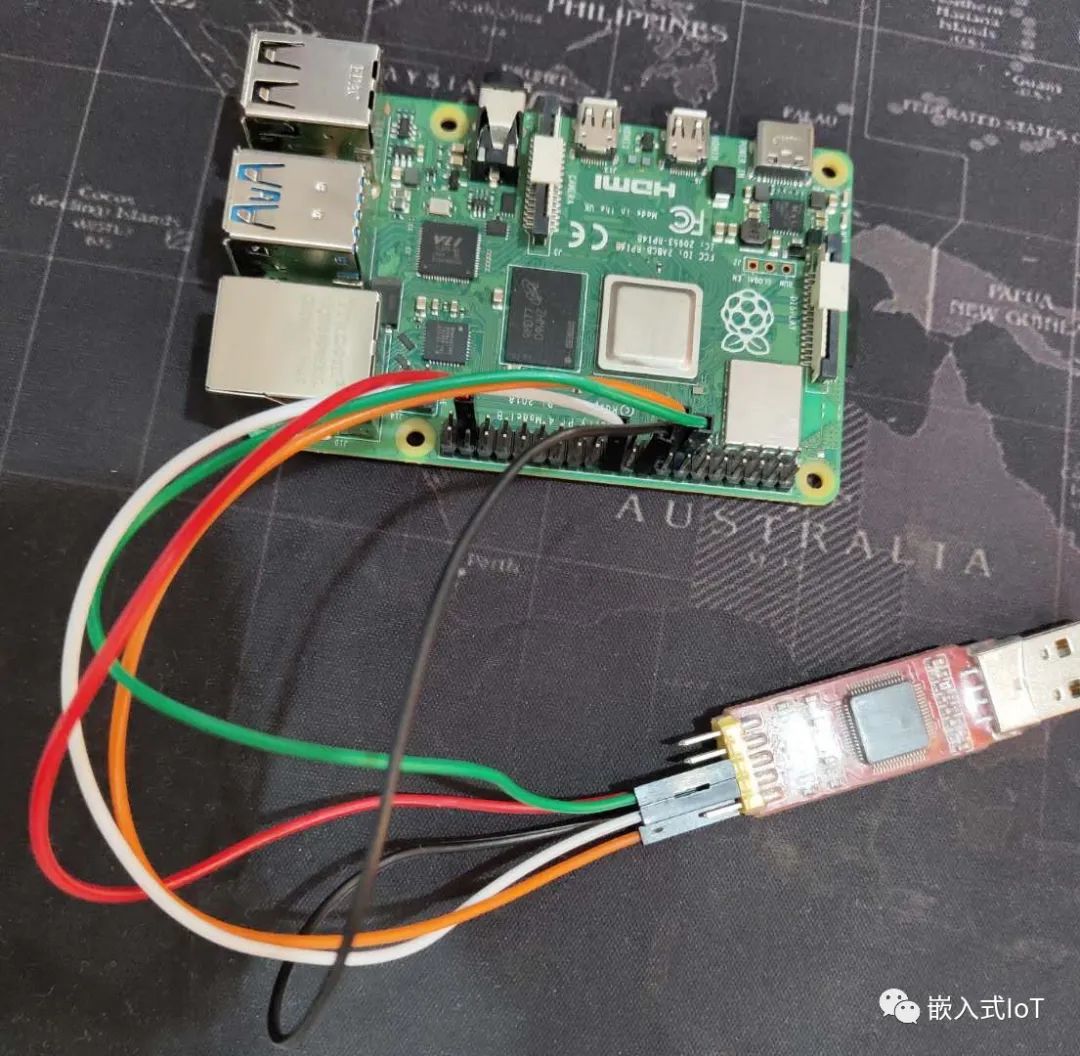
Here, the Raspberry Pi is connected to a jlink debugger.
The enlarged pin diagram is as follows:
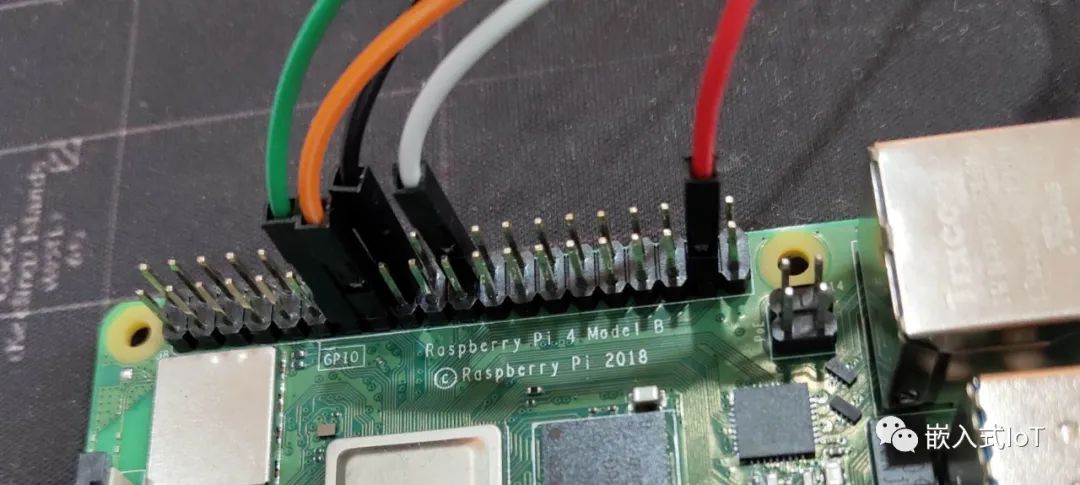
Once the connections are complete, you can proceed with the subsequent operations.
2.2 Software Preparation
Install JLinkOB
First, you must install the JLinkOB driver.
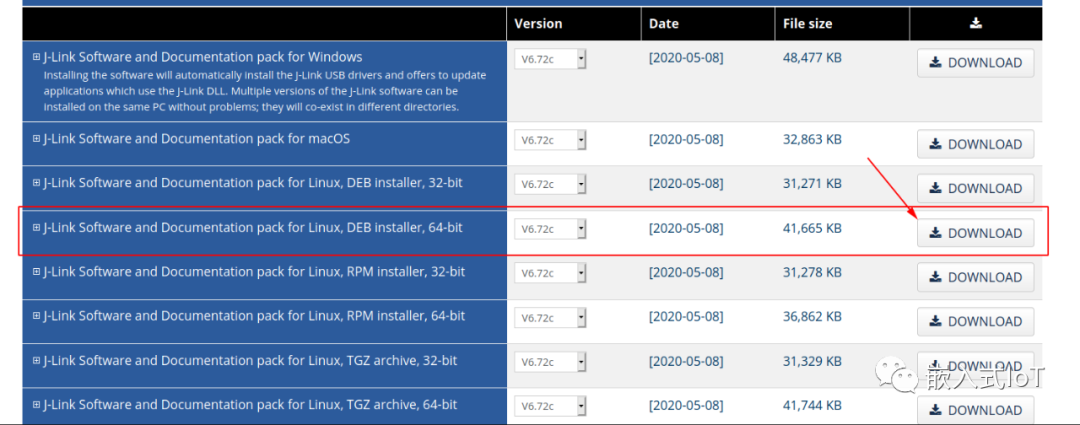
Since the environment is set up on Ubuntu, you can download and install as shown in the image.
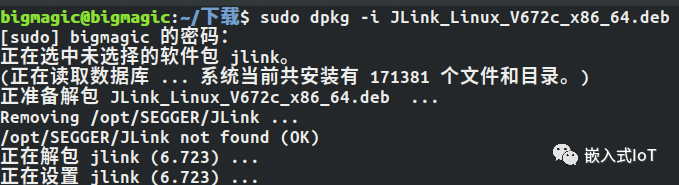
sudo dpkg -i JLink_Linux_V672c_x86_64.deb
If you see the following image, the installation was successful.
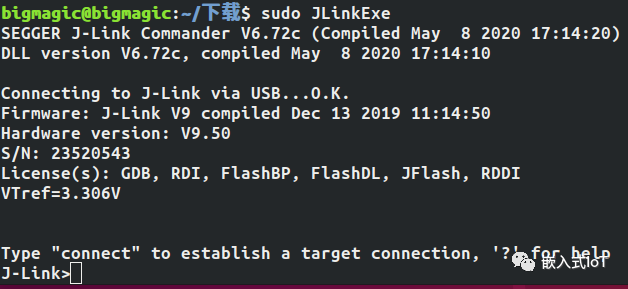
To verify if the installation was successful, you can enter:
sudo JLinkExe
If you see the following information, it indicates success.
Install openocd
To support the Raspberry Pi 4, you can download openocd from the following link:
https://github.com/xpack-dev-tools/openocd-xpack/releases/download/v0.10.0-13/xpack-openocd-0.10.0-13-linux-x64.tgz
For openocd on Windows, the download link is:
https://gnutoolchains.com/arm-eabi/openocd/
If you download from other sources, you may encounter the following error during debugging:
raspi4.cfg:15: Error: invalid command name "dap"
This can be resolved by configuring the script. The script for the Raspberry Pi 4 can be found in Baidu Cloud.
Execute:
sudo /home/bigmagic/tools/xpack-openocd-0.10.0-13-linux-x64/xPacks/openocd/0.10.0-13/bin/openocd -f /home/bigmagic/tools/xpack-openocd-0.10.0-13-linux-x64/xPacks/openocd/0.10.0-13/scripts/interface/jlink.cfg -f /home/bigmagic/openocd/raspi4.cfg
This will connect openocd to the Raspberry Pi 4 via jlink.
Let the Program Halt
To make the Raspberry Pi program halt during startup, and manually load firmware into memory via openocd, you can perform the following operations:
Refer to the implementation in the following GitHub repository:
https://github.com/metebalci/baremetal-rpi/blob/master/01-infinite-loop/infloop.s
It contains only one line of code:
l: b l
This will execute an infinite loop.
Next, modify the configuration file on the SD card:
enable_uart=1
arm_64bit=1
kernel=infloop.bin

enable_jtag_gpio=1
gpio=22-27=a4
init_uart_clock=48000000
init_uart_baud=115200
Where infloop.bin represents the executable program; you can replace it with your own program for normal operation.
Start Debugging
Step 1: Place Files
Put the startup firmware onto the SD card.
The related files can be downloaded from my cloud storage:
https://pan.baidu.com/s/1F5toHNpt20tfVsmhzspw6Q
Extraction code: iq7m
Insert the SD card, connect the power supply, and the system will enter the waiting mode for the JTAG connection.
Step 2: Connect openocd
Use the following command script to connect:
sudo /home/bigmagic/tools/xpack-openocd-0.10.0-13-linux-x64/xPacks/openocd/0.10.0-13/bin/openocd -f /home/bigmagic/tools/xpack-openocd-0.10.0-13-linux-x64/xPacks/openocd/0.10.0-13/scripts/interface/jlink.cfg -f /home/bigmagic/openocd/raspi4.cfg
The main command is:
openocd -f xxx.cfg -f raspi4.cfg
Once connected, you can see the printed information as follows:
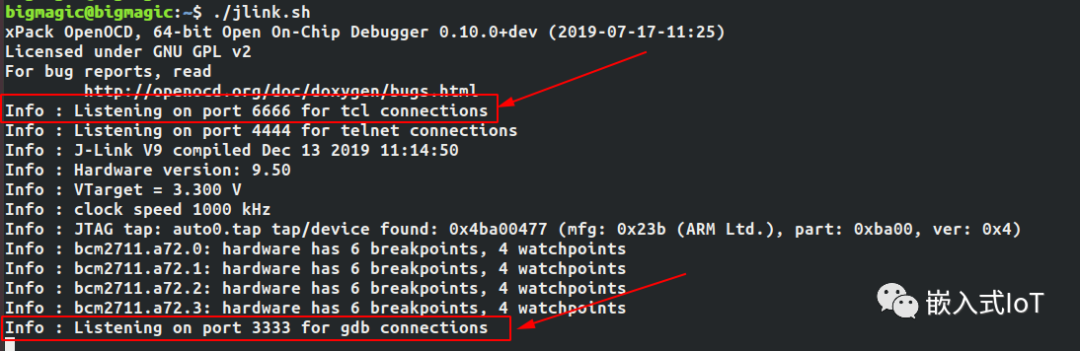
It is important to note the connections of the three ports: control openocd using telnet, and connect to gdb using port 3333.
Step 3: Load Firmware via Telnet
At this point, you need to use telnet to load the memory image into memory.
This experiment uses the rt-thread system for Raspberry Pi 4 for debugging.
https://github.com/RT-Thread/rt-thread/tree/master/bsp/raspberry-pi/raspi4
After compiling, rtthread.bin and rtthread.elf will be generated, as shown in the following image:
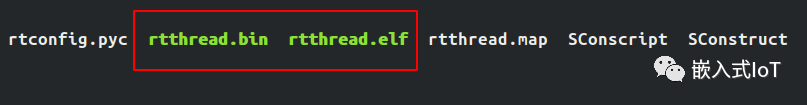
Then you can proceed with the relevant debugging.
Start telnet:
telnet localhost 4444
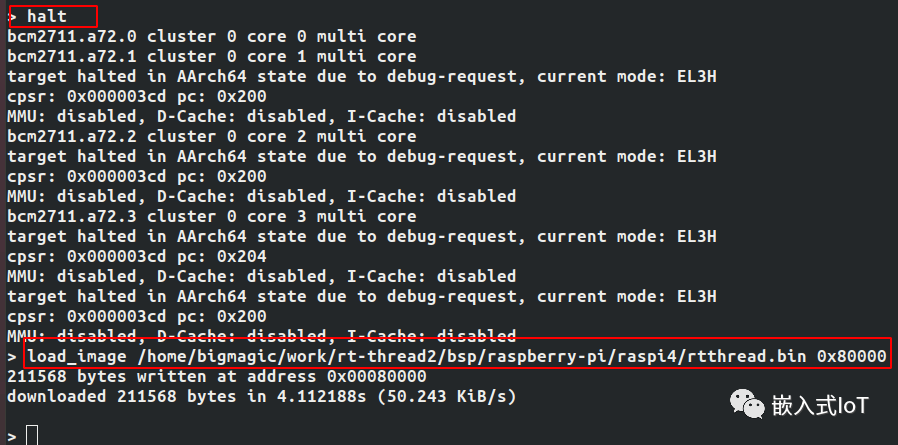
Load the firmware:
halt
load_image /home/bigmagic/work/rt-thread2/bsp/raspberry-pi/raspi4/rtthread.bin 0x80000
This indicates loading rtthread.bin firmware into the Raspberry Pi 4 at address 0x80000.
Then enter:
step 0x80000
This indicates executing the program from the entry address 0x80000.
Step 4: Start gdb Debugging
In another console, enter:
aarch64-elf-gdb
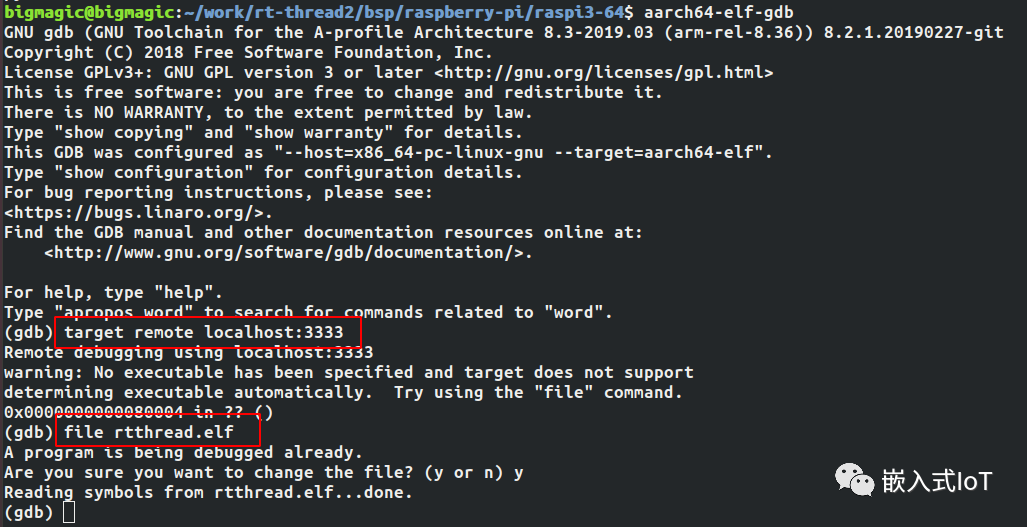
Then enter:
target remote localhost:3333
file rtthread.elf
At this point, the program can halt at the entry function.
Step 5: View Registers and Code
Input layout src to expand the code.
Input layout reg to view the registers.
Input layout split to expand the assembly.
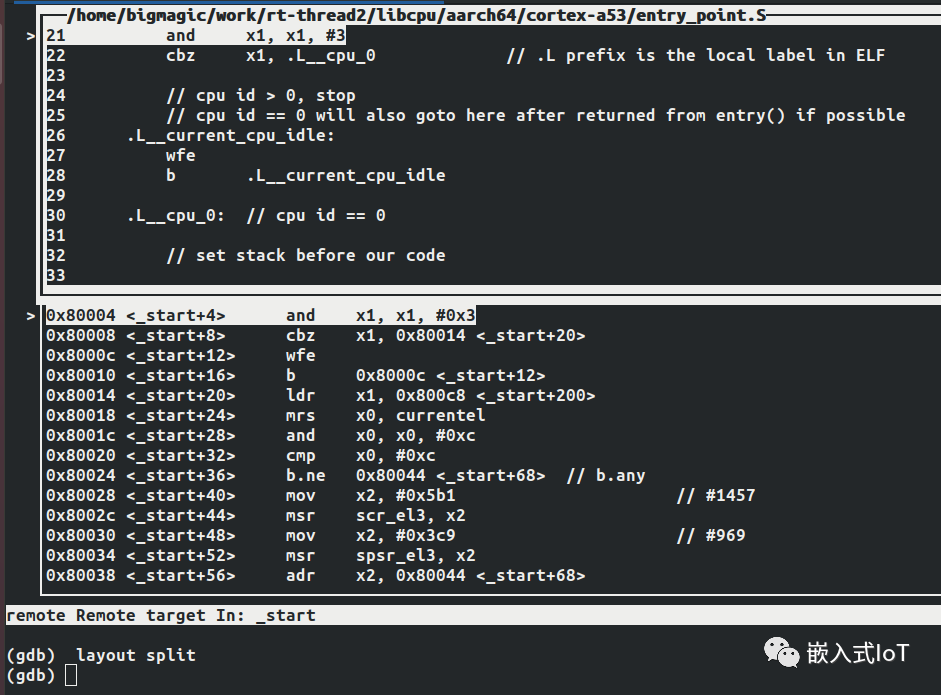
You can then debug using gdb commands.
For example, set a breakpoint at entry:
break entry
c
Then you can see that it has stopped at the breakpoint.
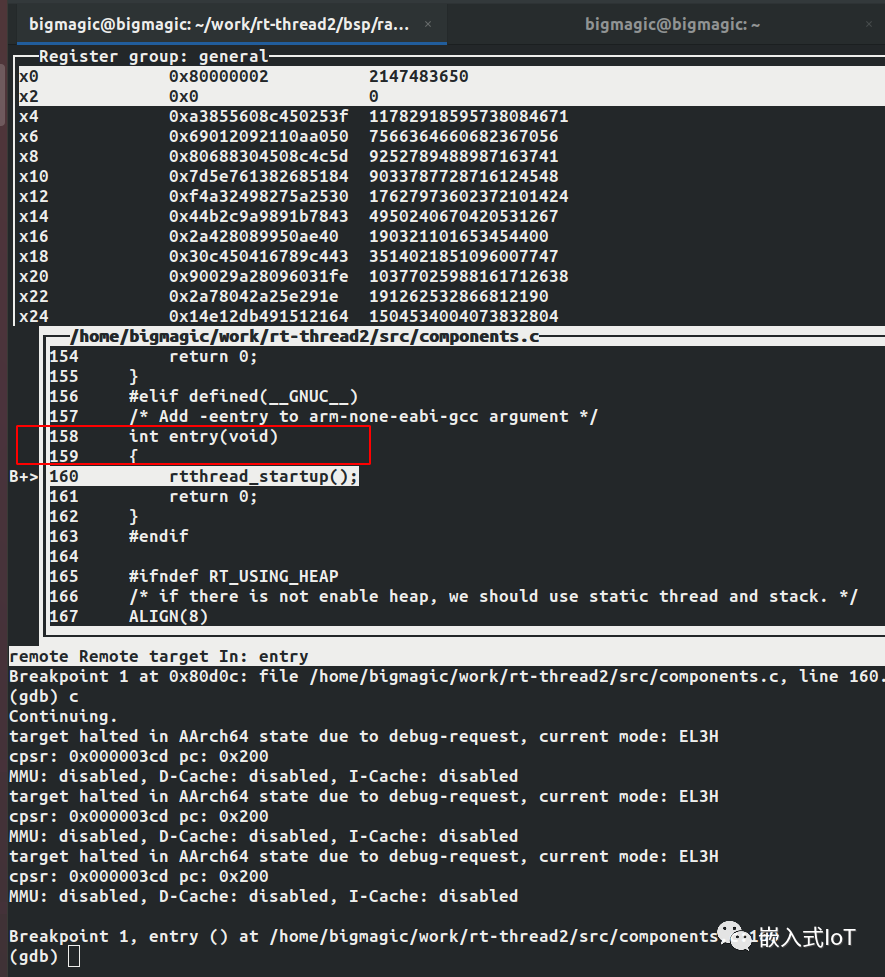
This makes debugging the program very convenient.
3. Conclusion
The above describes the process of using jlink and openocd to debug programs on the Raspberry Pi 4. To be successful, one must first equip themselves with the right tools.
Having good code analysis methods will make it easy to locate and analyze code quality. At critical times, this can play a huge role, especially in analyzing complex code logic and locating issues effectively.