JTAG Debugging – GDB Example

JTAG Debugging - GDB Example

OpenOCD is used to drive the JTAG interface, typically in conjunction with GDB for code execution debugging. The usage of GDB is fundamentally no different from its use in other contexts.Some debugging techniques for GDB: Advanced Usage of GDBThere are two ways to start GDB and interact with OpenOCD: GDB communicates with OpenOCD over TCP … Read more

Hardware Debugging for Reverse Engineers Part 1: SWD, OpenOCD, and Xbox One Controller

Hardware Debugging for Reverse Engineers Part 1: SWD, OpenOCD, and Xbox One Controller

“This article details the process of hardware disassembly, firmware extraction, debugging, and modification of the Xbox One controller. The author explores the internal structure by disassembling the controller, identifies the SWD interface, and uses the OpenOCD tool for hardware debugging. The article also explains how SWD works, how to use OpenOCD for firmware extraction and … Read more

JTAG Debugging with OpenOCD

JTAG Debugging with OpenOCD

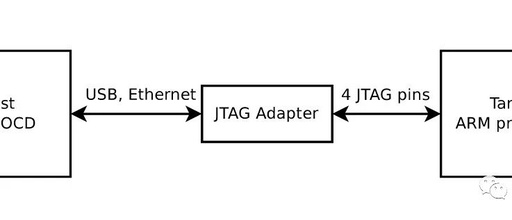
OCD stands forOn-Chip Debugger, which is on-chip debugging. OpenOCD is an open-source JTAG debugging tool that operates as follows:The following diagram shows a physical connection, where the debugging target is theIntel Galileo Board, and the hardware box is the Flyswatter. The small board labeled 4 is theARM-JTAG-20-10 Adapter:When starting OpenOCD, a configuration file is passed … Read more

OpenOCD: The Essential Tool for Embedded System Debugging, Mastering JTAG and SWD

OpenOCD: The Essential Tool for Embedded System Debugging, Mastering JTAG and SWD

OpenOCD (Open On-Chip Debugger) is a powerful open-source project that provides in-chip programming and debugging support for embedded systems. It supports various JTAG interfaces and target chips, and its rich features make it an essential tool for embedded developers. This article will delve into the functionalities, usage, installation, and configuration of OpenOCD, revealing the technical … Read more

JTAG Debugging – Hardware Box

JTAG Debugging - Hardware Box

The JTAG debugging hardware box commonly includes Lauderbatch and ARM’s DStreamer, with prices for licenses ranging from thousands of dollars: A more affordable option is the Flyswatter, priced at a few hundred dollars. Let’s discuss further: Inside the box is actually a USB to serial FTDI FT2232 chip. After connecting to the PC via USB, … Read more

Setting Up STM32 Development Environment in VSCode

Setting Up STM32 Development Environment in VSCode

Follow+Star Public Number, don’t miss wonderful content Author | Nuan Nuan’s Dilemma Source | CSDN As we all know, Keil is a paid software. Although it can be used with a workaround, many companies are still a bit hesitant, and many readers may have received ** letters. Previously, when developing microcontroller projects, Keil was one … Read more

CLion Tutorial – Embedded Development

CLion Tutorial - Embedded Development

This page provides an overview of how to use CLion as your embedded development IDE. For detailed feature descriptions and setup instructions, please refer to the dedicated articles in this section. Hardware TypeCLion supports embedded development for any hardware compatible with the GCC or IAR toolchain. Some examples include: ARM-based microcontrollers, such as the STM32 … Read more

Detailed Usage Notes for Raspberry Pi JTAG

Detailed Usage Notes for Raspberry Pi JTAG

Detailed Usage Notes for Raspberry Pi JTAG 1. Introduction 2. Environment Setup 2.1 Hardware Connection 2.2 Software Preparation 3. Conclusion 1. Introduction Sometimes, when debugging code, hardware debugging tools are often used, and JTAG is a very good debugging tool. Below is a detailed introduction on how to use JTAG for debugging on the Raspberry … Read more

Introduction to JTAG Interface in Embedded C Development

Introduction to JTAG Interface in Embedded C Development

1. Definition: – JTAG (Joint Test Action Group) is a standard for testing and debugging integrated circuits, widely used in embedded systems development. 2. Purpose: – To debug, test, and program embedded systems, allowing developers to inspect and manipulate the internal state of the processor. 3. Components: – The Test Access Port (TAP) controller manages … Read more

Setting Up ESP32-S3 Development Environment with Zephyr

Setting Up ESP32-S3 Development Environment with Zephyr

The Zephyr development environment supports three major operating systems: Windows, Linux, and MacOS. However, the most comprehensive support is for Linux, so it is recommended to use Linux for beginners. This article is based on Ubuntu 22.04. In some sense, this is a rehash of previous articles because similar content has been covered: Building Zephyr … Read more