AI-empowered Materials
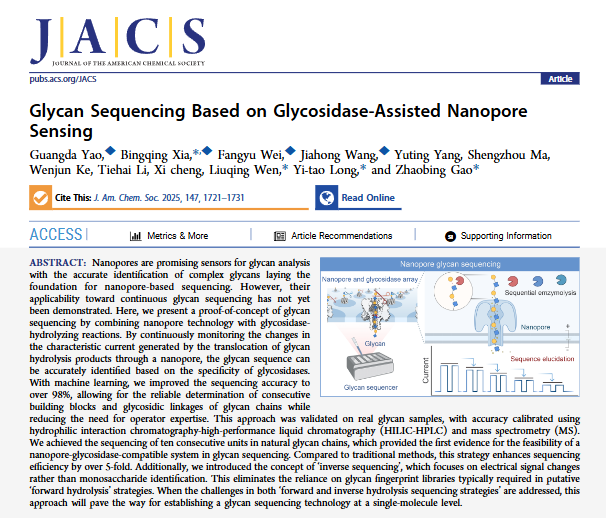
As one of the three major biological macromolecules, the structural analysis of glycans has become a core bottleneck in glycoscience due to their diverse branching and complex glycosidic bond types (e.g., β1,3-linked N-acetylglucosamine, β1,4-linked galactose). Traditional NMR and MS methods have limitations such as low throughput, high costs, and reliance on standard fingerprint libraries, making it difficult to meet the efficient sequencing needs of complex glycans. Although nanopore technology has the advantage of high sensitivity for single-molecule detection, it cannot achieve continuous sequence analysis of glycans. This paper addresses this challenge by proposing a combination of the substrate specificity of exo-glycosidases with the single-molecule sensing capability of nanopores: EXGases (such as β-N-acetylhexosaminidase GlcNAcH and β1,4-galactosidase GalH) selectively hydrolyze specific terminal monosaccharides and glycosidic bonds, while the nanopore captures real-time shifts in current blockage signals before and after hydrolysis, allowing for reverse inference of glycan sequences based on the enzyme’s cleavage specificity. This design not only solves the detection challenges posed by the low charge and difficulty in stretching of glycans but also breaks the traditional method’s dependence on fingerprint libraries through “reverse sequencing,” providing a novel technical pathway for the structural analysis of complex glycans.
Article Abstract
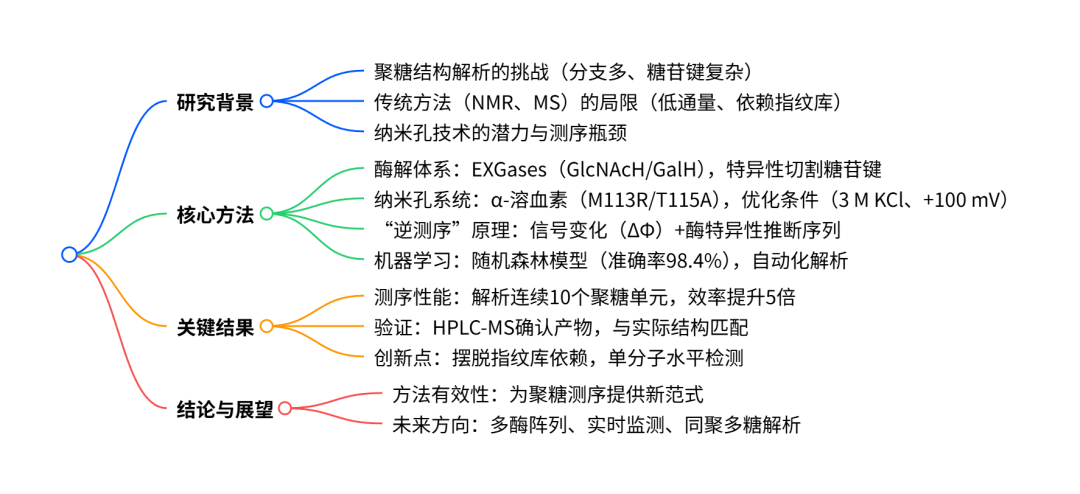
This paper proposes a new strategy for glycan sequencing based on glycosidase-assisted nanopore sensing, where exo-glycosidases (EXGases) gradually hydrolyze specific glycosidic bonds from the non-reducing end of glycans, combined with continuous monitoring of the characteristic current changes of hydrolysis products by α-hemolysin (M113R/T115A) nanopores, achieving precise analysis of glycan sequences. By utilizing a random forest machine learning algorithm, the sequencing accuracy is improved to 98.4%, successfully determining the linkage types of ten consecutive structural units in natural glycan chains (e.g., β1,3- and β1,4-glycosidic bonds), verified by hydrophilic interaction chromatography – high-performance liquid chromatography (HILIC-HPLC) and high-resolution electrospray ionization mass spectrometry (HRESIMS), with sequencing results completely consistent with the actual structures. This strategy introduces the concept of “reverse sequencing,” focusing on changes in electrical signals rather than monosaccharide recognition, freeing itself from the traditional method’s reliance on monosaccharide fingerprint libraries, and achieving over five times the sequencing efficiency compared to traditional NMR and MS methods, providing key feasibility evidence for glycan sequencing at the single-molecule level.
Author Introduction
The author team of this paper comes from the Shanghai Institute of Materia Medica, Chinese Academy of Sciences, Nanjing University, and ShanghaiTech University, covering expertise in glyco-chemistry, nano-biosensing, and machine learning. Corresponding author Bingqing Xia (Shanghai Institute of Materia Medica, Chinese Academy of Sciences) has long focused on glyco-drug development and nanopore detection technology, accumulating extensive experience in glycan structural analysis and nano-sensing system construction; Liuqing Wen (Shanghai Institute of Materia Medica, Chinese Academy of Sciences) specializes in the structural characterization and functional research of carbohydrate-based drugs; Yi-tao Long (Nanjing University) has made significant achievements in single-molecule detection and nanopore technology applications; Zhaobing Gao (Shanghai Institute of Materia Medica, Chinese Academy of Sciences) leads the development and optimization of the glycosidase-nanopore combined system; first author Guangda Yao and others contributed core data in glycan synthesis, nanopore signal analysis, and machine learning model construction, and the team has previously published multiple studies related to glycan nanopore detection in the “J. Am. Chem. Soc.”, laying a solid technical foundation for this work.
Article Approach
The research focuses on the core goal of “breaking through the bottleneck of continuous glycan sequencing” and systematically advances in four steps: First, constructing a glycosidase-nanopore combined experimental system, optimizing the detection conditions of α-hemolysin (M113R/T115A) nanopores (3 M KCl, 10 mM citric acid buffer pH 5.0, +100 mV voltage), and verifying the hydrolysis efficiency of EXGases through thin-layer chromatography (TLC) (0.5 mg/mL enzyme concentration can completely hydrolyze 10 mM glycan substrate within 10 minutes); secondly, using synthetic decasaccharide (Deca, β1,3-linked poly-lactosamine structure) as a model, generating a series of products from nonasaccharide (HS9) to monosaccharide (HS1) through 9 steps of alternating hydrolysis, recording the current blockage amplitude (ΔI₁/I₀) and residence time of each product using nanopores, and preliminarily inferring the sequence based on the enzyme’s substrate specificity; subsequently, developing a random forest machine learning model to extract five signal difference features such as KL divergence and JS divergence, achieving automated identification and sequence analysis of hydrolysis events; finally, verifying the structure and molecular weight of hydrolysis products through HILIC-HPLC and HRESIMS, forming a complete logical chain of “experimental design – signal acquisition – model analysis – result verification” to confirm the reliability of the strategy.
Main Research Content
1. Construction and Condition Optimization of Glycosidase-Nanopore Combined System
Engineered α-hemolysin (M113R/T115A) was selected as the nanopore sensor, constructing a stable lipid bilayer system in 3 M KCl and 10 mM citric acid buffer (pH 5.0). Under these conditions, the open current of the nanopore was 269.50±3.23 pA, and the conductivity was 2458.21±16.96 pS, with no significant stability decline observed during continuous monitoring for 12 hours. Two highly specific exo-glycosidases were screened: β-N-acetylhexosaminidase GlcNAcH (from Bacteroides fragilis) specifically cleaves β1,3-linked GlcNAc, and β1,4-galactosidase GalH (from Streptococcus pneumoniae) specifically cleaves β1,4-linked Gal. The hydrolysis efficiency was verified through TLC: 0.5 mg/mL GlcNAcH can completely hydrolyze 10 mM nonasaccharide (Nona) within 1 minute, and 0.5 mg/mL GalH can completely hydrolyze 10 mM octasaccharide (Octa) within 10 minutes, with no side reaction impurities in the hydrolysis products. The nanopore detection parameters were optimized: when the voltage was +100 mV, the signal strength and pore stability reached a balance; exceeding this voltage would damage the pore structure, while lower voltages would result in insufficient signal blockage amplitude; within a glycan concentration range of 25-100 μM, the signal capture rate increased linearly with concentration, but ΔI₁/I₀ and residence time showed no significant changes, ensuring consistency in signal characteristics during hydrolysis.
2. Glycan Sequence Inference and Verification Based on Electrical Signal Shifts
Using the synthetic decasaccharide (Deca, structure as β1,3-LacNAc repeating unit) as the model substrate, a 9-step alternating enzymatic hydrolysis experiment was designed: the first step added GalH to hydrolyze the terminal β1,4-linked Gal, generating nonasaccharide (HS9); the second step added GlcNAcH to hydrolyze the terminal β1,3-linked GlcNAc, generating octasaccharide (HS8); and so on, until the ninth step generated monosaccharide (HS1). The nanopore continuously monitored the electrical signals of each hydrolysis product, extracting two key parameters: the ΔI₁/I₀ of decasaccharide (S10) was 0.73, nonasaccharide (HS9) was 0.64, octasaccharide (HS8) was 0.47, heptasaccharide (HS7) was 0.39, hexasaccharide (HS6) was 0.34, pentasaccharide (HS5) was 0.37, tetrasaccharide (HS4) was 0.22, and trisaccharide (HS3) was 0.16, with separation ratios of adjacent chain lengths all > 1.25, allowing for clear distinction; for the disaccharide (HS2) and monosaccharide (HS1) where signals were not obvious at +100 mV, the detection condition was switched to Trans side -40 mV, where the ΔI₂/I₁ for disaccharide was 0.54, and the residence time was 10.71 ms, with no interference signals for monosaccharide, achieving full sequence coverage from decasaccharide to monosaccharide. Combining the enzyme’s cleavage specificity, the sequence of decasaccharide was inferred to be β1,3-LacNAc repeating unit, completely consistent with the preset structure during synthesis.
3. Machine Learning-Assisted Automated Sequencing and Method Verification
To achieve automated sequencing and improved accuracy, a dataset containing 114 events was constructed, including 62 “hydrolysis occurred” events (signal differences of adjacent chain length glycans) and 52 “hydrolysis did not occur” events (signal differences of parallel experiments of the same chain length glycans). After balancing the data using the SMOTE algorithm, 80% of the data was used as the training set and 20% as the test set. Five features were extracted: KL divergence (measuring signal distribution differences), JS divergence (normalized distribution differences), EMD (signal distribution distance), OC (signal overlap degree), and BD (signal similarity), training five machine learning models: the random forest model performed best, with a cross-validation accuracy of 98.4%, and feature importance ranking as OC (22.41%) > EMD (22.33%) > BD (20.55%) > KL (18.01%) > JS (16.69%). Based on this model, an automated sequencing process was developed: input the initial signal (Φ) of the unknown glycan, sequentially hydrolyze with different EXGases and detect the signal (Φ’), calculate ΔΦ and input it into the model; if the predicted hydrolysis probability > 60%, determine the terminal monosaccharide and glycosidic bond based on enzyme specificity, update the signal to Φ’ and repeat the steps until disaccharide signals are detected, outputting the complete sequence. Verification through HILIC-HPLC showed that the retention times of each hydrolysis product deviated from the standard by < 0.5 min; HRESIMS verification showed that the measured molecular weights from decasaccharide to monosaccharide matched theoretical values with an error of < 0.01 m/z, further confirming the accuracy of the method.
Illustrated Guide
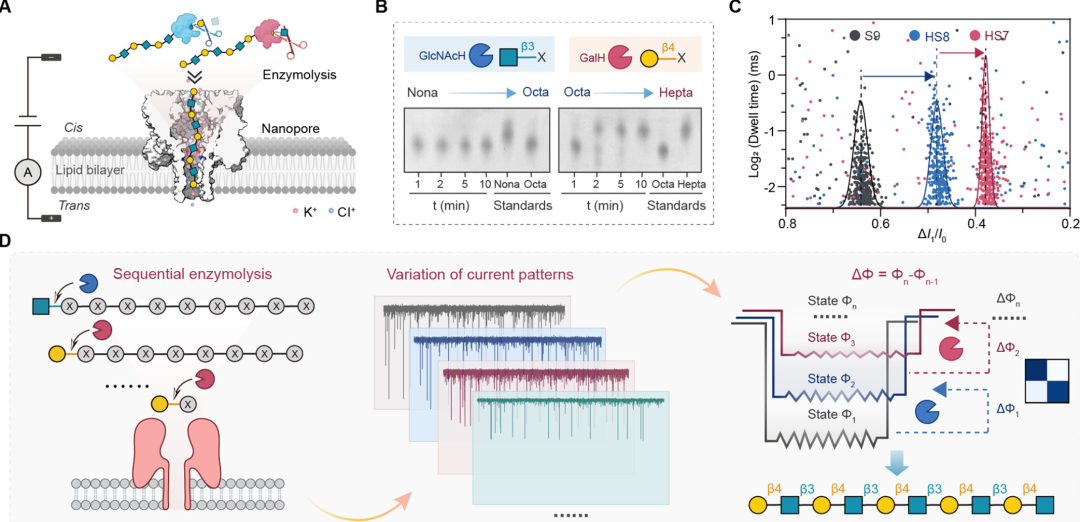
Figure 1: Principle of glycosidase-assisted nanopore sequencing and optimization of hydrolysis conditions. (A) Schematic diagram of the experimental setup: α-hemolysin (M113R/T115A) inserted into the lipid bilayer, glycan hydrolyzed by glycosidase added on the Cis side, blue squares represent GlcNAc, yellow circles represent Gal, blue scissors symbolize the cutting action of GlcNAcH, red scissors symbolize the cutting action of GalH, and the Trans side records ionic current; (B) TLC monitoring of hydrolysis efficiency: 0.5 mg/mL GlcNAcH can completely hydrolyze 10 mM nonasaccharide (Nona) within 1 minute, and 0.5 mg/mL GalH can completely hydrolyze 10 mM octasaccharide (Octa) within 10 minutes, with changes in band intensity at different time points reflecting the hydrolysis process; (C) Scatter plot of Log₂(residence time) and ΔI₁/I₀ for samples S9 (nonasaccharide), HS8 (octasaccharide hydrolysis product), and HS7 (heptasaccharide hydrolysis product), with Gaussian fitting curves showing clear clustering of signals for each sample, with separation ratios all > 2.0; (D) Schematic diagram of the “reverse sequencing” principle: the left side shows nanopore detection of glycans before and after hydrolysis, the middle shows the original current signal trajectory, and the right side shows the reverse inference of terminal monosaccharides and glycosidic bond types based on the change in signal from Φ₁ to Φ₂ (ΔΦ) combined with enzyme specificity.
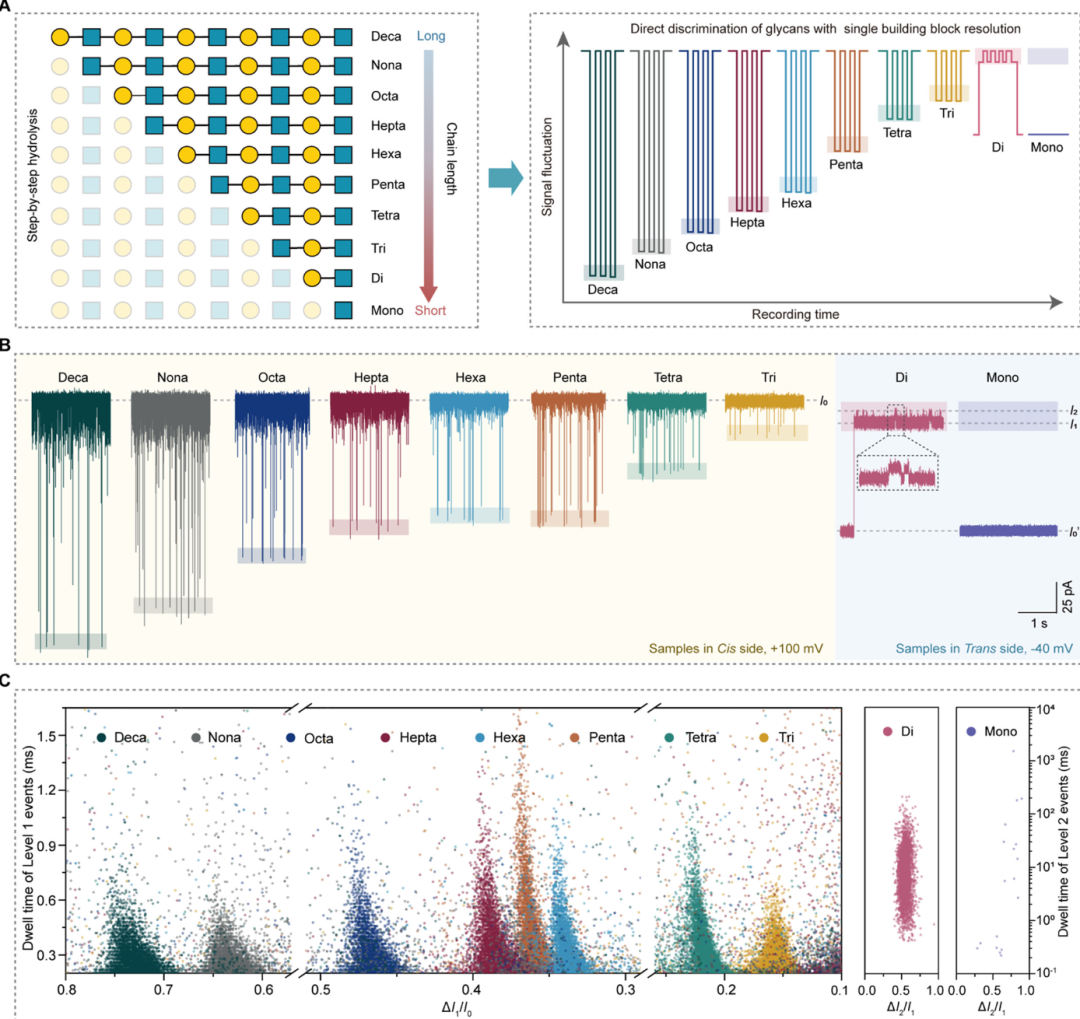
Figure 2: Verification of single-unit resolution from decasaccharide to monosaccharide by nanopore. (A) The left side shows a schematic diagram of the structure from decasaccharide (Deca) to monosaccharide (Mono) (marked according to SNFG symbols), with light-colored symbols representing monosaccharides released during hydrolysis; the right side shows a schematic diagram of single-unit resolution discrimination, with different colored lines representing the characteristic ionic current signals of each glycan; (B) Typical ionic current trajectories: the light yellow area shows the signal of the sample on the Cis side under +100 mV detection conditions (from decasaccharide to trisaccharide), and the light blue area shows the signal of the sample on the Trans side under -40 mV detection conditions (from disaccharide to monosaccharide), showing significant differences in current blockage characteristics of glycans of different chain lengths; (C) Scatter plot of residence time and ΔI₁/I₀ (or ΔI₂/I₁) from decasaccharide to monosaccharide, with each glycan’s signal forming independent clusters, and the signal separation degree of adjacent chain lengths meeting sequencing requirements (separation ratio > 1.25).
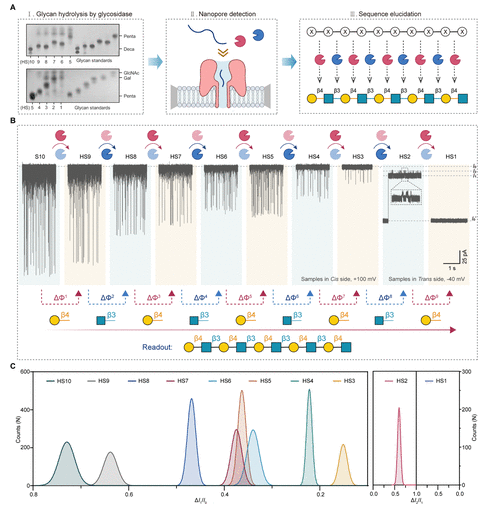
Figure 3: Nanopore glycan sequencing process driven by terminal hydrolysis. (A) Three-step sequencing process: the first step is the decasaccharide (S10) undergoing 9 steps of alternating hydrolysis to generate HS9 to HS1 (TLC verification of hydrolysis products), the second step is nanopore detection of each hydrolysis product, and the third step is sequence analysis based on enzyme specificity; (B) The upper part shows typical ionic current trajectories from S10 to HS1, and the lower part shows the sequence analysis process based on signal changes (ΔΦ), with arrows indicating hydrolysis steps and corresponding monosaccharide types; (C) Gaussian fitting curves of ΔI₁/I₀ (or ΔI₂/I₁) from S10 to HS1, showing a stepwise decrease in signal with the number of hydrolysis steps, consistent with the trend of glycan chain length shortening.
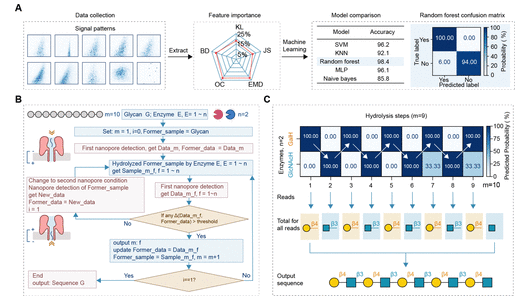
Figure 4: Machine learning-assisted automated sequencing. (A) Workflow: first, collect signal data before and after hydrolysis, extract five feature differences: KL divergence, JS divergence, Earth mover distance (EMD), overlap coefficient (OC), and Bhattacharyya distance (BD), with a radar chart showing the importance of each feature in the random forest model; compare the cross-validation accuracies of five machine learning models (SVM, KNN, random forest, naive Bayes, MLP), with the random forest achieving the highest accuracy (98.4%); the right side shows the confusion matrix of the random forest model, with prediction accuracies of “hydrolysis occurred” and “did not occur” being 100% and 94%, respectively; (B) Sequencing algorithm flowchart: variable m represents the number of hydrolysis steps and monosaccharide positions, f represents the enzyme type, iteratively comparing signals before and after hydrolysis, and model prediction probabilities (threshold 60%), updating reference data and initial samples until the complete sequence is output; (C) Heatmap of decasaccharide sequencing: color depth represents the probability of hydrolysis occurrence, with white arrows indicating hydrolysis paths, ultimately outputting a sequence that completely matches the actual β1,3-LacNAc repeating structure.
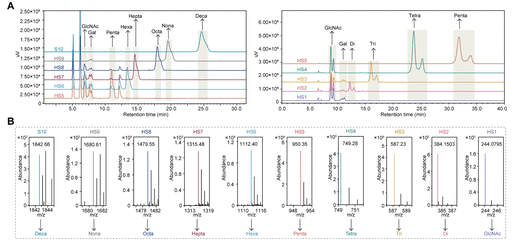
Figure 5: HPLC-MS verification of hydrolysis products. (A) HILIC-HPLC chromatogram: using two elution conditions (60% acetonitrile for decasaccharide to pentasaccharide, 70% acetonitrile for pentasaccharide to monosaccharide), the retention times of each hydrolysis product were consistent with those of standard samples (e.g., decasaccharide retention time 24.03±0.58 min), with arrows marking the chromatographic peaks corresponding to each glycan; (B) HRESIMS spectrum: theoretical value of decasaccharide [M-H]⁻ 1842.66 m/z, measured value 1842.66 m/z, theoretical value of nonasaccharide [M-H]⁻ 1680.61 m/z, measured value 1680.61 m/z, with the molecular weights of other products (from octasaccharide to monosaccharide) also completely matching theoretical values, confirming the correctness of the hydrolysis products.
Future Outlook
Future research can expand the application range and performance of this strategy from three aspects: first, developing a multi-enzyme array system, integrating more specific exo-glycosidases such as α-fucosidase and α-mannosidase to cover α-glycosidic bonds and rare monosaccharides (e.g., fucose, mannose), enhancing the universality of sequencing for unknown complex glycans; second, optimizing real-time sequencing processes by physically separating glycosidases (e.g., using magnetic beads) from the nanopore detection system to address the inhibition of enzyme activity by high salt concentrations and interference of enzyme proteins with nanopores, achieving dynamic continuous sequencing; third, addressing the repetitive sequence challenges of homopolysaccharides (e.g., glucan, cellulose) by combining endo-enzymes to generate characteristic fragments or regulating hydrolysis kinetics (e.g., controlling hydrolysis time) to infer the lengths of repeating units, expanding the technical application scenarios. Additionally, this method can be combined with in situ cryo-electron microscopy and atomic force microscopy to observe the dynamic processes of glycan hydrolysis and nanopore translocation in real-time, providing new tools for studying glycan-enzyme interactions at the single-molecule level, promoting its practical applications in disease biomarker detection and quality control of glyco-drugs.
Note: The content of this public account is intended for communication and learning purposes, not for commercial use. If there is any infringement, please contact us for negotiation. Experts and scholars are welcome to submit articles to share the latest research results in AI + materials!
Submission Email: [email protected]
Group Chat: AI + Materials Research Group
How to Join: Add the editor’s WeChat: FC13296996229, please note: organization-name-research direction, and the editor will review and invite you to join the group.
Editor’s Note: 6.4 Spring Doctor Growth Camp

Public Account丨AI-empowered Materials
Editor丨Dr. Chun


(Dr. Chun)
Editorial Information

READING BOOKS



WeChat ID丨Yao Min
WeChat ID丨FC13296996229