 For more exciting content, please click the blue text above to follow us!I happen to have this course,
Python Empirical Indicator Construction and Text Analysis Course
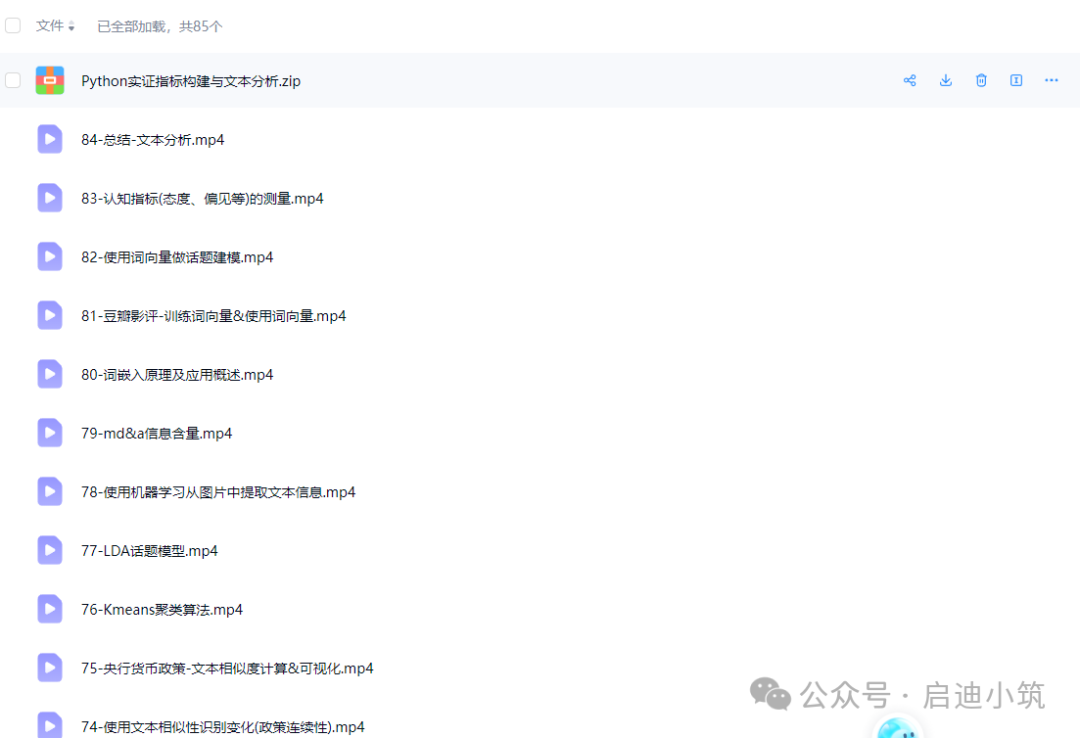

In the modern field of data analysis, Python has become an important tool for conducting empirical research and text analysis. With its flexible programming capabilities, Python can assist analysts in constructing empirical indicators, performing data mining, and revealing important information hidden in big data through text analysis. This article will explore how to utilize Python for empirical indicator construction and text analysis, helping to enhance the efficiency and accuracy of data analysis.
1. Empirical Indicator Construction The construction of empirical indicators typically refers to establishing indicators that can quantify and measure certain variables in economics, finance, social sciences, or other fields through data analysis. Python’s powerful data processing capabilities, especially when combined with libraries like Pandas and NumPy, can efficiently accomplish this task.
-
Data Preparation and Cleaning Before starting to construct empirical indicators, it is necessary to extract relevant data from data sources and perform cleaning and processing. The Pandas library in Python provides rich functionalities to handle missing values, duplicate values, and irregular data.
-
Constructing Empirical Indicators After data preparation and cleaning, we can begin constructing empirical indicators. For example, if we want to create an indicator that reflects company performance, such as the Financial Health Index (FHI), we can construct a weighted indicator based on multiple variables from the company’s financial statements, such as debt-to-asset ratio, net profit margin, and current ratio.
-
Statistical and Visualization Analysis After completing the indicator construction, we need to perform statistical analysis to examine distribution, trends, and other information. The Matplotlib and Seaborn libraries in Python can help us visualize the data.
2. Text Analysis Text analysis is the process of using computer science and statistical methods to process, analyze, and extract valuable information from text data. In fields such as finance, public opinion analysis, and market research, text analysis has become an indispensable tool.
-
Text Preprocessing Text data often contains a lot of noise, so text preprocessing is the first step in text analysis. Common preprocessing steps include removing stop words, tokenization, stemming, and lemmatization. Python’s NLTK and spaCy libraries provide strong support for text preprocessing.
-
Text Feature Extraction In text analysis, common methods for text feature extraction include term frequency (TF) and inverse document frequency (IDF). The scikit-learn library in Python provides powerful text vectorization capabilities.
If you need assistance, please contact us.