1. Industry Background and Core Pain Points in UTG Thickness Measurement
Ultra-Thin Glass (UTG) is the core substrate for foldable screen terminals, with thickness typically controlled between 20-100μm (some high-end models can be below 10μm), combining flexibility, mechanical strength, and optical transparency. The uniformity of UTG thickness directly determines the bending life of the foldable screen (e.g., 200,000 folds without cracking), display flatness, and touch sensitivity. If the thickness deviation exceeds ±2μm, it may lead to stress concentration during folding, causing glass cracking; if the local thickness is too thin, it will also reduce the screen’s impact resistance.

Currently, UTG thickness measurement faces three core pain points that traditional measurement technologies struggle to overcome:
- Destructive Nature of Contact Measurement: Contact tools such as mechanical micrometers and thickness gauges apply pressure to ultra-thin glass (even a force of 0.1N can cause more than 5% deformation in 20μm UTG), causing irreversible damage and cannot cover dynamic thickness measurement under flexible bending conditions;
- Limitations of Traditional Optical Methods: Although laser interferometry is non-contact, it requires extremely high surface flatness of UTG (if there are nano-level scratches on the surface, it will cause interference fringe disorder) and cannot distinguish between the thickness of UTG and surface coatings (such as anti-fingerprint films and touch layers); ultrasonic thickness measurement methods have measurement errors exceeding 10% due to UTG thickness being far below the ultrasonic wavelength (common ultrasonic wavelengths ≥200μm), failing to meet accuracy requirements;
- Insufficient Adaptability for Dynamic Measurement: The UTG production line requires real-time online detection (speed ≥1m/min), while traditional offline measurements (such as laboratory microscopes) are inefficient (single sample measurement takes >5min) and cannot feedback thickness fluctuations during the production process.
In this context, spectral confocal displacement sensors have become the optimal technical solution for UTG thickness measurement due to their non-contact, sub-micron precision, multi-layer transparent material identification capability, and high dynamic response characteristics. The following sections will detail the technical solutions and practical verification based on the Hongchuan Technology LTC series spectral confocal sensors.
2. Analysis of Spectral Confocal Technology and Its Adaptability to UTG Thickness Measurement
The core principle of spectral confocal technology is “wavelength-encoded distance”: the sensor emits a continuous spectrum of polychromatic light, which, after passing through a chromatic aberration lens, focuses different wavelengths of light at different axial distances; the light reflected from the surface of the measured object is analyzed by a spectrometer, and the relative position between the sensor and the measured object is calculated based on the focusing distance corresponding to the peak wavelength. The adaptability of this technology to UTG characteristics is mainly reflected in the following four points:
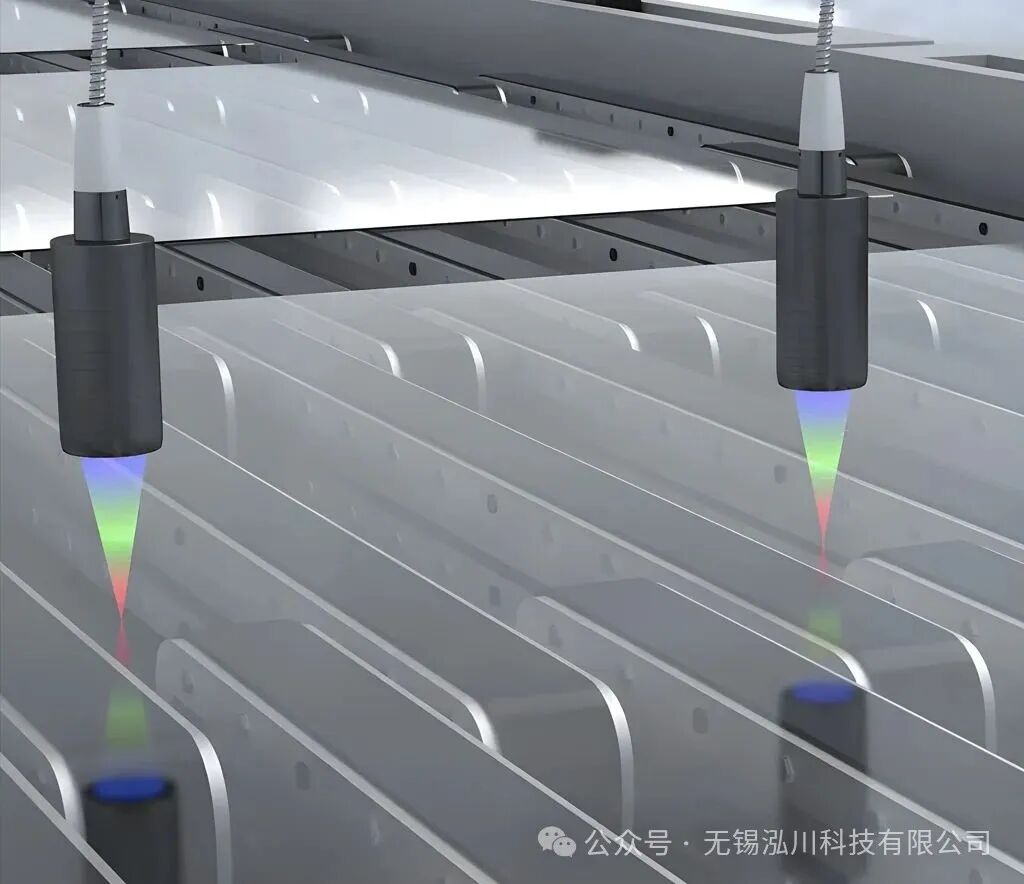
1. Precision Matching: Sub-Micron Level Error Meets UTG Thickness Measurement Needs
The thickness tolerance of UTG typically requires ±0.5μm, and the core parameters of Hongchuan LTC series ultra-precision sensors fully meet this requirement:
- Linear Error: LTC100 (ultra-precision type) linear error < ±0.03μm, far below the tolerance requirement of UTG;
- Static Noise: 3nm (root mean square deviation of 10,000 sets of continuous data collection), ensuring the stability of thickness measurement;
- Repeatability: 0.012μm (core advantage of the document), the deviation of multiple measurements at the same point can be negligible.
2. Material Adaptability: Accurate Identification of Transparent / Multi-Layer Structures
UTG is often a composite structure of “glass substrate + surface coating” (e.g., UTG + 10μm anti-fingerprint film), and spectral confocal technology can distinguish the thickness of each layer by analyzing the reflected wavelengths at different interfaces—this feature is clearly marked in the parameters of Hongchuan sensors as “adaptable to transparent / translucent / film-layer measured objects“, and supports “multi-layer / laminated glass thickness measurement” (controller function description).
3. Non-Contact Feature: Zero Damage Protection for Flexible Substrates
The sensor has no physical contact with the UTG surface, measuring only through optical signal interaction, avoiding the bruising or wrinkling of ultra-thin glass caused by contact tools; at the same time, the focused light spot of the LTC series can reach a minimum of Φ1.7μm (LTC100), allowing precise measurement of small local areas of UTG (e.g., edges of folding areas) without affecting surrounding structures.
4. Dynamic Response: Meeting Offline / Online Measurement Needs
The LTC series controllers (e.g., LT-CCS single-channel, LT-CCF four-channel) have a maximum sampling frequency of up to 10kHz (single-channel), allowing for the collection of one data point per millimeter even in online detection scenarios on the UTG production line (conveyor speed 1m/min), fully covering the thickness distribution of the sample.
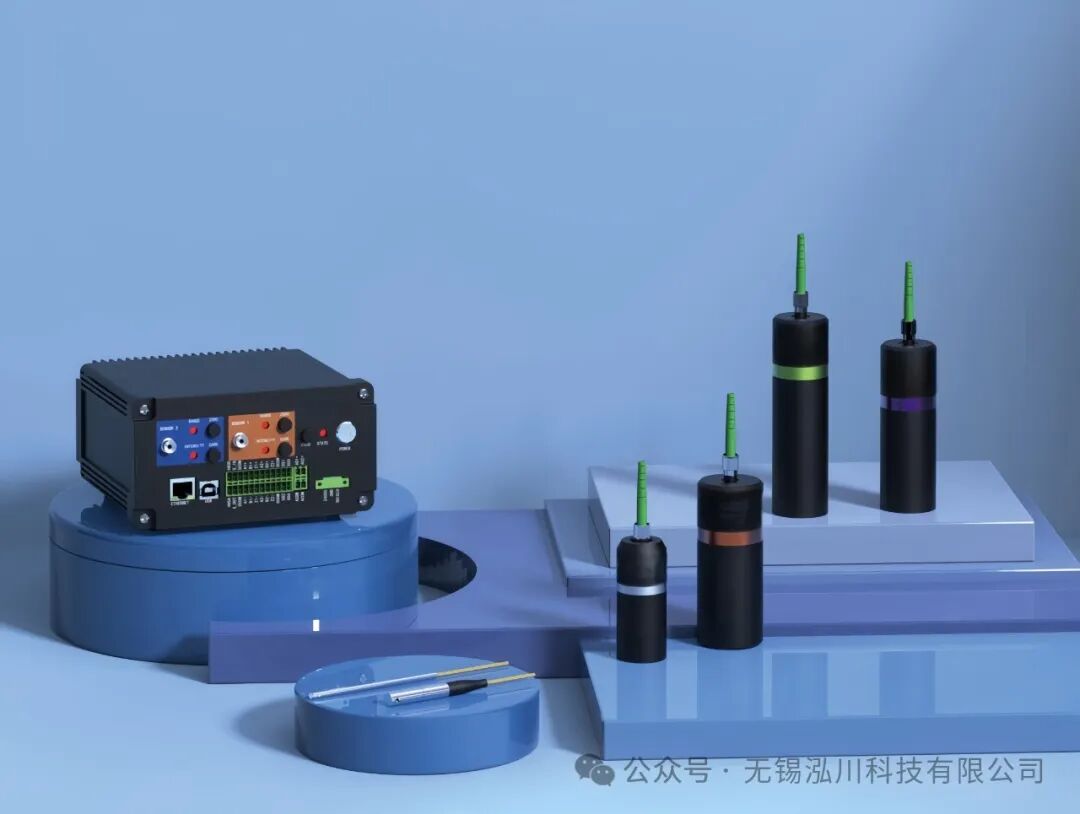
3. Complete Technical Solution Design for UTG Thickness Measurement
Based on the Hongchuan LTC series sensors, two solutions are designed: “offline high-precision detection” and “online dynamic monitoring”, suitable for laboratory R&D verification and production line quality control, respectively. The following will focus on the offline solution, with the online solution supplemented in the “Technical Extension” section.
1. Equipment Selection: Parameter Matching Based on UTG Characteristics
The core measurement requirements for UTG are “ultra-thin (20-100μm), high precision (±0.5μm), local measurement (spot size <5μm)”. Based on the parameter table of Hongchuan LTC series, the selection is as follows:
| Device Type | Model Selection | Selection Basis |
|---|---|---|
| Spectral Confocal Sensor | LTC100 (Ultra-Precision Type) | ① Measurement range ±0.05mm (±50μm), covering mainstream 20-50μm UTG; ② Focused light spot Φ1.7μm, suitable for local measurement; ③ Static noise 3nm, linear error <±0.03μm, meeting precision requirements |
| Controller | LT-CCS | ① Single-channel design, suitable for offline measurement with a single sensor; ② Single-channel sampling frequency Max 10kHz, supporting high-frequency data collection; ③ Supports USB / Ethernet connection, compatible with upper computer software |
| Positioning Platform | Precision XY Electric Platform (Accuracy ±1μm) | Realizes multi-point automatic measurement of UTG samples, avoiding errors from manual movement |
| Calibration Piece | Standard Quartz Plate (20μm, 50μm, 100μm, n=1.54) | Used for sensor calibration, correcting refractive index and system errors |
| Upper Computer Software | TSConfocalStudio | Hongchuan customized software, supporting parameter settings, data collection, thickness distribution visualization, and error analysis |
2. System Setup: Hardware Connection and Functional Interaction
The system consists of four parts: “sensor – controller – upper computer – positioning platform”, with specific connection and interaction logic as follows:
-
Hardware Connection:
- The sensor LTC100 connects to the “SENSOR1” port of the controller LT-CCS via a dedicated optical fiber cable;
- The controller connects to the upper computer via Ethernet (100BASE-TX) (installing TSConfocalStudio V3.0 or above);
- The encoder signal of the positioning platform connects to the “encoder input” port of the controller, achieving synchronization of “platform movement – sensor trigger” (avoiding data blur during movement);
- The sensor probe is fixed on a gantry to ensure the measurement axis is perpendicular to the UTG surface (tilt error ≤0.1°, can be calibrated with a level).
Functional Interaction Logic:The upper computer sends a “measurement start” command → the positioning platform moves to preset points (e.g., 5×5 grid, a total of 25 points, avoiding a 1mm area at the edge of UTG) → the platform encoder triggers the controller → the sensor collects thickness data at the current point → data is transmitted back to the upper computer in real-time → the platform moves to the next point, repeating until all points are measured.
3. Testing Process: Standardized Steps from Calibration to Data Output
Step 1: System Calibration (Core Step to Ensure Measurement Accuracy)
- Purpose: To correct the influence of the UTG refractive index (n≈1.5) on the optical path and the system error of the sensor;
- Operation:
- Fix a 20μm standard quartz plate (n=1.54) at the center of the positioning platform, ensuring the surface is clean and free of stains;
- Select “Calibration Mode” in TSConfocalStudio, input the standard thickness “20μm” and refractive index “1.54”;
- Click “Auto Calibration”, the sensor collects the reflected wavelengths from the upper and lower surfaces of the quartz plate, calculates the deviation between the actual measurement value and the standard value, and generates a calibration curve (e.g., measured value = 0.998 × true value + 0.02μm);
- Repeat calibration with 50μm and 100μm quartz plates to verify the linearity of the calibration curve (R²≥0.9999), completing the calibration.
Step 2: UTG Sample Preparation
- Cleaning: Wipe the UTG surface with a lint-free cloth soaked in isopropanol to remove fingerprints and dust (scattered light reflection can increase measurement errors by more than 30%);
- Fixing: Lay the UTG flat in the vacuum adsorption area of the positioning platform, turn on the vacuum (suction 0.02MPa) to avoid sample wrinkling or movement.
Step 3: Measurement Parameter Settings (Configured in TSConfocalStudio)
| Parameter Category | Setting Value | Setting Reason |
|---|---|---|
| Sampling Frequency | 5kHz | Balance measurement speed and accuracy (10kHz is faster but slightly increases noise; 5kHz ensures that 100 sets of data collection at a single point takes 0.02s) |
| Number of Measurement Points | 5×5=25 points | Covers the effective area of UTG (e.g., 20mm×20mm sample), reflecting thickness uniformity |
| Data Processing Method | Median Filtering (100 sets of data) | Excludes outliers (e.g., extreme values caused by surface scratches), improving data stability |
| Thickness Unit | μm | Adapted to the ultra-thin characteristics of UTG |
| Alarm Threshold | Upper limit 51μm, lower limit 49μm | If the target thickness of the sample is 50μm, exceeding the threshold will be marked as “unqualified” |
Step 4: Automatic Measurement and Data Output
- Start Measurement: Click “Start Measurement” on the upper computer, the system runs automatically according to the preset process, displaying the thickness values at each point in real-time;
- Data Output: After measurement completion, the software automatically generates three types of results:
- Numerical Report: Thickness values, average, and standard deviation of 25 points (e.g., average 49.8μm, standard deviation 0.3μm);
- Thickness Distribution Heat Map: Displays thickness differences on the UTG surface with a color gradient (red for thick areas, blue for thin areas);
- Error Analysis Chart: Compares the measured values with the target value (50μm) and marks the point with the maximum deviation (e.g., 49.5μm, deviation -0.5μm).
4. UTG Thickness Data Calculation Algorithm: From Principles to Error Correction
The core of spectral confocal thickness measurement is the precise conversion of “wavelength – distance”, which needs to be designed based on the structural characteristics of UTG (single-layer / multi-layer) and corrected for actual interference factors.
1. Core Formula for Single-Layer UTG Thickness Calculation
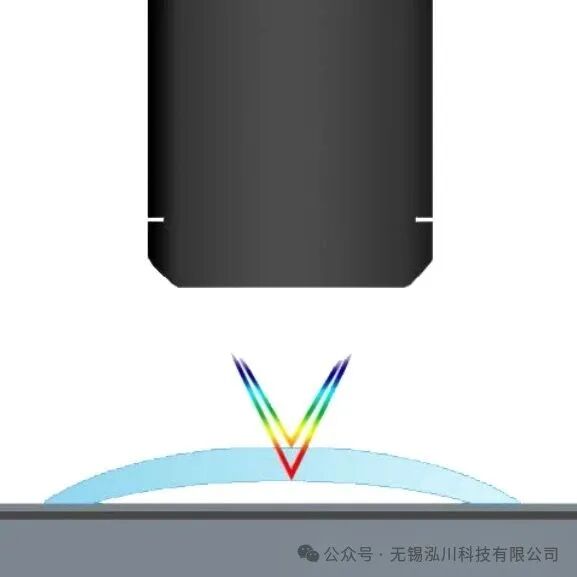
When UTG is a single layer of transparent glass, the sensor will detect two key reflective surfaces:Air – Upper Surface of UTG and UTG – Lower Surface of the Stage (Quartz Material, Transparent). Let:
- λ₁: Peak wavelength of the reflected light from the upper surface, corresponding to the distance H₁ from the sensor to the upper surface;
- λ₂: Peak wavelength of the reflected light from the lower surface, corresponding to the distance H₂ from the sensor to the lower surface;
- n: Refractive index of UTG (measured value 1.502, at 25℃ environment);
Since the optical path of light in UTG is “physical thickness d × refractive index n”, and the sensor measures the distance difference in air, the thickness calculation formula is:d = |H₁ – H₂| / n
Example Calculation:
If the sensor measures H₁=10.000mm, H₂=9.950mm, then the distance difference |H₁-H₂|=0.050mm=50μm; substituting n=1.502 gives d=50μm / 1.502≈33.3μm (i.e., the thickness of UTG at this point is 33.3μm).
2. Thickness Separation Algorithm for Multi-Layer Structures (UTG + Coating)
If the UTG surface is coated with a 10μm anti-fingerprint film (n=1.45), there will be three reflective surfaces: Air – Coating (λ₁→H₁), Coating – UTG (λ₂→H₂), UTG – Stage (λ₃→H₃). At this point, the “wavelength peak separation” algorithm is needed to distinguish each layer:
- The spectrometer analyzes the reflected spectrum, identifying three independent wavelength peaks (λ₁, λ₂, λ₃), excluding stray light interference (using the software’s “background light subtraction” function);
- Calculate the thickness of each layer separately:
- Coating thickness d₂ = |H₁ – H₂| / n₂ (n₂=1.45);
- UTG thickness d₁ = |H₂ – H₃| / n₁ (n₁=1.502);
3. Key Error Correction Strategies
In actual measurements, errors mainly come from “positioning tilt”, “environmental light interference”, and “surface unevenness”, which need targeted corrections:
- Correction of Positioning Tilt Error: If the positioning platform is tilted θ (e.g., 0.2°), the measured distance difference will be larger (Δd = d × sinθ). Correction method: Install a dual-axis tilt sensor on the platform to collect θ values in real-time, and the software automatically compensates the thickness value:d correction = d measured / cosθ;
- Correction of Environmental Light Interference: Workshop LED light sources can produce stray light, causing the reflected spectral peaks to blur. Correction methods: ① Add a light shield to the sensor probe; ② Set a “dynamic threshold” in the software to retain only spectral signals with intensity >0.8V (normal reflected signal intensity >1.2V, stray light <0.5V);
- Correction of Surface Unevenness: If the UTG surface has nano-level protrusions, it will cause fluctuations in single-point data. Correction method: Increase the number of single-point collections from 100 sets to 200 sets, using the “3σ criterion” to exclude outliers (removing data exceeding the average ±3 times the standard deviation), then taking the average.
5. Practical Verification and Comparison of Technical Advantages
1. Practical Data and Accuracy Verification
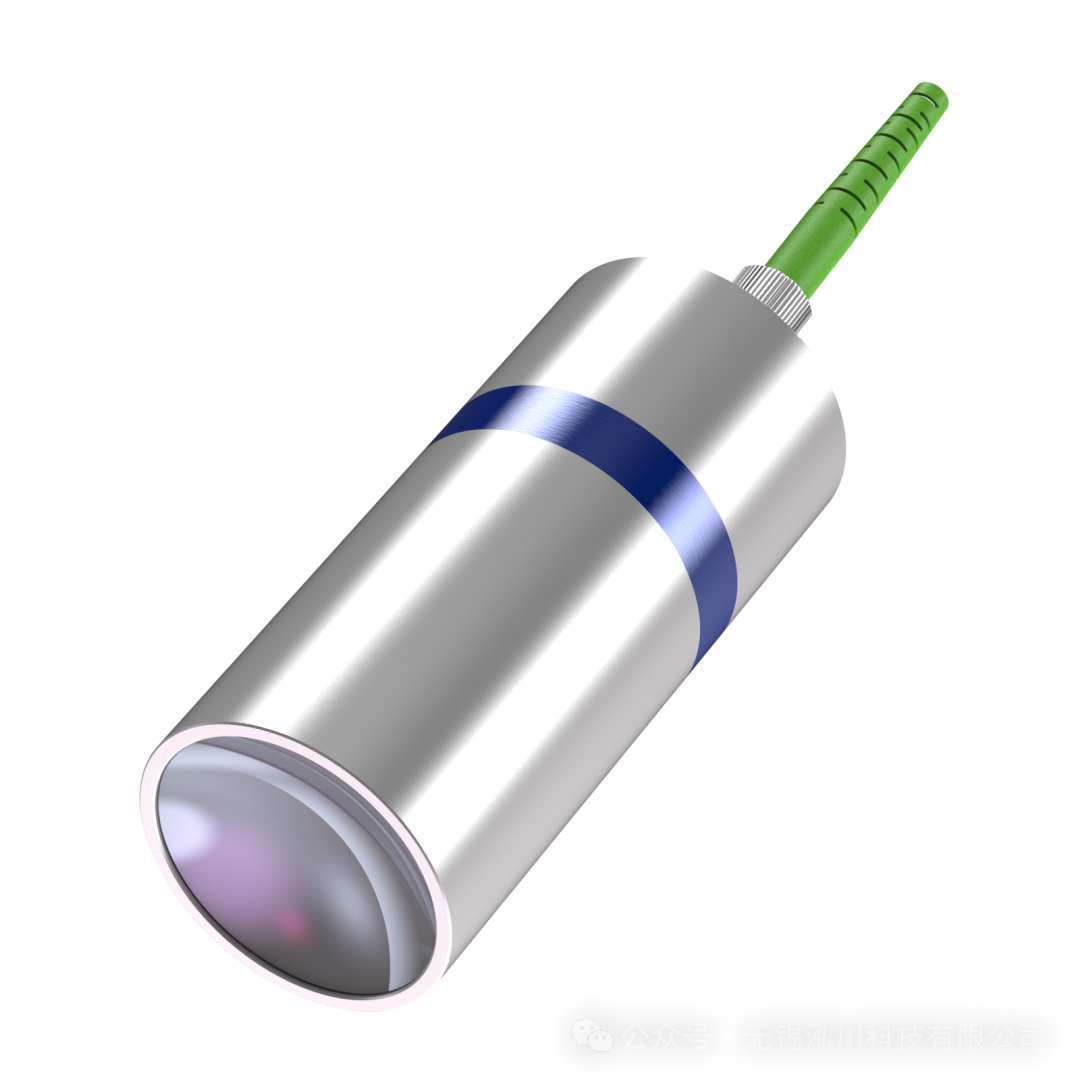
Using a UTG sample with a target thickness of 50μm from a certain brand, measurements were compared between the LTC100 sensor and a laser interferometer (industry benchmark device), with the following results:
| Measurement Index | Spectral Confocal Sensor (LTC100) | Laser Interferometer (Benchmark) | Deviation Value |
|---|---|---|---|
| Average Thickness | 49.8μm | 49.7μm | +0.1μm |
| Maximum Thickness | 50.4μm | 50.3μm | +0.1μm |
| Minimum Thickness | 49.5μm | 49.4μm | +0.1μm |
| Standard Deviation | 0.3μm | 0.2μm | +0.1μm |
| Single Sample Measurement Time | 2min | 15min | Efficiency Improvement 7.5 Times |
Conclusion: The measurement deviation of the spectral confocal sensor is ≤0.1μm, meeting the UTG ±0.5μm tolerance requirement, and the measurement efficiency is far higher than that of the laser interferometer.
2. Core Advantages Compared to Traditional Thickness Measurement Technologies
| Technology Type | Accuracy | Contact Nature | Multi-Layer Recognition Capability | Dynamic Response | Risk of Damage to UTG |
|---|---|---|---|---|---|
| Spectral Confocal (LTC100) | ±0.1μm | Non-Contact | Supports (up to 3 layers) | 10kHz | None |
| Laser Interferometer | ±0.05μm | Non-Contact | Not Supported | 1kHz | None (but low efficiency) |
| Mechanical Micrometer | ±2μm | Contact | Not Supported | Offline | High (prone to bruising) |
| Ultrasonic Thickness Gauge | ±5μm | Contact | Not Supported | 5kHz | Medium (requires coupling agent) |
6. Technical Extension: Spectral Confocal Applications Throughout the UTG Lifecycle
In addition to static thickness measurement, based on different models of the LTC series, spectral confocal technology can cover all scene requirements from R&D to production of UTG:
1. Dynamic Thickness Measurement in Flexible Bending State
Foldable screen UTG needs to verify thickness changes during the bending process (e.g., stress thickness when the folding radius is 3mm), and can use LTC2400 (Ultra-Large Angle Type, ±60° Measurement Angle), in conjunction with a bending testing machine:
- The sensor is fixed to the side of the bending machine, covering the bending surface of UTG at a 60° angle;
- The bending machine folds at a frequency of 10 times/minute, and the sensor collects thickness data at a sampling rate of 5kHz, analyzing the slight changes in thickness during bending (usually <0.2μm, if exceeding 0.5μm, there is a risk of cracking).
2. Online Full Inspection on Production Line
The UTG production line requires 100% online detection, and can use LT-CCH-16 (16-Channel Controller) + 16 LTC400 Sensors (measurement range ±0.2mm, covering 100μm UTG):
- 16 sensors are evenly arranged along the width of the production line (spacing 5mm), covering the full width of UTG;
- Conveyor speed 1m/min, sensors collect data at a sampling rate of 4kHz (maximum sampling rate for 16 channels);
- The controller compares thickness thresholds in real-time, and unqualified products (e.g., thickness >51μm) trigger a mechanical arm for automatic removal, achieving a detection efficiency of 60 pieces/minute.
3. Edge Thickness Uniformity Detection
The thickness uniformity in the 1mm edge area of UTG directly affects the folding life, and can use LTCR1500 (Side Emission Compact Type, 90° Side Emission):
- The sensor is installed laterally, penetrating below the edge of UTG, measuring thickness within the range of 0.1-1mm at the edge;
- In conjunction with a precision rotating platform, a 360° edge scan is performed, generating an edge thickness distribution curve to identify any risks of “edge being too thin” (e.g., <48μm).
7. Conclusion and Outlook
Based on the Hongchuan LTC series spectral confocal sensors, the UTG thickness measurement solution, through the core advantages of “sub-micron precision + non-contact measurement + multi-layer recognition”, addresses the pain points of traditional technologies, achieving “high precision, high efficiency, and no damage” in UTG thickness measurement. From practical data, the measurement deviation of this solution is ≤0.1μm, with efficiency improved 7.5 times compared to laser interferometers, meeting the dual demands of UTG laboratory R&D and production line full inspection.
In the future, as UTG develops towards ultra-thinness below 10μm, further optimization of the sensor’s light spot size (e.g., <1μm) and static noise (<1nm) will be required. The Hongchuan “customizable models” (mentioned in the document to support reference distances of 1-500mm and light spots of 1-100μm) already have the technical reserves to adapt to the measurement needs of thinner UTG, providing key detection support for the technological upgrade of the foldable screen industry.