The oscilloscope is the most common instrument for electronic engineers, and many people liken it to the “eyes” of an engineer, which sufficiently illustrates how important oscilloscopes are to engineers.
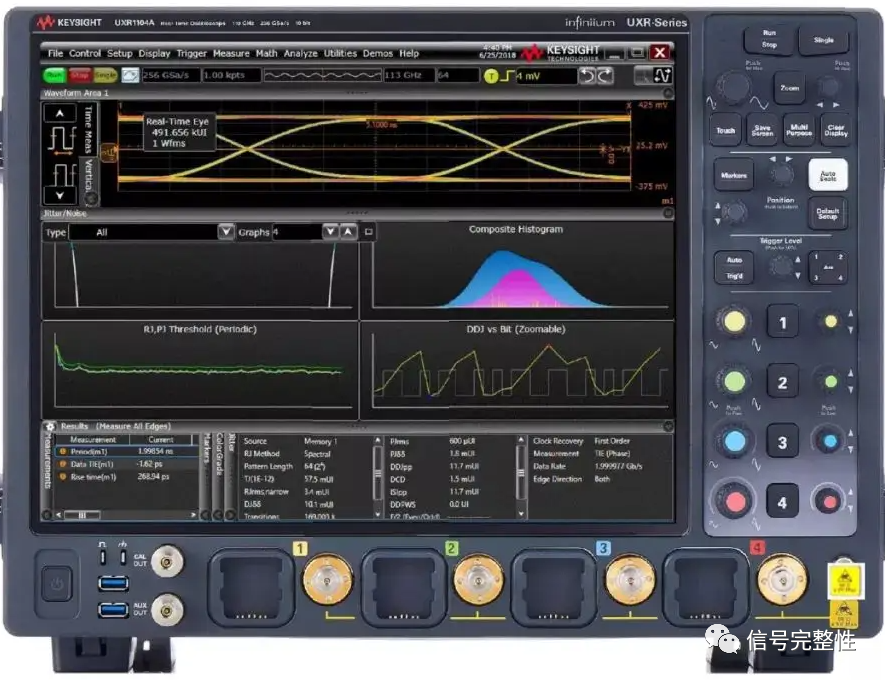
How is the signal displayed on the oscilloscope screen? On the oscilloscope, the signal transmission goes through a series of resistors and capacitors inside the probe. It then enters the oscilloscope, where the signal is modulated by the analog input signal modulation module. Depending on the size of the signal, it is amplified or reduced accordingly to fit within the dynamic range of the analog-to-digital converter (ADC). The analog signal is converted into digital data (1s and 0s) within the ADC module. Meanwhile, the trigger module compares the signal with specified trigger conditions. The trigger conditions inform the time base module when to capture the digital data and save it to the circular acquisition memory.The digital signal processing module (DSP) analyzes the digital data, reconstructs the waveform, and displays it on the screen.
For all oscilloscopes, once the signal is displayed, the next step is to perform the corresponding measurements. Oscilloscopes now have extremely rich built-in measurement functions, allowing engineers to quickly analyze the amplitude and time parameters of waveforms. Examples of these basic measurements include:
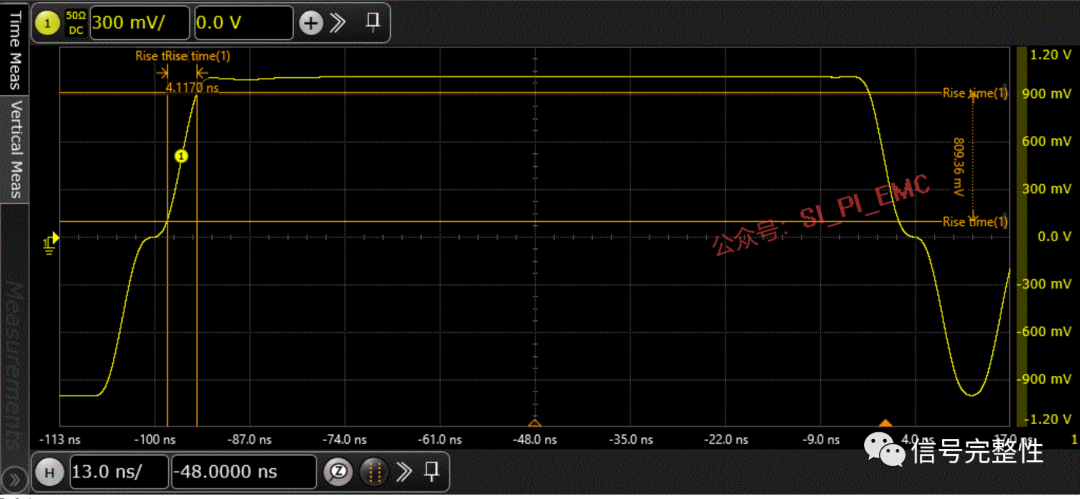
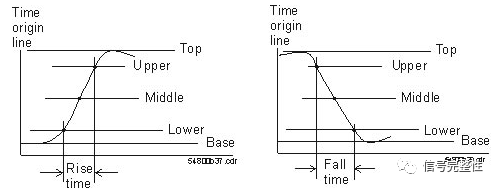
Rise Time: The rise time is the time at the upper threshold minus the time at the lower threshold of the edge you are measuring. The fall time is similar, which is the time at the lower threshold minus the time at the upper threshold of the edge you are measuring.
Pulse Width: The pulse width is the time from the midpoint of the first rising edge to the midpoint of the next falling edge.
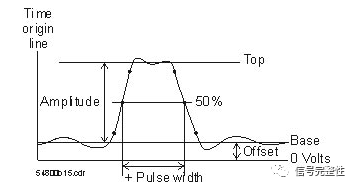
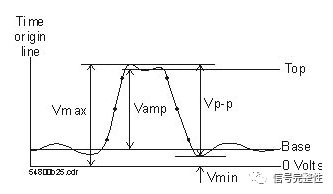
Amplitude and Other Voltage Measurements: This is the measurement of the amplitude displayed by the waveform. Typically, you can also measure peak-to-peak voltage, maximum voltage, minimum voltage, and average voltage.
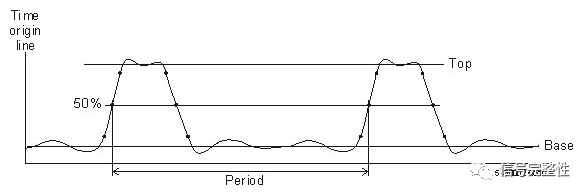
Period/ Frequency: The period is defined as the time between two consecutive crossing points of the midpoint voltage. The frequency is defined as 1/period.
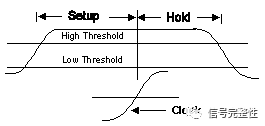
Setup and Hold Time: The setup time is the minimum time that data needs to remain stable before the clock edge arrives. The hold time is the minimum time that data needs to remain stable after the clock trigger event arrives.
 ,
,
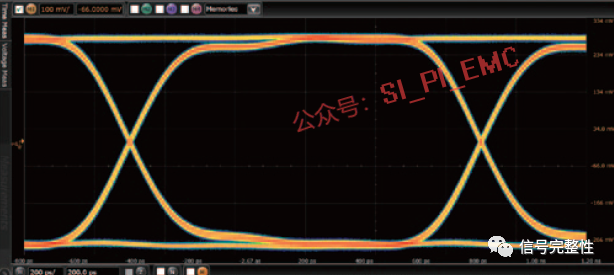
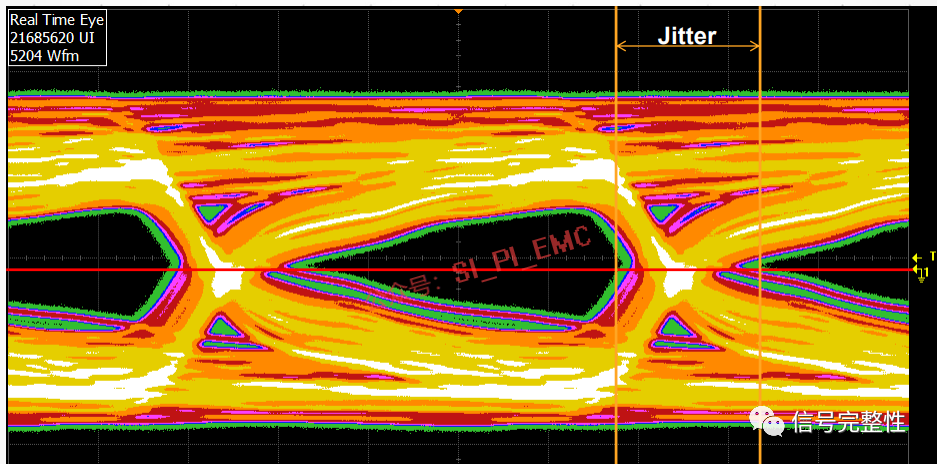
Eye Diagram: The eye diagram is simply the overlay of a series of pulse signals (000, 001, 010, 011, 100, 101, 110, 111) received at the end on a high-speed oscilloscope to form an eye diagram. If an eye diagram template is added, it can quickly assess whether the signal meets bus or system requirements.
There are many other measurements on the oscilloscope, such as duty cycle, offset, noise, jitter, and so on. Here, we only provide some basic measurement concepts.
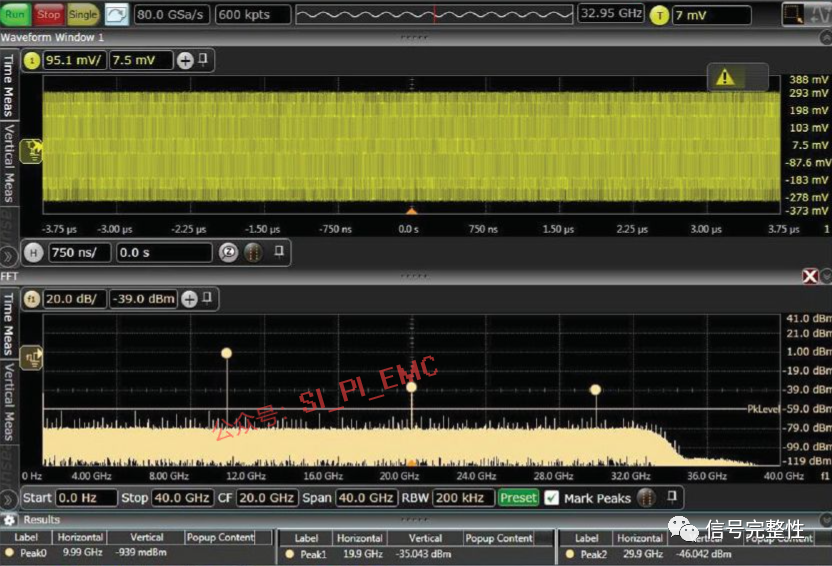
Traditionally, the parameters measured by oscilloscopes are time-domain parameters. However, with the development of technology, oscilloscopes have diversified, and some oscilloscopes can also measure frequency-domain parameters. Especially in power integrity and EMC analysis, time-domain signals are often converted into frequency-domain curves for analysis. This helps to observe which frequency bands have issues and subsequently “prescribe the right remedy” to solve the problems.
No matter what, the oscilloscope is always just a tool; to analyze actual problems, engineers need to look beyond the phenomenon to find the essence.