✅ Author Introduction: A research enthusiast and Matlab simulation developer, skilled in data processing, modeling simulation, program design, obtaining complete code, reproducing papers, and scientific simulation.
🍎 Previous reviews, follow the personal homepage:Matlab Research Studio
🍊 Personal motto: Investigate things to gain knowledge, complete Matlab code and simulation consultation available via private message.
🔥 Content Introduction
In the vast field of signal processing, accurately decomposing signals and clearly presenting their inherent characteristics is crucial. Symplectic Geometry Modal Decomposition (SGMD), as an innovative method that integrates symplectic geometry theory with signal processing technology, stands out due to its unique mathematical structure and efficient decomposition capabilities. Visualizing the signal components after SGMD decomposition provides an intuitive and powerful tool for us to deeply understand the essence of signals and uncover potential information.
1. SGMD Symplectic Geometry Modal Decomposition: Technical Core Analysis
1.1 Basics of Symplectic Geometry Theory
Symplectic geometry is a special type of differential geometry that uses symplectic forms as its core concept, describing the spatial characteristics of spaces with specific geometric structures. The introduction of symplectic geometry theory into the field of signal processing is due to its ability to accurately characterize the geometric features and dynamic behaviors of signals in phase space. For instance, when dealing with nonlinear and non-stationary signals, symplectic geometry can reveal the inherent laws of signals from a geometric perspective, providing new ideas and methods for signal decomposition.
1.2 Decomposition Principle of SGMD
SGMD constructs a variational model based on symplectic geometry theory, and by solving this model, the original signal is adaptively decomposed into multiple intrinsic mode functions (IMFs) with different frequency characteristics and physical meanings. Compared to traditional signal decomposition methods, such as Empirical Mode Decomposition (EMD), SGMD overcomes issues like mode mixing and endpoint effects. In constructing the variational model, SGMD utilizes the structural preservation characteristics of symplectic geometry to ensure energy conservation and geometric invariance during the decomposition process, thereby more accurately extracting the essential features of the signal. During the iterative solving process, parameters are continuously adjusted to ensure that the decomposed modal components reflect the different frequency components of the original signal to the greatest extent.
2. Methods for Visualizing Signal Decomposition Components
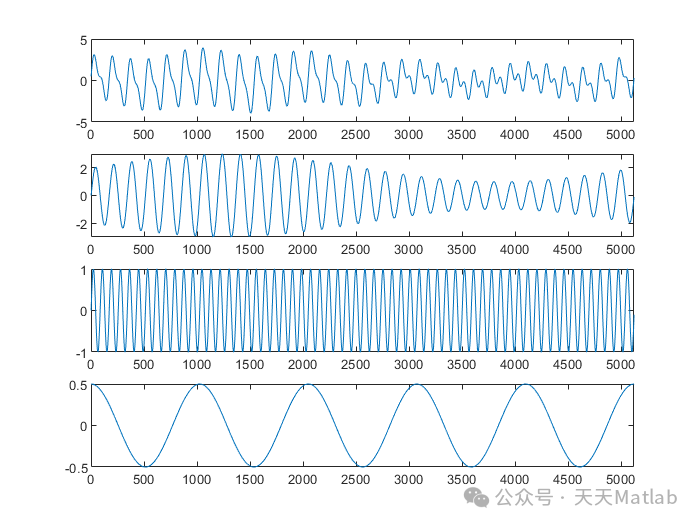
2.1 Time Domain Visualization
Time domain visualization is the most basic and intuitive visualization method. Displaying each intrinsic mode function obtained from SGMD decomposition in the time domain allows for a clear observation of how each component changes over time. By observing the waveform shapes, amplitude sizes, and trends of each component, one can preliminarily judge the time distribution of different frequency components in the signal. For example, in the decomposition of mechanical vibration signals, time domain visualization can quickly identify periodic vibration components and sudden impact components, providing important evidence for fault diagnosis. Additionally, color coding, transparency adjustments, and other methods can be used to simultaneously display multiple components, facilitating comparative analysis of their interrelationships.
2.2 Frequency Domain Visualization
Using tools like Fourier Transform, the components after SGMD decomposition can be converted to the frequency domain for visualization. The frequency domain graph uses frequency as the horizontal axis and amplitude or energy as the vertical axis, intuitively presenting the distribution and intensity of various frequency components in the signal. In frequency domain visualization, one can clearly see the frequency range corresponding to each intrinsic mode function and the contribution of different frequency components to the original signal. In power system signal analysis, frequency domain visualization can accurately detect harmonic components and their frequencies, aiding in the assessment of power quality and diagnosing power equipment faults. Advanced visualization forms such as waterfall plots and three-dimensional frequency spectrum plots can also be combined to display the frequency domain changes of the signal at different time points, providing a more comprehensive analysis of the signal’s dynamic characteristics.
2.3 Time-Frequency Domain Visualization
Time-frequency domain visualization methods, such as Short-Time Fourier Transform (STFT) and Wavelet Transform, can simultaneously display the changes of signals in both time and frequency dimensions. Visualizing the components after SGMD decomposition in the time-frequency domain can yield time-frequency distribution maps, where color or grayscale represents the energy intensity of the signal at different time and frequency points. This visualization method is particularly important for analyzing non-stationary signals, as it can capture the changes in signal frequency over time, showcasing the local time-frequency characteristics of the signal. In speech signal processing, time-frequency domain visualization can clearly present the pitch variations and formant information of speech, aiding in applications such as speech recognition and synthesis. Commonly used time-frequency domain visualization tools include Matplotlib, Seaborn, and the PyWavelets library in Python, which can easily implement various time-frequency domain visualization effects through corresponding code.
⛳️ Running Results
📣 Partial Code
🔗 References
🎈 Some theoretical references are from online literature; please contact the author for removal if there is any infringement.
👇 Follow me to receive a wealth of Matlab e-books and mathematical modeling materials
🏆 Our team specializes in guiding customized MATLAB simulations in various research fields, helping to realize research dreams:
🌈 Various intelligent optimization algorithm improvements and applications
Production scheduling, economic scheduling, assembly line scheduling, charging optimization, workshop scheduling, departure optimization, reservoir scheduling, three-dimensional packing, logistics site selection, cargo location optimization, bus scheduling optimization, charging pile layout optimization, workshop layout optimization, container ship loading optimization, pump combination optimization, medical resource allocation optimization, facility layout optimization, visibility-based station and drone site selection optimization, knapsack problem, wind farm layout, time slot allocation optimization, optimal distributed generation unit allocation, multi-stage pipeline maintenance, factory-center-demand point three-level site selection problem, emergency supply distribution center site selection, base station site selection, road lamp post arrangement, hub node deployment, transmission line typhoon monitoring devices, container scheduling, unit optimization, investment portfolio optimization, cloud server combination optimization, antenna linear array distribution optimization, CVRP problem, VRPPD problem, multi-center VRP problem, multi-layer network VRP problem, multi-center multi-vehicle VRP problem, dynamic VRP problem, two-layer vehicle routing planning (2E-VRP), electric vehicle routing planning (EVRP), hybrid vehicle routing planning, mixed flow shop problem, order splitting scheduling problem, bus scheduling optimization problem, flight shuttle vehicle scheduling problem, site selection path planning problem, port scheduling, port bridge scheduling, parking space allocation, airport flight scheduling, leak source localization
🌈 Machine learning and deep learning time series, regression, classification, clustering, and dimensionality reduction
2.1 BP time series, regression prediction, and classification
2.2 ENS voice neural network time series, regression prediction, and classification
2.3 SVM/CNN-SVM/LSSVM/RVM support vector machine series time series, regression prediction, and classification
2.4 CNN|TCN|GCN convolutional neural network series time series, regression prediction, and classification
2.5 ELM/KELM/RELM/DELM extreme learning machine series time series, regression prediction, and classification
2.6 GRU/Bi-GRU/CNN-GRU/CNN-BiGRU gated neural network time series, regression prediction, and classification
2.7 Elman recurrent neural network time series, regression prediction, and classification
2.8 LSTM/BiLSTM/CNN-LSTM/CNN-BiLSTM/long short-term memory neural network series time series, regression prediction, and classification
2.9 RBF radial basis neural network time series, regression prediction, and classification
2.10 DBN deep belief network time series, regression prediction, and classification
2.11 FNN fuzzy neural network time series, regression prediction
2.12 RF random forest time series, regression prediction, and classification
2.13 BLS broad learning time series, regression prediction, and classification
2.14 PNN pulse neural network classification
2.15 Fuzzy wavelet neural network prediction and classification
2.16 Time series, regression prediction, and classification
2.17 Time series, regression prediction, and classification
2.18 XGBOOST ensemble learning time series, regression prediction, and classification
2.19 Transform various combinations of time series, regression prediction, and classification
Directions cover wind power prediction, photovoltaic prediction, battery life prediction, radiation source identification, traffic flow prediction, load forecasting, stock price prediction, PM2.5 concentration prediction, battery health status prediction, electricity consumption prediction, water body optical parameter inversion, NLOS signal identification, precise prediction of subway stops, transformer fault diagnosis
🌈 In image processing
Image recognition, image segmentation, image detection, image hiding, image registration, image stitching, image fusion, image enhancement, image compressed sensing
🌈 In path planning
Traveling salesman problem (TSP), vehicle routing problem (VRP, MVRP, CVRP, VRPTW, etc.), UAV three-dimensional path planning, UAV collaboration, UAV formation, robot path planning, grid map path planning, multimodal transport problems, electric vehicle routing planning (EVRP), two-layer vehicle routing planning (2E-VRP), hybrid vehicle routing planning, ship trajectory planning, full path planning, warehouse patrol
🌈 In UAV applications
UAV path planning, UAV control, UAV formation, UAV collaboration, UAV task allocation, UAV secure communication trajectory online optimization, vehicle collaborative UAV path planning
🌈 In communication
Sensor deployment optimization, communication protocol optimization, routing optimization, target localization optimization, Dv-Hop localization optimization, Leach protocol optimization, WSN coverage optimization, multicast optimization, RSSI localization optimization, underwater communication, communication upload and download allocation
🌈 In signal processing
Signal recognition, signal encryption, signal denoising, signal enhancement, radar signal processing, signal watermark embedding and extraction, EMG signals, EEG signals, signal timing optimization, ECG signals, DOA estimation, encoding and decoding, variational modal decomposition, pipeline leakage, filters, digital signal processing + transmission + analysis + denoising, digital signal modulation, bit error rate, signal estimation, DTMF, signal detection
🌈 In power systems
Microgrid optimization, reactive power optimization, distribution network reconstruction, energy storage configuration, orderly charging, MPPT optimization, household electricity, electric/cold/heat load forecasting, power equipment fault diagnosis, battery management system (BMS) SOC/SOH estimation (particle filter/Kalman filter), multi-objective optimization in power system scheduling, photovoltaic MPPT control algorithm improvement (perturbation observation method/incremental conductance method)
🌈 In cellular automata
Traffic flow, crowd evacuation, virus spread, crystal growth, metal corrosion
🌈 In radar
Kalman filter tracking, track association, track fusion, SOC estimation, array optimization, NLOS identification
🌈 In workshop scheduling
Zero-wait flow shop scheduling problem (NWFSP) , permutation flow shop scheduling problem (PFSP) , hybrid flow shop scheduling problem (HFSP) , zero idle flow shop scheduling problem (NIFSP), distributed permutation flow shop scheduling problem (DPFSP), blocking flow shop scheduling problem (BFSP)
👇