Cytopathic effects (CPEs) are a hallmark of infection. Due to the phototoxicity of classical optical microscopy, CPEs are difficult to observe. This study reports different patterns of viral infection in live cells using Digital HoloTomographic Microscopy (DHTM). DHTM is label-free and records the phase shift of low-energy light passing through the sample on a transparent surface with minimal disturbance. DHTM measures the Refractive Index (RI) of the cells and calculates the Refractive Index Gradient (RIG), revealing the optical heterogeneity of the cells. The study found that infection with Vaccinia Virus (VACV), Herpes Simplex Virus (HSV), and Rhinovirus (RV) significantly increased RIG over time. VACV infection caused oscillations in cell volume, while all three viruses altered the dynamics of the plasma membrane and induced apoptotic features similar to those caused by Staurosporine. In summary, this study introduces DHTM as a quantitative, label-free microscopy technique for infection research, revealing virus type-specific changes and CPE in live cells with minimal disturbance.
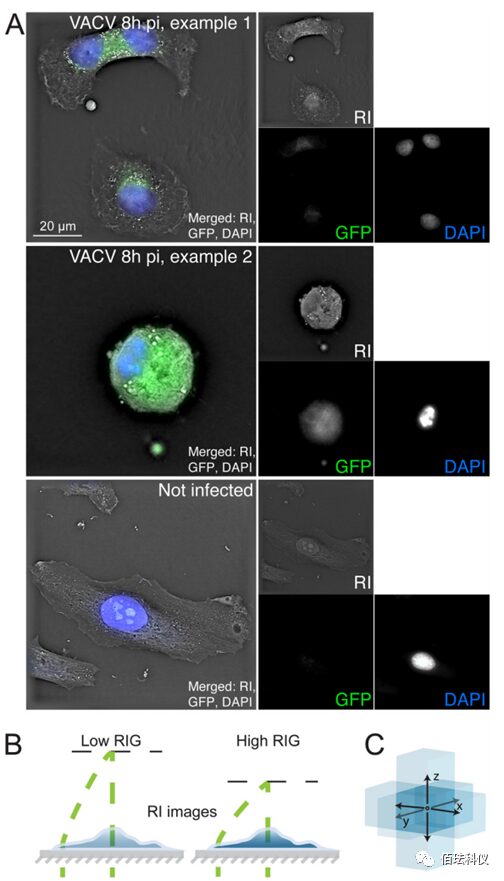
Fig.1. Digital HoloTomographic Microscopy and Optical Microscopy Images of Fixed and Permeabilized Cells. (A) HeLa-ATCC
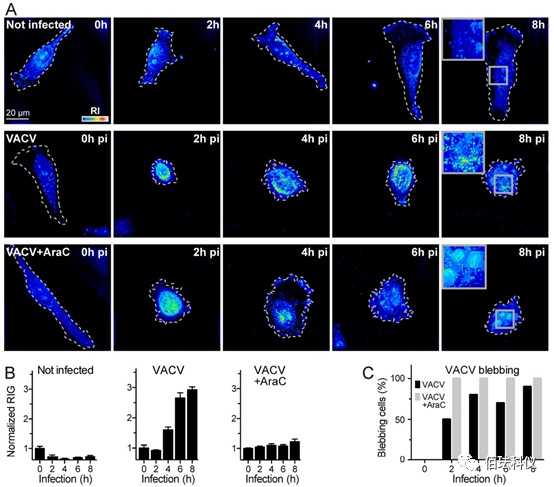
Fig.2. VACV Late Gene Expression Increases RIG in HeLa-ATCC Cells. (A) Representative images obtained by incubating with 2ml RPMI at 37°C for 8 hours and imaging with DHTM every 2 hours. In the presence of 10 M AraC, uninfected cells were infected with VACV-GFP at an MOI of 2, or infected with VACV-GFP at an MOI of 2. The perimeter of cells growing on the coverslip is outlined with a white dashed line. RIs are described as intensity values in the “thermal” lookup table. The obtained images are holograms and depicted as projections of maximum values along the z-axis of the 3D stack. Scale bar is 20μm. (B) Normalized quantitative RIG shown in image A. RIG values at 0 hours post-infection (pi) are normalized to 1. Bar graphs represent data from at least 10 cells collected at each condition and time point, with data presented as mean ± SEM. (C) Comparison of the “blebbing” phenotype frequency between VACV-GFP infected cells and those in RPMI with 10 M AraC. Data from at least 10 cells at each time point and condition were manually scored as blebbing or non-blebbing.
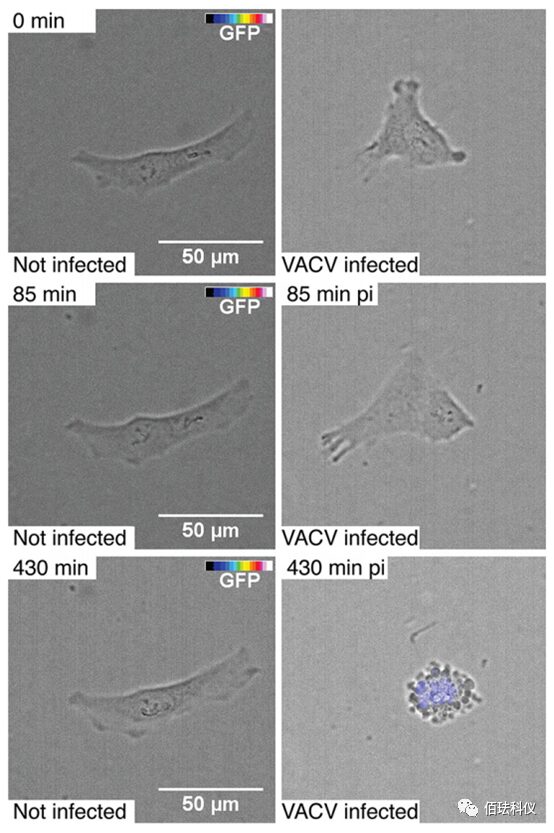
Fig.3. Observing Cell Morphology and VACV-GFP Transgene Expression Using Phase Contrast and Fluorescence Live Cell Time-Lapse Microscopy. HeLa-ATCC cells uninfected (left image) or infected (right image) with VACV-GFP using a cold adhesion scheme (30 minutes on ice, wash, transfer to 37°C). Cells were imaged every 5 minutes for 8 hours using a high-throughput wide-field microscope, observing cells with transmitted light and GFP fluorescence intensity color-coded (color from transparent to blue to white). Scale bar is 50μm. Also refer to the videos in supplementary materials S1.
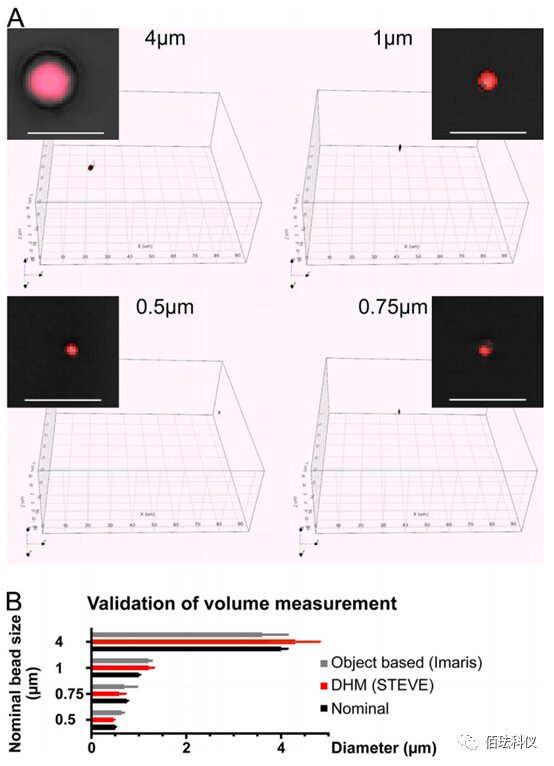
Fig.4. Benchmarking Volume Measurement Using Specified Diameter Polystyrene Beads. (A) Specified diameter polystyrene beads (Tetraspeck; ThermoFisher) were diluted in PBS to settle at the bottom of the dish, imaged with the 3D Cell Explorer microscope. Small colored boxes show the digital RI staining of red beads on a black background. The large box displays the complete 3D visualized holographic image obtained. The 3D stack images of the beads were digitally stained (voxel segmentation), with RI covering at least 95% of the bead volume. Scale bar is 5μm. (B) Comparison of volume quantification through voxel summation using voxel counting in STEVE software or surface fitting in Imaris. The diameter of the bead was calculated based on voxel counts and voxel size and compared with the nominal diameter provided by the manufacturer.
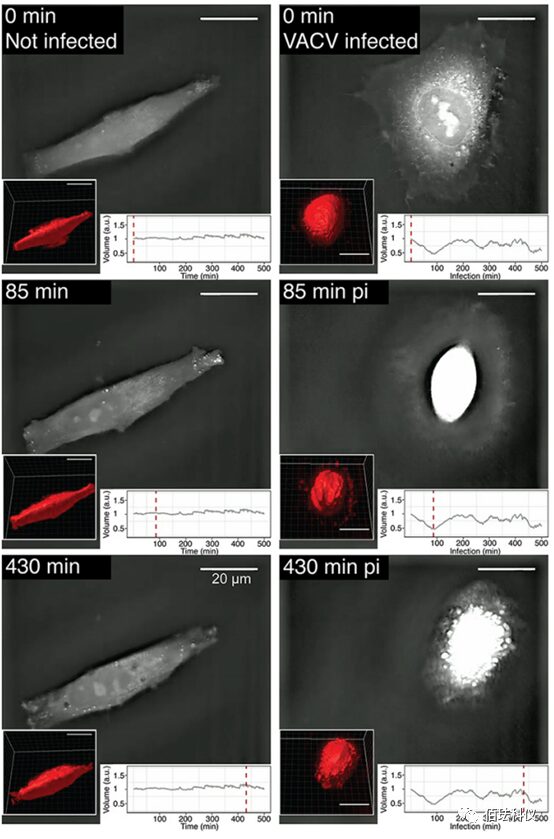
Fig.5. Morphological and Volume Dynamics of VACV-GFP Infected Cells Observed Using Label-Free Real-Time DHTM. Following the cold adhesion scheme, HeLa-ATCC cells were infected with VACV-GFP. Holograms of cells were collected every minute for a total duration of 8 hours. RI is displayed as a grayscale image. Volume measurement was conducted using Imaris software through surface fitting and 3D rendering (see the lower left corner of each frame). The bottom right image shows the relative volume normalized to 0 minutes pi (in arbitrary units [a.u.]). The red dashed line corresponds to the time point of the respective hologram. Scale bar is 20μm. Also refer to the videos in supplementary materials S2 and S3.
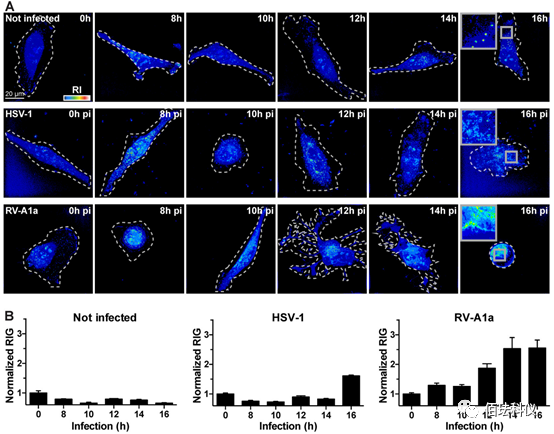
Fig.6. HSV-1 and RV Increase Cell RIG in Late Infection. (A) Representative images of uninfected and infected cells taken at specified time points by DHTM. HeLa-ATCC cells infected with HSV-1-GFP (MOI of 10), HeLa-Ohio cells infected with RV-A1a (MOI of 50). The perimeter of the cells growing on the coverslip is outlined with a white dashed line, RIs represented by intensity in the “thermal” lookup table. The obtained images are holograms and depicted as projections of maximum values along the z-axis of the 3D stack. Scale bar is 20μm. (B) Normalized quantitative RIG shown in image A. Bar graphs represent data from at least 10 cells collected at each condition and time point, with data presented as mean ± SEM.
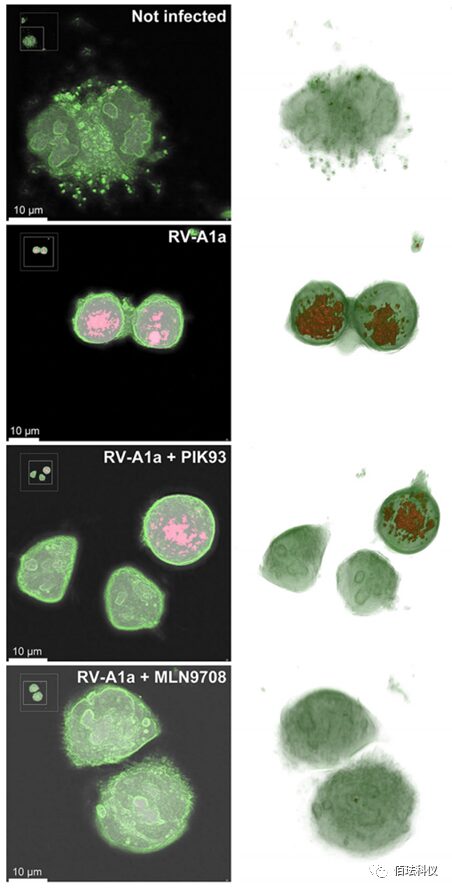
Fig.7. Drug Treatment Can Inhibit RIs Changes in RV-A1a Infected Cells. Representative images of HeLa Ohio cells simulated infection (top image) or RV-A1a infected (MOI of 50) (bottom three images). Cells were treated with PIK93 (5 M) or MLN9708 (10 M) and imaged using DHTM every minute for 8 hours. Cell membranes are labeled in green, and high RI and RIG regions are shown in red. The images in the left column display central z-axis slices of the reconstructed hologram, and the images in the right column are 3D reconstructions of the hologram. Also refer to videos S4 to S7. Scale bar is 10μm.
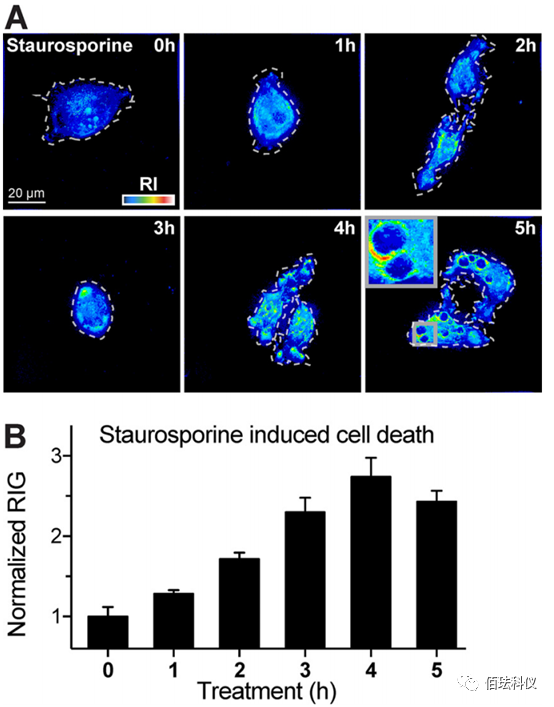
Fig.8. Staurosporine-Induced Apoptosis Rapidly Increases Cell RIG. (A) Representative DHTM images of HeLa-Ohio cells incubated with Staurosporine (10 M) at 37°C for 5 hours. The perimeter of cells on the glass coverslip is outlined with a white dashed line, RIs represented by intensity in the “thermal” lookup table. The obtained images are holograms and depicted as projections of maximum values along the z-axis of the 3D stack. Scale bar is 20μm. (B) Normalized quantitative RIG shown in image A. RIG values at 0 hours post-infection (pi) are normalized to 1. Bar graphs represent data from at least 10 cells collected at each condition and time point, with data presented as mean ± SEM.
Paper Link:
https://msphere.asm.org/content/3/6/e00599-18
Nanolive has the following features:
1. Label-free live cell imaging scheme
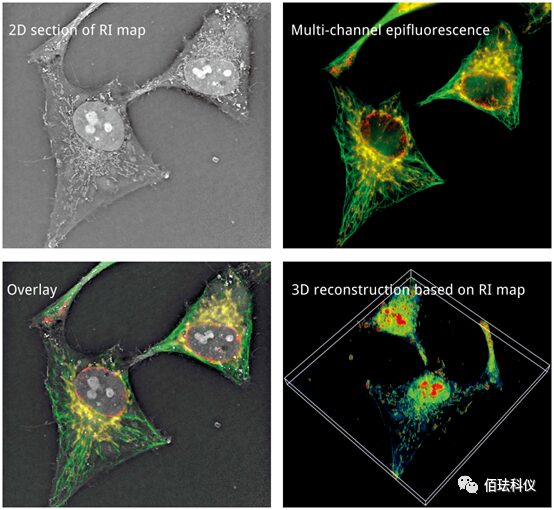
2. Software – 3D image acquisition construction and digital staining software
3. Software – Cell function analysis software
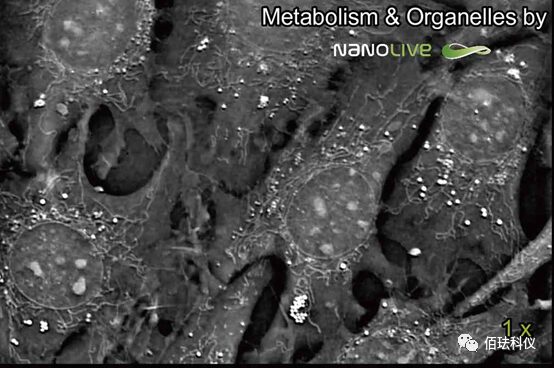
(Label-free subcellular structure dynamic analysis – mitochondria + lipid bodies)
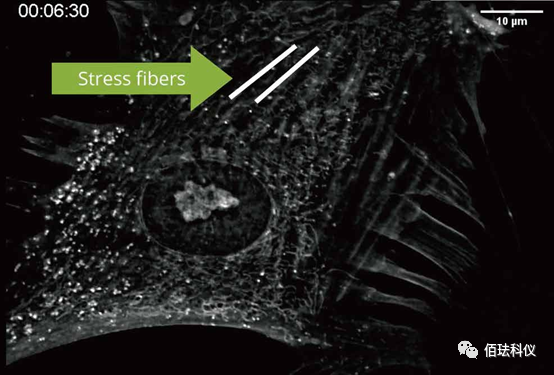
(Label-free cytoskeleton dynamic analysis)
Nanolive’s real-time label-free 3D microscope series imaging system is a newly developed technology in recent years, which has been applied in several fields and is continuously expanding:
-
Observation and analysis of microbial infection of cells
-
Cell cycle observation and analysis
-
Analysis of drug mechanisms
-
Yeast cell division studies
-
3D cell culture
-
Cell autophagy research
-
Research on nanomaterial development
-
Subcellular localization observation
-
GFP or RFP transfection analysis
-
H&E and HF detection without staining
-
Botanical research
-
Analysis of intercellular interactions
-
Apoptosis and death mechanism studies
-
Molecular co-localization analysis
-
CTC cell non-destructive identification
-
Microvesicle tracking
-
Environmental biology


 Feel free to call our company hotline, and we will be happy to serve you!
Biotime Technology (China) Co., Ltd.
400 Nationwide Toll-Free Hotline: 400-081-1898TEL:(021)54566520 FAX:(021)54566520Http://www.biotimestech.com
Company Address: No. 629, Lingling Road, Xuhui District, Shanghai