Author: Xiang Xianjun
Email: [email protected]
Data Source:
CMEMS – Global Monitoring and Forecasting Centre
Dataset:
ARCO data downloaded from the Marine Data Store using the MyOcean Data Portal

File Import
% South China Sea Region % 2000-2019, 20 years, 240 months
close all
clear clc
% ============================= File Import Variable Read ==========================load("E:\MATLAB-othercolor\colorData.mat"); % colorbar color package
sal_file = "E:\sal2001-2020.nc";    % Sea Surface Salinity file
prec_file = "E:\preci2001-2020.nc";  % Precipitation file
ncdisp(sal_file)
ncdisp(prec_file)
% Sea Surface Salinity
lon_sal = ncread(sal_file, 'longitude');       % Longitude
lat_sal = ncread(sal_file, 'latitude');        % Latitude
t_sal = ncread(sal_file, 'time');              % Time
sal = squeeze( ncread(sal_file, 'so') );       % Sea Surface Salinity
% Precipitation
lon_prec = ncread(prec_file, 'LON2851_2950');  % Longitude
lat_prec = ncread(prec_file, 'LAT931_1100');   % Latitude
t_prec = ncread(prec_file, 'TIME');            % Time
prec = ncread(prec_file, 'PREC');              % Precipitation
Data Processing
% ================================ Data Processing ================================% Longitude and Latitude Range - Sea Surface Salinity
sal_lon_max = max(lon_sal); sal_lon_min = min(lon_sal);
sal_lat_max = max(lat_sal); sal_lat_min = min(lat_sal);
% Longitude and Latitude Range - Precipitation
prec_lon_max = max(lon_prec); prec_lon_min = min(lon_prec);
prec_lat_max = max(lat_prec); prec_lat_min = min(lat_prec);
% Grid
[lon_sal1, lat_sal1] = meshgrid(lon_sal, lat_sal);
[lon_prec1, lat_prec1] = meshgrid(lon_prec, lat_prec);
% Average over Time Dimension
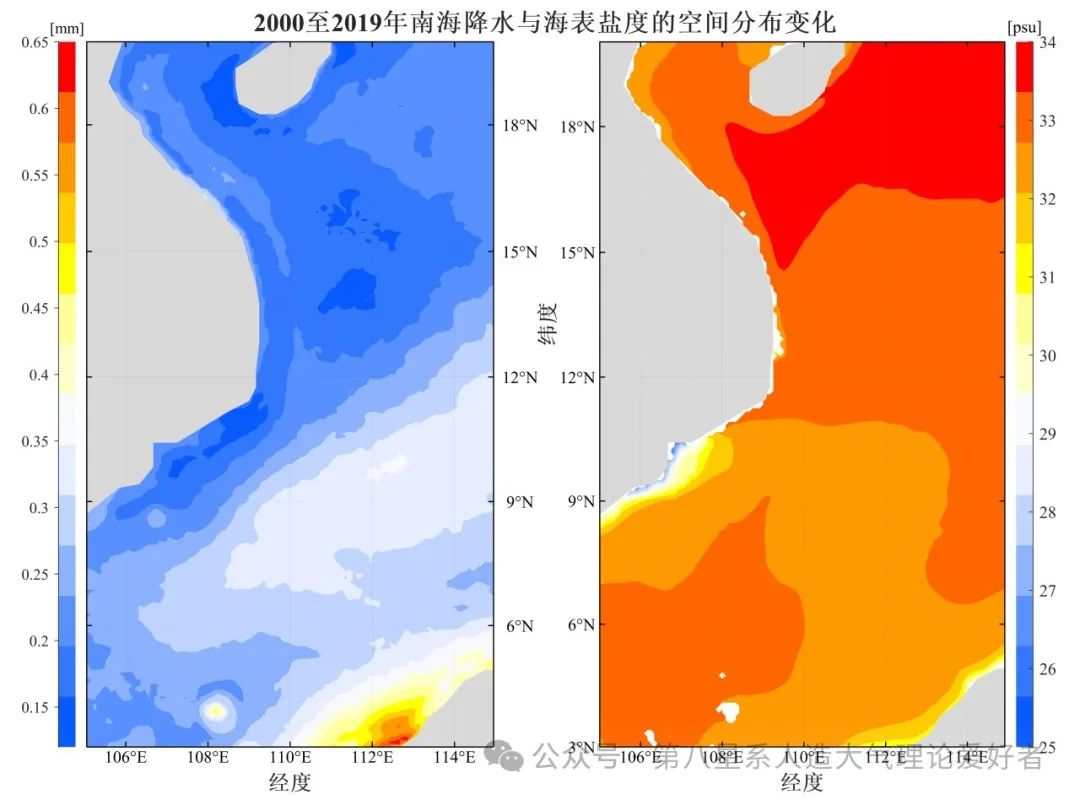
sal_NHmean = squeeze(nanmean(sal,3)); % Sea Surface Salinity
sal_max = max(max(sal_NHmean)); % 33.3188
sal_min = min(min(sal_NHmean)); % 25.1982
% ----------------
prec_NHmean = squeeze(nanmean(prec,3)); % Precipitation
prec_max = max(max(prec_NHmean)); % 0.6434
prec_min = min(min(prec_NHmean)); % 0.1299
% Average over Longitude and Latitude
sal_timemean = squeeze(nanmean(sal,[1 2])); % Sea Surface Salinity
sal_tmax = max(sal_timemean); % 33.6873
sal_tmin = min(sal_timemean); % 32.0849
% ----------------
prec_timemean = squeeze(nanmean(prec,[1 2])); % Precipitation
prec_timemean = fillmissing(prec_timemean,'linear'); % Interpolate NaN
prec_tmax = max(prec_timemean); % 0.6975
prec_tmin = min(prec_timemean); % 0.0168
Image Basic Settings
% =========================== Spatial Distribution of SSS and Precipitation ========================% Image Size Settings (unit: cm)
figureUnits = 'centimeters';
figureWidth = 27;
figureHeight = 20;
% Window Settings
figureHandle = figure(1);
set(gcf, 'Units', figureUnits, 'Position', [0 0 figureWidth figureHeight]);
% Set Overall Layout and Spacing for Subplots
t = tiledlayout(1,2);        % Create 1 row x 2 columns subplot layout, handle is t
t.TileSpacing = "compact";   % Set subplot spacing
t.Padding = 'compact';       % Set overall padding
Image Plotting: Precipitation
nexttile% ---------------- Precipitation ---------------m_proj('miller','lon',[prec_lon_min prec_lon_max],'lat',[prec_lat_min prec_lat_max]);
m_contourf(lon_prec1,lat_prec1,prec_NHmean',100,'linestyle','none');
m_coast('patch',[.85 .85 .85],'edgecolor','none');
m_grid('box','on','FontSize', 12,'FontWeight', 'bold','FontName','Times New Roman','YaxisLocation','right','linewidth',0.85,'ticklen',0.0076);
colormap(BuOrR_14);  % This is a personal colorbar color package
% Colorbar
cb = colorbar;
cb.Box = "off";
cb.Location = "westoutside";
cb.FontSize = 11;
bc.FontName = 'Times New Roman';
cb.TickLength = 0.0055;
cb.TickDirection = "out";
set(get(cb,'Title'),'string','[mm]');
clim([0.12 0.65]);
% Coordinate Area
ax = gca;
ax.LineWidth = 1.25;
ax.FontSmoothing = 'on';
ax.FontName = 'Times new Roman';
ax.TickDir = 'in';
ax.TickLength = [0.004 0.002];
ax.YAxisLocation = "right";
% Label
xlabel('\fontname{Songti}Longitude','FontSize',15,'FontWeight','bold');
Image Plotting: Sea Surface Salinity
nexttile% ---------------- Sea Surface Salinity -------------m_proj('miller','lon',[sal_lon_min sal_lon_max],'lat',[sal_lat_min sal_lat_max]);
m_contourf(lon_sal1,lat_sal1,sal_NHmean',100,'linestyle','none');
m_coast('patch',[.85 .85 .85],'edgecolor','none');
m_grid('box','on','FontSize', 12,'FontWeight', 'bold','FontName','Times New Roman','YaxisLocation','left','linewidth',0.85,'ticklen',0.0076);
colormap(BuOrR_14);  % This is a personal colorbar color package
% Colorbar
cb = colorbar;
cb.Box = "off";
cb.Location = 'eastoutside';
bc.FontSize = 12;
bc.FontName = 'Times New Roman';
bc.TickLength = 0.0055;
bc.TickDirection = "in";
% cb.Label.String = '[psu]';
set(get(cb,'Title'),'string','[psu]');
clim([25 34]);
% Coordinate Area
ax = gca;
ax.LineWidth = 1.25;
ax.FontSmoothing = 'on';
ax.FontName = 'Times New Roman';
ax.TickDir = 'in';
ax.TickLength = [0.004 0.002];
ax.YAxisLocation = 'left';
% Label
xlabel('\fontname{Songti}Longitude','FontSize',15,'FontWeight','bold');
y = ylabel('\fontname{Songti}Latitude','FontSize',15,'FontWeight','bold');
set(y, 'Units', 'Normalized', 'Position', [-0.10, 0.6, 0]);  % Adjust ylabel distance from y-axis
sgtitle('\fontname{Times New Roman}Spatial Distribution Change of Precipitation and Sea Surface Salinity in the South China Sea from 2000 to 2019','FontSize',18,'FontWeight','bold');
% Save Image
print('E:\figures\spatial_distribution.jpg', '-djpeg', '-r600');
END