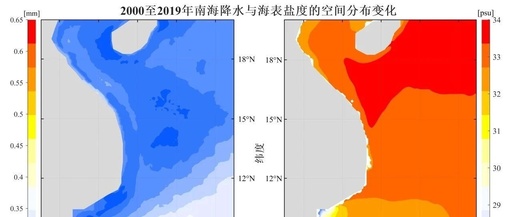
MATLAB Visualization of Spatial Distribution of Correlation Coefficients
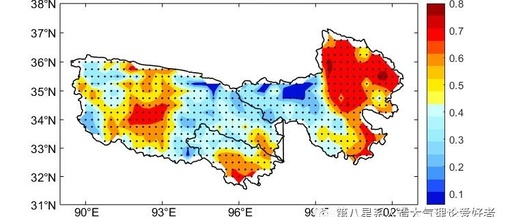
MATLAB Visualization of Spatial Distribution of Correlation Coefficients Author: Eighth Galaxy – Stone Man Contact Email: [email protected] Data:ERA5 Data Read Data *%% Spatial Distribution of Correlation Coefficients clc;clear;close all %% Read Data path = "E:\z\hhh.nc"; % Set data file path ncdisp(path) % Display variables and their precision in the data file mlat = double(ncread(path,'latitude')); % … Read more