Welcome to the Battery Perspective!
In the overview of SOC (Overview of SOC Estimation Methods), various SOC estimation methods are introduced, and we will provide corresponding analyses and application introductions for each method. Here, we will first discuss the issues present in ampere-hour integration.
Ampere-hour integration is based on the fundamental principle that the charge stored/released by the battery is the product of current and time. In a small time scale, its expression is:

SOC0 is the state of charge of the battery at times t0 and t1.
i(t) and η(t) are the current and coulombic efficiency of the battery at time t.
Qn is the actual capacity of the battery in this test.
Such a simple algorithm encounters many difficulties in practical use. For example, errors caused by inaccurate SOC0, unknown η(t), inaccurate measurement of i(t), and unknown Qn lead to various errors. This analysis mainly focuses on these errors.
For a fully charged battery, we assume its SOC is 1. During subsequent discharges, the discharge capacity continuously increases while the battery SOC continuously decreases, as shown in Figure 1.
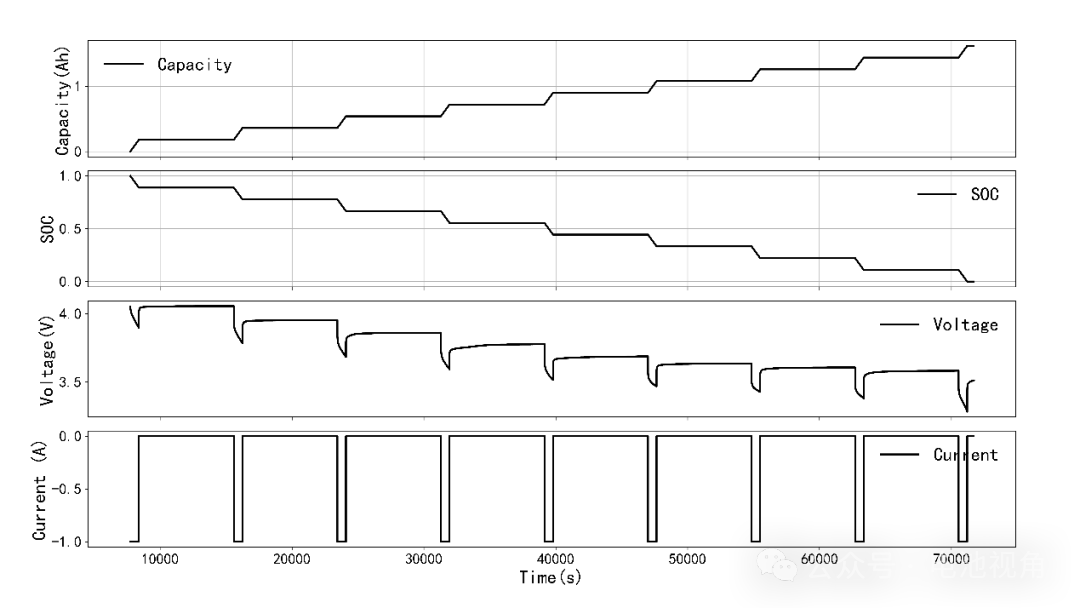
Figure 1. Capacity, SOC, voltage, and current graphs of the battery during 1A intermittent discharge.
Based on this experimental result, we analyze the errors in SOC estimation caused by different factors. The first is the error caused by inaccurate SOC0. Since SOC is directly present in the form of a sum during the calculation process, its impact on the result is easy to imagine, as shown in Figure 2. The results show that the relative error caused by the initial SOC increases continuously during the discharge process. This is easy to understand because as the discharge progresses, the battery’s SOC gradually decreases, and the denominator in the relative error calculation gradually decreases, leading to an increase in relative error.
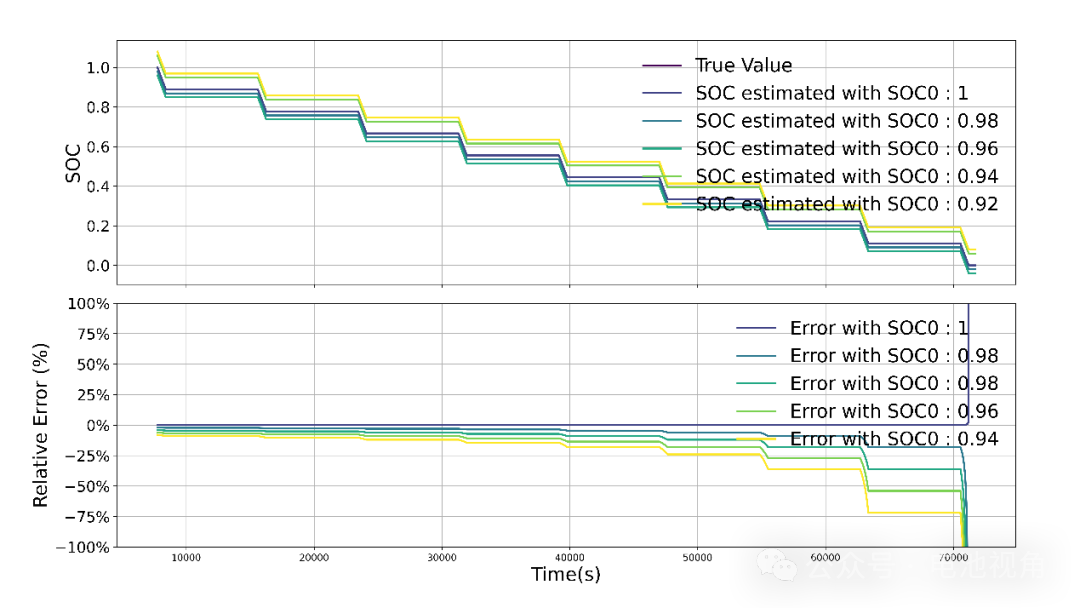
Figure 2. The impact of initial SOC error on the overall SOC estimation (assuming coulombic efficiency is 1).
If our coulombic efficiency is not 1, how much impact will it have on SOC estimation? Using different coulombic efficiencies to estimate SOC yields the results shown in Figure 3. It can be seen that the impact of coulombic efficiency on SOC amplifies as the battery operates. For example, at 10000s, it is difficult to see significant differences in the SOC curve, while at 60000s, the SOC curves under different coulombic efficiencies show significant differences.
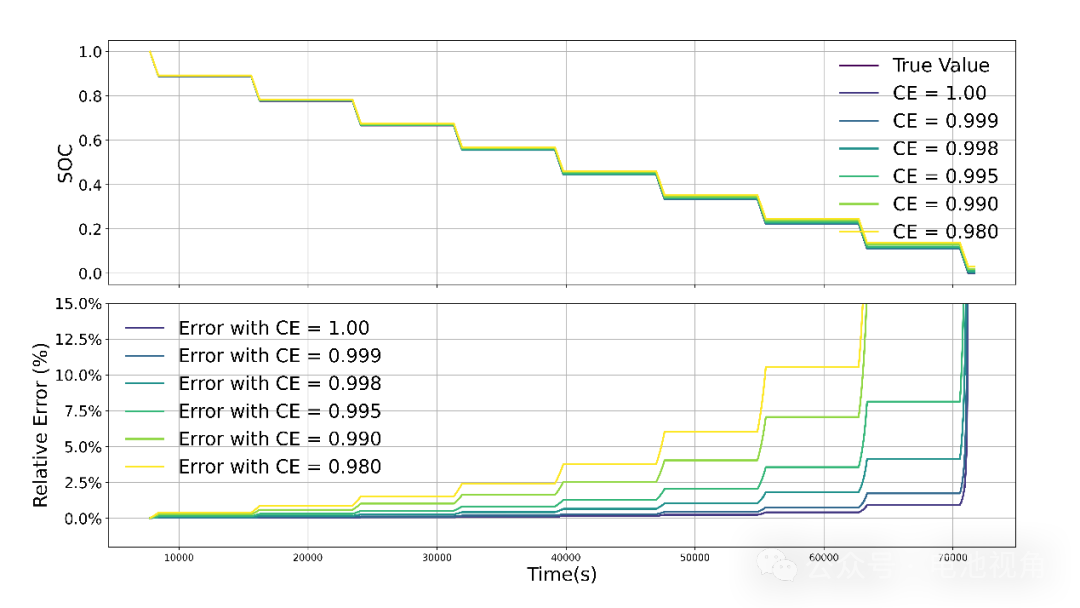
Figure 3. The impact of coulombic efficiency on SOC estimation; the SOC error caused by coulombic efficiency accumulates during battery operation.
In addition to the above two factors, current measurement errors also significantly impact SOC estimation. Current measurement inaccuracies are mainly due to systematic errors and random errors.
Figure 4 shows the comparison between the SOC estimated using ampere-hour integration and the actual SOC when the system has a systematic measurement error ranging from -2% to 2%. It is evident that systematic errors cause the SOC estimation results to deviate further from the true value, with no chance of correction.
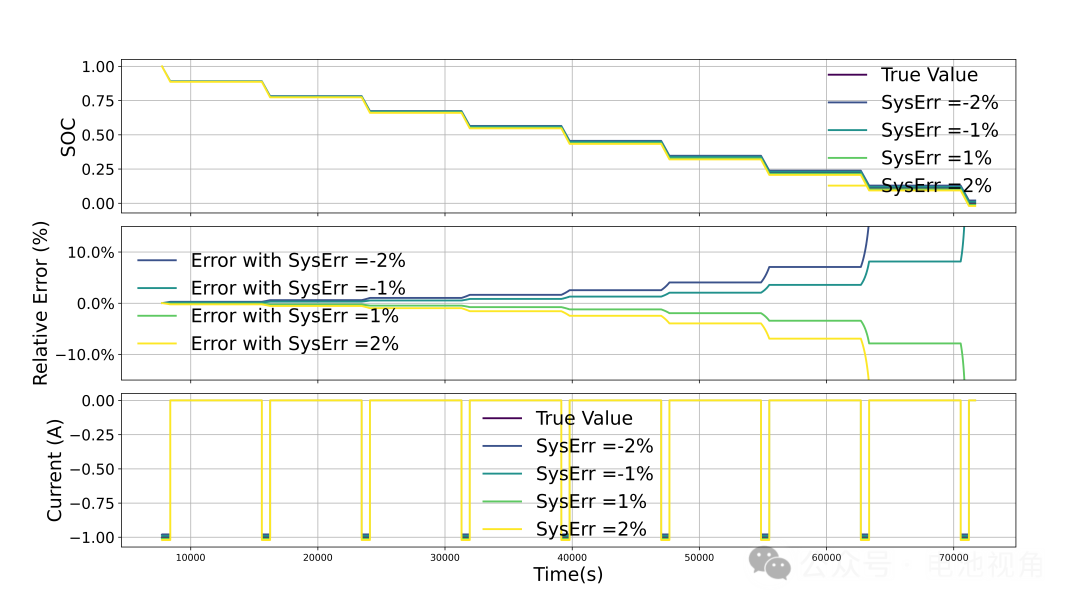
Figure 4. SOC estimation error caused by systematic errors.
Figure 5 illustrates the impact of random errors on SOC estimation. Here, we assume that random errors follow a normal distribution, with a mean of 0 and a standard deviation ranging from 0.005 to 0.05. Clearly, even with a large standard deviation, as long as the mean is 0, the random error will not accumulate excessively in SOC estimation.
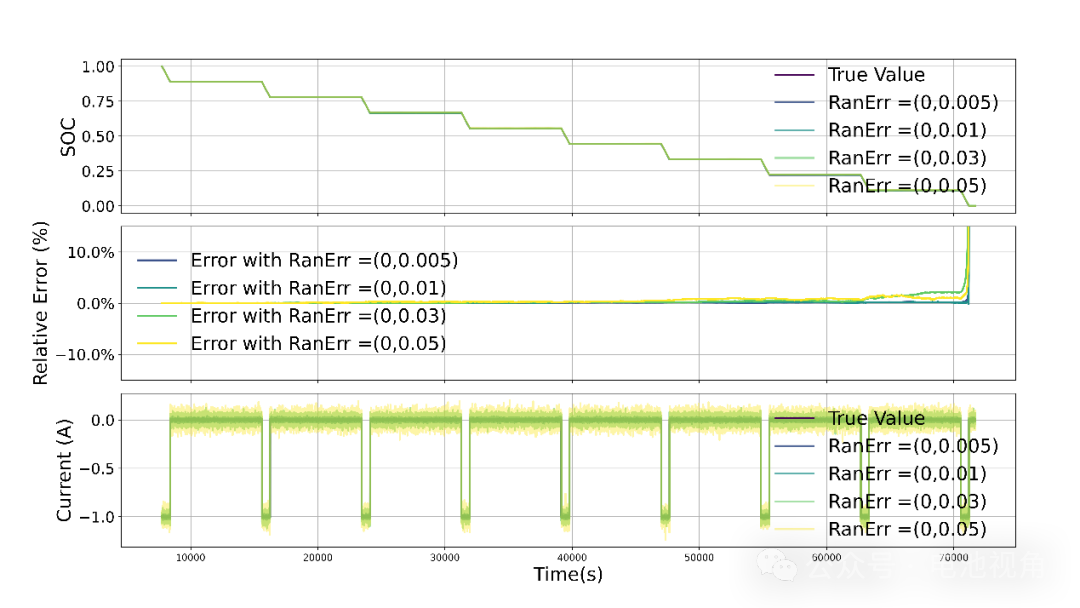
Figure 5. The impact of random errors on SOC estimation.
Considering that systematic errors and random errors often coexist, we also explored their combined effect on SOC estimation. Figure 6 shows the results. From Figures 4 and 5, we can conclude that the SOC error caused by systematic errors will continuously accumulate, while the SOC error caused by random errors will not accumulate. Based on this conclusion, we can understand that the trend of SOC estimation error changes is determined by systematic errors. Comparing the relative errors in Figures 4 and 6, we find that their trends are indeed the same. The only difference is that the relative error in Figure 4 is relatively smooth, while the relative error in Figure 6 has spikes, which are caused by random errors.
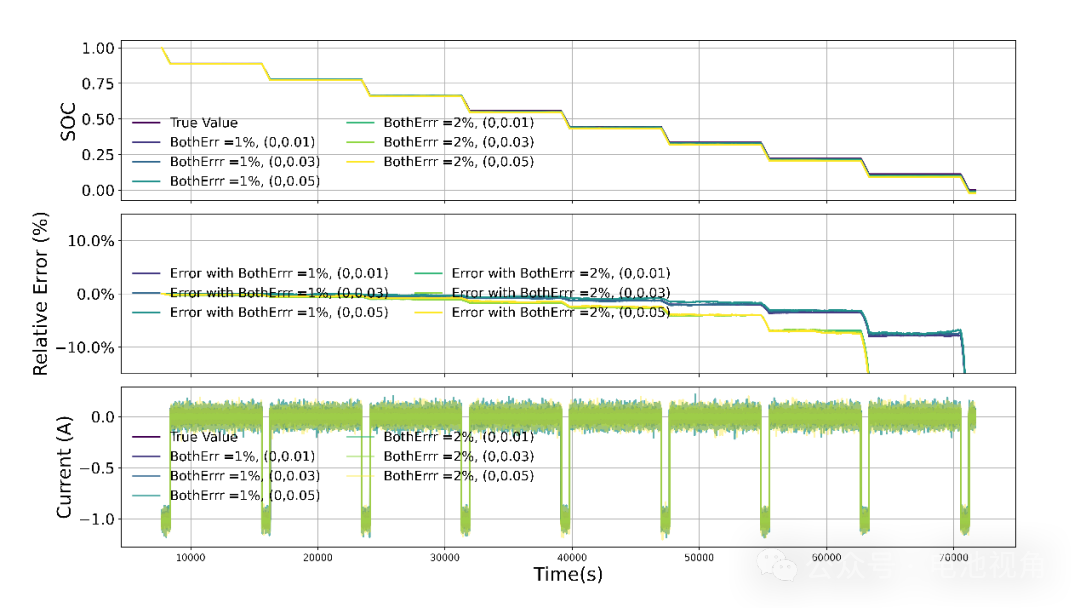
Figure 6. The combined effect of systematic and random errors on SOC estimation.
As the simplest method in SOC estimation, there are so many difficulties. The issues with other methods can be imagined. We will introduce them one by one later.