There are several commonly used Python tools for achieving data visualization on the web:
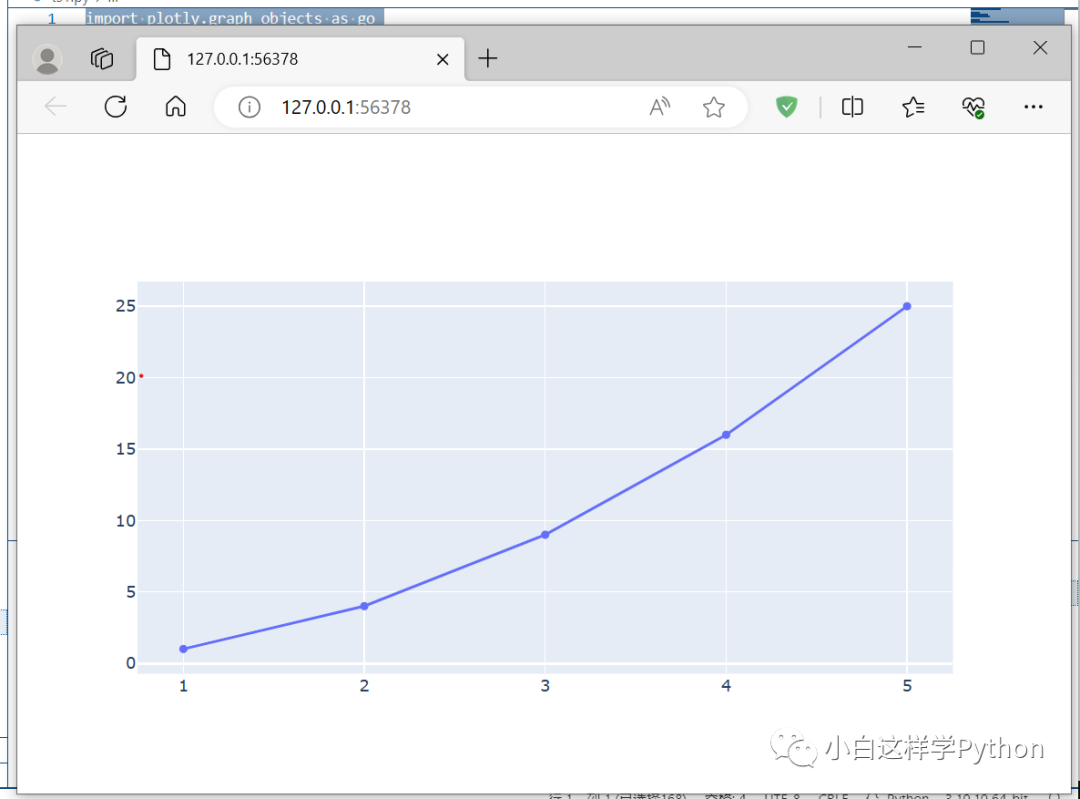
Plotly: Plotly is an interactive visualization library that can generate beautiful charts and visual interfaces on the web. It supports various chart types, including line charts, scatter plots, bar charts, maps, etc., and can create interactive charts that allow users to explore data through mouse interactions.
import plotly.graph_objects as go

# Create data
x = [1, 2, 3, 4, 5]
y = [1, 4, 9, 16, 25]

# Create chart
fig = go.Figure(data=go.Scatter(x=x, y=y))

# Display chart on the web
fig.show()
The result of the code execution is as follows:
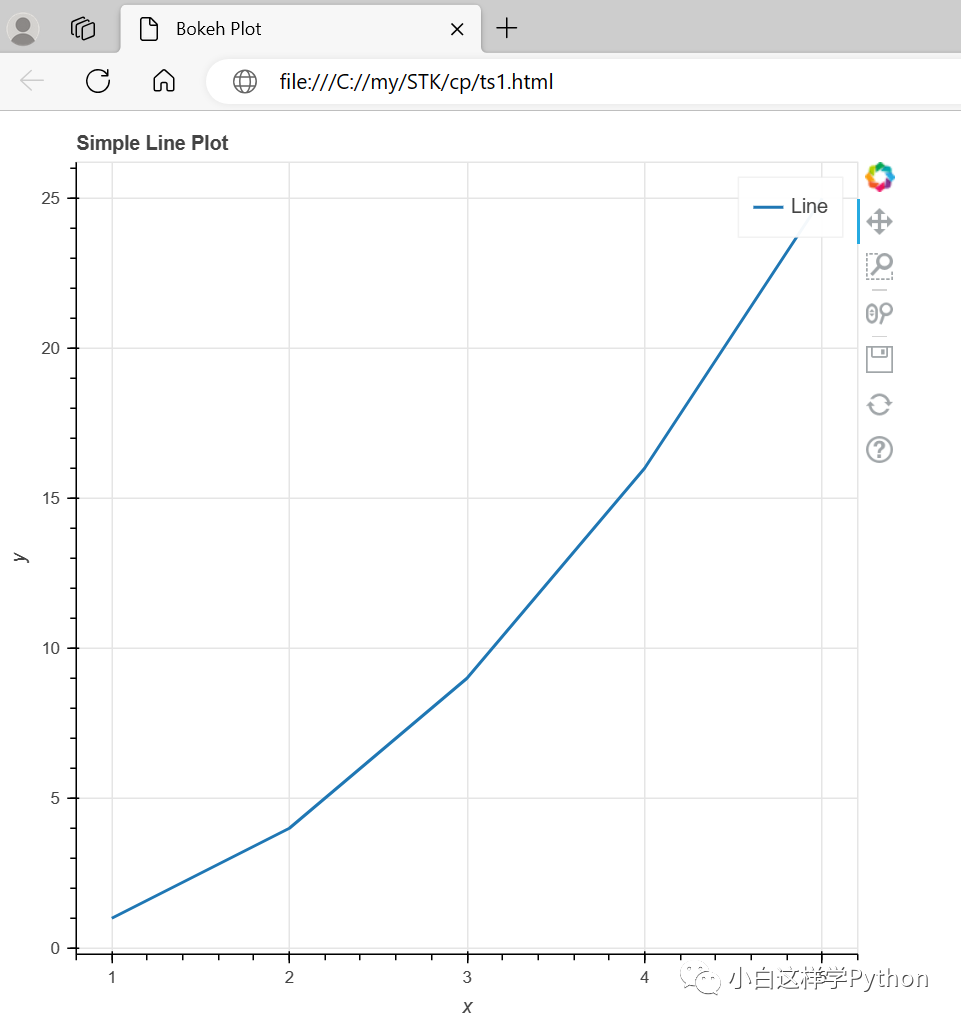
Bokeh: Bokeh is an interactive visualization library that can create beautiful interactive charts and applications on the web. It supports various chart types, including line charts, scatter plots, bar charts, maps, etc., and can generate interactive charts that allow users to zoom, pan, and select operations through a toolbar.
from bokeh.plotting import figure, show

# Create data
x = [1, 2, 3, 4, 5]
y = [1, 4, 9, 16, 25]

# Create chart
p = figure(title="Simple Line Plot", x_axis_label='x', y_axis_label='y')
p.line(x, y, legend_label="Line", line_width=2)

show(p)
The result of the code execution is as follows:
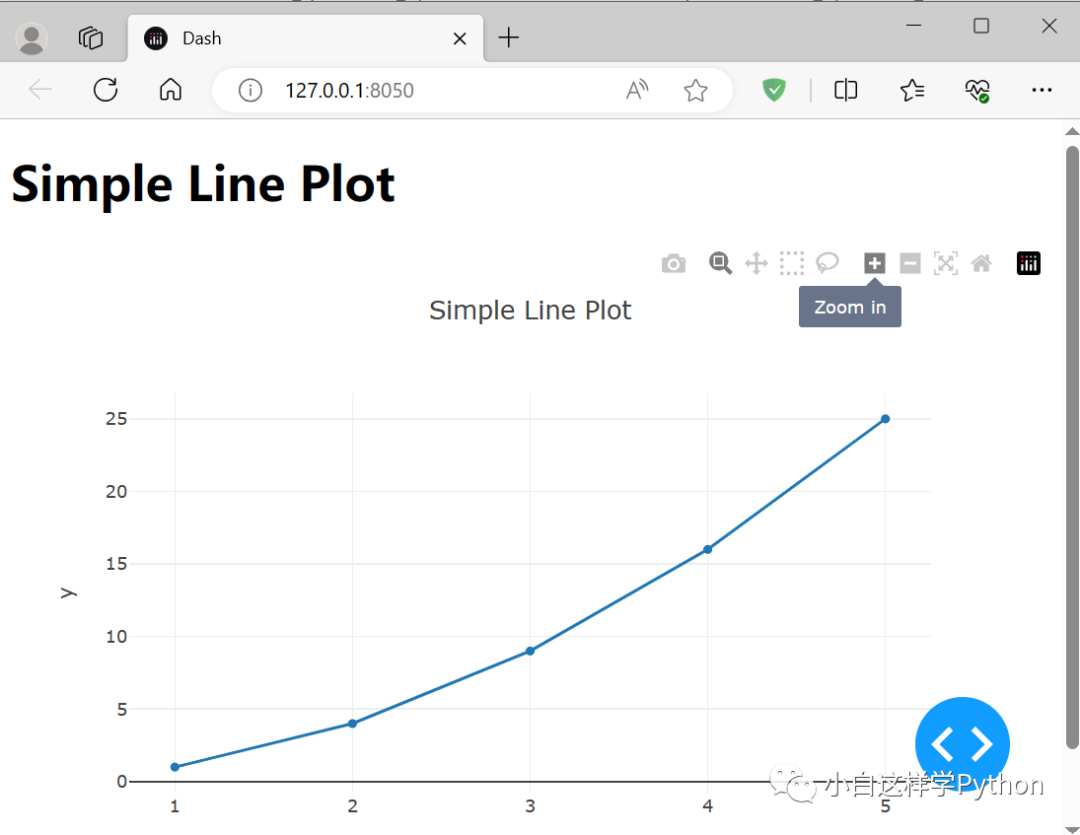
Dash: Dash is a library for building analytical web applications, developed based on Flask and Plotly. It provides a simple API to create interactive data visualization interfaces using Python, supporting real-time updates and interactions.
import dash
import dash_core_components as dcc
import dash_html_components as html

# Create data
x = [1, 2, 3, 4, 5]
y = [1, 4, 9, 16, 25]

# Create application
app = dash.Dash(__name__)

# Create layout
app.layout = html.Div(children=[
    html.H1(children='Simple Line Plot'),
    dcc.Graph(
        figure={
            'data': [
                {'x': x, 'y': y, 'type': 'line', 'name': 'Line'}
            ],
            'layout': {
                'title': 'Simple Line Plot',
                'xaxis': {'title': 'x'},
                'yaxis': {'title': 'y'}
            }
        }
    )
])

# Run application
if __name__ == '__main__':
    app.run_server(debug=True)
The result of the code execution is as follows:
For more content, please follow: