Download Anaconda, create a virtual environment. The best option is to have a notebook with Ubuntu, which supports it natively and seems to process much faster and is easier to use. I had one before, but I don’t have it now, mainly due to some twists and turns, so I won’t go into detail. I downloaded Python 3.11.13. Then, download some GeoJSON base maps from the internet, such as provincial boundaries, city boundaries, county boundaries, and first-level rivers. Note: If the latitude and longitude range is too large or too small, it may cause slight positional changes in the compass, scale, and legend. I haven’t figured out the optimal method yet. Python is vast and profound, with a high degree of customization. There are many professional packages available for direct download and import. Well, it’s still very advanced, open-source, and user-friendly.Python displays as follows:
(renpy311) C:\Users\renji>cd C:\Users\renji\Desktop\Earthquake Engineering Exchange and Sharing 2025\250925 Epicenter Distribution Map
(renpy311) C:\Users\renji\Desktop\Earthquake Engineering Exchange and Sharing 2025\250925 Epicenter Distribution Map>python 456.py
Sample: 0876-07-14 105.90°E 37.80°N M6.5
Sample: 1010-11-00 106.40°E 38.10°N M5.5
Sample: 1143-04-00 106.30°E 38.50°N M6.5
Successfully read 51 earthquake events (Magnitude range: 4.8-8.0)
Successfully loaded provincial boundaries: 42 features
Provincial boundary fields: [‘name’, ‘gb’, ‘geometry’]
Successfully loaded city boundaries: 388 features
City boundary fields: [‘name’, ‘gb’, ‘geometry’]
Successfully loaded county boundaries: 2898 features
County boundary fields: [‘name’, ‘gb’, ‘geometry’]
Successfully loaded rivers: 234 features
River fields: [‘OBJECTID’, ‘NAME’, ‘REMARK’, ‘Shape_Leng’, ‘Shape_Area’, ‘geometry’]
Provincial boundaries after clipping: 4 features
City boundaries after clipping: 12 features
County boundaries after clipping: 32 features
Rivers after clipping: 6 features
Successfully labeled 5 city names
Successfully labeled 23 county names
Map saved: earthquake_map_enhanced.png
Total number of events: 51
≥6.5 magnitude earthquakes: 8
Project site location: Longitude 106.5°, Latitude 38.5°
Statistics of earthquakes by magnitude:
4.7-5.0 magnitude: 3
5.0-6.0 magnitude: 33
6.0-7.0 magnitude: 11
7.0-8.0 magnitude: 3
8.0-9.0 magnitude: 1
Displayed boundary types: Provincial boundaries, City boundaries
≥6.5 magnitude earthquake information (sorted by occurrence time):
1 0876-07-14 105.90°E 37.80°N M6.5
2 1143-04-00 106.30°E 38.50°N M6.5
3 1477-05-13 106.30°E 38.50°N M6.5
4 1495-04-10 105.60°E 37.60°N M6.5
5 1561-07-25 106.20°E 37.50°N M7.2
6 1709-10-14 105.30°E 37.40°N M7.5
7 1739-01-03 106.50°E 38.90°N M8.0
8 1954-07-31 104.20°E 38.80°N M7.0
Python plotting as follows: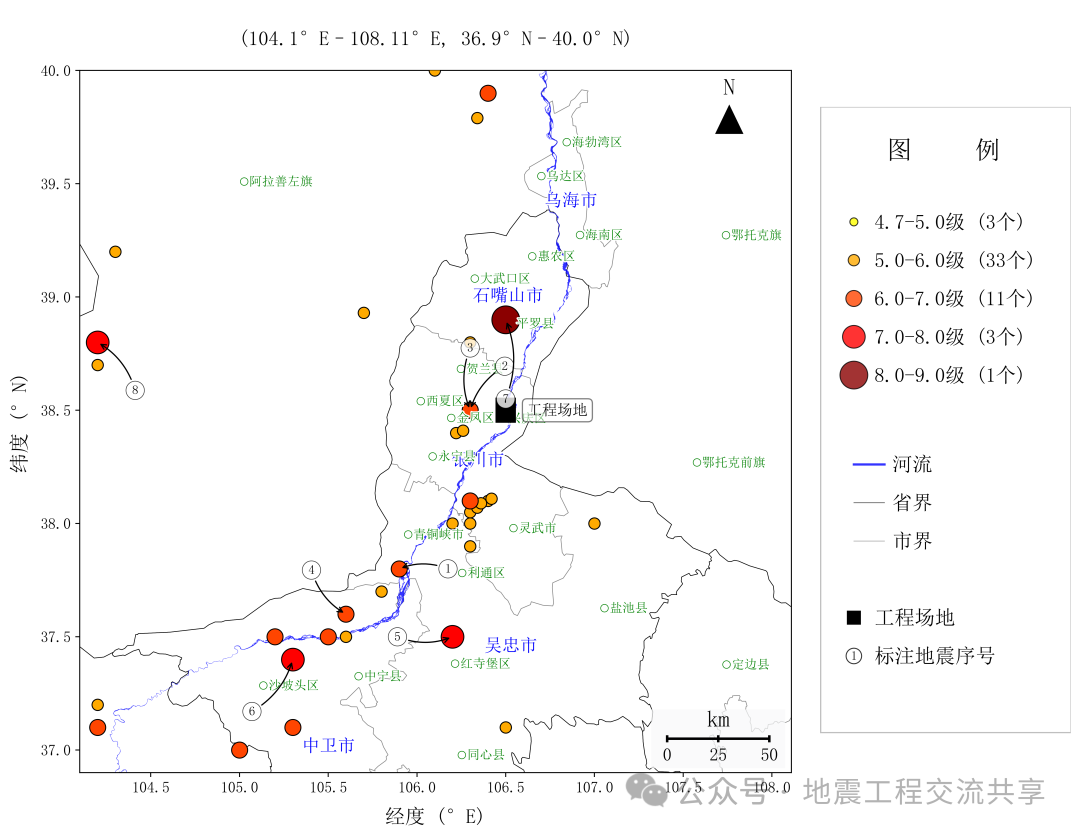 Python code is as follows:
# -*- coding: utf-8 -*-
import geopandas as gpd
import pandas as pd
import matplotlib.pyplot as plt
from shapely.geometry import box
import numpy as np
from matplotlib.patches import Polygon, Circle, Rectangle
from matplotlib.lines import Line2D
import matplotlib.patheffects as path_effects

# ---------- 1. Longitude and latitude range ----------
LON_MIN, LON_MAX = 104.10, 108.11
LAT_MIN, LAT_MAX = 36.90, 40.00
BBOX = (LON_MIN, LAT_MIN, LON_MAX, LAT_MAX)

# ---------- 2. Earthquake magnitude size color ----------
MAGNITUDE_BINS = [
    (4.7, 5.0, 40, '#ffff00'),
    (5.0, 6.0, 80, '#ffaa00'),
    (6.0, 7.0, 160, '#ff4500'),
    (7.0, 8.0, 320, '#ff0000'),
    (8.0, 9.0, 480, '#8b0000')
]

LINE_STYLES = {
    'Provincial boundary': {'color': 'black', 'linewidth': 0.5, 'alpha': 0.8, 'linestyle': '-', 'edgecolor': 'black'},
    'City boundary': {'color': 'gray', 'linewidth': 0.5, 'alpha': 0.8, 'linestyle': '-', 'edgecolor': 'gray'},
    'County boundary': {'color': 'green', 'linewidth': 0.5, 'alpha': 0.5, 'linestyle': '-', 'edgecolor': 'green'},
    'River': {'color': 'blue', 'linewidth': 1.8, 'alpha': 0.8}
}

# ---------- 3. Optional display settings ----------
SHOW_BOUNDARIES = {
    'Provincial boundary': True,
    'City boundary': True,
    #'County boundary': True,   # Uncomment to show county boundaries
}

# Project site longitude and latitude range
PROJECT_SITE = {
    'lon': 106.5,
    'lat': 38.5,
    'width': 0.1,
    'height': 0.1
}

# ---------- 4. EQT fixed column slicing ----------
def parse_eqt_line(line):
    line = line.rstrip()
    if len(line) < 36:
        return None
    try:
        year = int(line[0:5])
        month = int(line[5:7])
        day = int(line[7:9])
        lat = float(line[16:21])
        lon = float(line[22:28])
        mag = float(line[28:31])
        return [lon, lat, mag, year, month, day]
    except ValueError:
        return None

# ---------- 5. Read EQT ----------
def read_eqt_file(fn):
    data = []
    with open(fn, encoding='utf-8') as f:
        for i, l in enumerate(f, 1):
            l = l.rstrip()
            if not l or l.startswith('#'):
                continue
            p = parse_eqt_line(l)
            if not p:
                continue
            lon, lat, mag, y, m, d = p
            if (LON_MIN <= lon <= LON_MAX) and (LAT_MIN <= lat <= LAT_MAX) and mag >= 0:
                data.append([lon, lat, mag, y, m, d])
                if i <= 3:
                    print(f'Sample: {y:04d}-{m:02d}-{d:02d} {lon:.2f}°E {lat:.2f}°N M{mag:.1f}')

    if not data:
        raise SystemExit('No valid earthquake data read')

    df = pd.DataFrame(data, columns=['Longitude', 'Latitude', 'Magnitude', 'Year', 'Month', 'Day']).sort_values('Year')
    print(f'Successfully read {len(df)} earthquake events (Magnitude range: {df["Magnitude"].min():.1f}-{df["Magnitude"].max():.1f})')
    return df

eq = read_eqt_file('4710newnew.EQT')

# ---------- 6. Count earthquakes by magnitude ----------
def count_earthquakes_by_magnitude(df, magnitude_bins):
    counts = {}
    for m_min, m_max, _, _ in magnitude_bins:
        mask = (df['Magnitude'] >= m_min) & (df['Magnitude'] < m_max)
        count = len(df[mask])
        if m_max >= 9:
            label = f'{m_min:.1f}-{m_max:.1f} magnitude ({count} events)'
        else:
            label = f'{m_min:.1f}-{m_max:.1f} magnitude ({count} events)'
        counts[(m_min, m_max)] = (count, label)
    return counts

magnitude_counts = count_earthquakes_by_magnitude(eq, MAGNITUDE_BINS)

# ---------- 7. Read GeoJSON ----------
def load_gj(fp, name):
    try:
        g = gpd.read_file(fp)
        print(f'Successfully loaded {name}: {len(g)} features')
        # Debug: Print field names
        if not g.empty:
            print(f'  {name} fields: {list(g.columns)}')
        return g
    except Exception as e:
        print(f'Warning: Unable to load {fp}: {e}')
        return gpd.GeoDataFrame()

prov = load_gj('China_Province.geojson', 'Provincial boundaries')
city = load_gj('China_City.geojson', 'City boundaries')
county = load_gj('China_County.geojson', 'County boundaries')
river = load_gj('First_Level_River.geojson', 'Rivers')

# ---------- 8. Clip map ----------
bbox_geo = box(*BBOX)
def clip(gdf, name):
    if gdf.empty:
        return gdf
    try:
        c = gdf[gdf.intersects(bbox_geo)].copy()
        print(f'{name} after clipping: {len(c)} features')
        return c
    except Exception as e:
        print(f'Error clipping {name}: {e}')
        return gdf

prov_clip = clip(prov, 'Provincial boundaries')
city_clip = clip(city, 'City boundaries')
county_clip = clip(county, 'County boundaries')
river_clip = clip(river, 'Rivers')

# ---------- 9. Chinese settings ----------
plt.rcParams['font.family'] = 'sans-serif'
plt.rcParams['font.sans-serif'] = ['SimSun', 'Microsoft YaHei', 'SimHei', 'DejaVu Sans']
plt.rcParams['axes.unicode_minus'] = False
plt.rcParams['font.size'] = 12

# ---------- 10. Create figure ----------
fig, ax = plt.subplots(figsize=(14, 10))
fig.patch.set_facecolor('white')
ax.set_facecolor('white')

# ---------- 11. Draw base map features ----------
if not county_clip.empty and SHOW_BOUNDARIES.get('County boundary', False):
    county_clip.plot(ax=ax, facecolor='none',
                    edgecolor=LINE_STYLES['County boundary']['edgecolor'],
                    linewidth=LINE_STYLES['County boundary']['linewidth'],
                    linestyle=LINE_STYLES['County boundary'].get('linestyle', '-'),
                    alpha=LINE_STYLES['County boundary']['alpha'])

if not city_clip.empty and SHOW_BOUNDARIES.get('City boundary', False):
    city_clip.plot(ax=ax, facecolor='none',
                  edgecolor=LINE_STYLES['City boundary']['edgecolor'],
                  linewidth=LINE_STYLES['City boundary']['linewidth'],
                  linestyle=LINE_STYLES['City boundary'].get('linestyle', '-'),
                  alpha=LINE_STYLES['City boundary']['alpha'])

if not prov_clip.empty and SHOW_BOUNDARIES.get('Provincial boundary', False):
    prov_clip.plot(ax=ax, facecolor='none',
                  edgecolor=LINE_STYLES['Provincial boundary']['edgecolor'],
                  linewidth=LINE_STYLES['Provincial boundary']['linewidth'],
                  linestyle=LINE_STYLES['Provincial boundary'].get('linestyle', '-'),
                  alpha=LINE_STYLES['Provincial boundary']['alpha'])

if not river_clip.empty:
    river_clip.plot(ax=ax, color=LINE_STYLES['River']['color'],
                   linewidth=LINE_STYLES['River']['linewidth'],
                   alpha=LINE_STYLES['River']['alpha'])

# ---------- 12. Draw project site ----------
def add_project_site(ax, project_site):
    lon, lat = project_site['lon'], project_site['lat']
    width, height = project_site['width'], project_site['height']

    rect = Rectangle((lon - width/2.0, lat - height/2.0), width, height,
                    facecolor='black', edgecolor='black',
                    linewidth=2, alpha=1.0, zorder=6)
    ax.add_patch(rect)

    ax.text(lon + width/2 + 0.07, lat, 'Project Site',
            fontsize=12, fontweight='bold',
            ha='left', va='center',
            color='black', zorder=6,
            bbox=dict(boxstyle='round,pad=0.3', facecolor='white', alpha=0.5))

add_project_site(ax, PROJECT_SITE)

# ---------- 13. Draw earthquake points ----------
if not eq.empty:
    for m_min, m_max, size, color in MAGNITUDE_BINS:
        mask = (eq['Magnitude'] >= m_min) & (eq['Magnitude'] < m_max)
        if mask.any():
            ax.scatter(eq.loc[mask, 'Longitude'], eq.loc[mask, 'Latitude'],
                      s=size, color=color, alpha=1.0,
                      edgecolors='black', linewidth=0.8,
                      zorder=5)

# ---------- 14. ≥6.5 earthquake labeling ----------
major_quakes = eq[eq['Magnitude'] >= 6.5].sort_values(['Year', 'Month', 'Day']).reset_index(drop=True)

if not major_quakes.empty:
    n = len(major_quakes)
    base_radius = 0.25

    for idx, quake in major_quakes.iterrows():
        x0, y0 = quake['Longitude'], quake['Latitude']
        mag = quake['Magnitude']

        radius = base_radius * (1 + 0.2 * (mag - 6.0))
        angle = 2 * np.pi * idx / max(n, 1)
        x1 = x0 + radius * np.cos(angle)
        y1 = y0 + radius * np.sin(angle)

        ax.annotate(f'{idx + 1}',
                   xy=(x0, y0), xytext=(x1, y1),
                   ha='center', va='center',
                   fontsize=10, fontweight='bold',
                   bbox=dict(boxstyle='circle,pad=0.3',
                           facecolor='white', alpha=0.8,
                           edgecolor='black', linewidth=0.5),
                   arrowprops=dict(arrowstyle='->',
                                 color='black', lw=1.0,
                                 connectionstyle="arc3,rad=0.2"),
                   zorder=10)

# ---------- 15. Place name labeling ----------
def add_place_names(gdf, ax, fontsize, color, priority_fields, level='city'):
    if gdf.empty:
        print(f"Warning: {level} data is empty")
        return

    count = 0
    for _, row in gdf.iterrows():
        name = None
        for field in priority_fields:
            if field in row and pd.notna(row[field]):
                name = str(row[field])
                break
        if not name:
            continue;

        try:
            centroid = row.geometry.centroid
            if bbox_geo.contains(centroid):
                x, y = centroid.x, centroid.y;

                if level == 'county':
                    # Draw circle first
                    ax.plot(x, y, 'o', markersize=6,
                            markerfacecolor='none', markeredgecolor='green',
                            markeredgewidth=0.5, zorder=4)
                    # Move text to the right
                    text_x, text_y = x + 0.03, y;
                    ha, va = 'left', 'center';
                else:
                    text_x, text_y = x, y;
                    ha, va = 'center', 'center';

                text = ax.text(text_x, text_y, name,
                             fontsize=fontsize, color=color,
                             ha=ha, va=va, zorder=5,
                             bbox=dict(boxstyle='round,pad=0.3',
                                     facecolor='none', alpha=0.8 if level == 'county' else 0.0,
                                     edgecolor='none', linewidth=0.5))
                text.set_path_effects([path_effects.withStroke(linewidth=2, foreground='white')])
                count += 1;
        except Exception as e:
            print(f"Error labeling {name}: {e}")
            continue;

    print(f"Successfully labeled {count} {level} names")

# Try possible field names
city_fields = ['name', 'NAME', '名称', '市', 'city', 'CITY']
county_fields = ['name', 'NAME', '名称', '县', 'county', 'COUNTY', '区', 'QU']

add_place_names(city_clip, ax, 14, 'blue', city_fields, 'city')
add_place_names(county_clip, ax, 10, 'green', county_fields, 'county')

# ---------- 16. North arrow ----------
def add_north_arrow(ax, x, y, size=0.10):
    triangle = np.array([
        [x, y + size],
        [x - size * 0.8, y - size * 0.3],
        [x + size * 0.8, y - size * 0.3]
    ])

    ax.add_patch(Polygon(triangle, facecolor='black', zorder=14))
    ax.text(x, y + size * 1.3, 'N',
            ha='center', va='bottom',
            fontsize=18, fontweight='bold',
            color='black', zorder=12)

north_x = LON_MAX - 0.35
north_y = LAT_MAX - 0.25
add_north_arrow(ax, north_x, north_y)

# ---------- 17. Scale bar ----------
def add_scale_bar(ax, x, y, length_km=50):
    center_lat = (LAT_MIN + LAT_MAX) / 2
    km_per_degree = 111.0 * np.cos(np.radians(center_lat))
    length_degree = length_km / km_per_degree;

    pad = 0.09;
    ax.add_patch(plt.Rectangle(
      (x - pad, y - 0.04 - pad),
      length_degree + 2 * pad,
      0.08 + 2 * pad,
      facecolor='#f8f9fa', alpha=0.7,
      edgecolor='none', zorder=11)
    )

    ax.plot([x, x + length_degree], [y, y], 'k-', lw=2, zorder=12);

    for km in [0, length_km // 2, length_km]:
        x_pos = x + (km / length_km) * length_degree;
        ax.plot([x_pos, x_pos], [y - 0.01, y + 0.01], 'k-', lw=2, zorder=12);
        ax.text(x_pos, y - 0.04, f'{km}', ha='center', va='top', fontsize=14, zorder=12);

    ax.text(x + length_degree / 2, y + 0.04, 'km', ha='center', va='bottom', fontsize=18, zorder=12);

scale_x = LON_MAX - 0.7
scale_y = LAT_MIN + 0.15
add_scale_bar(ax, scale_x, scale_y, 50);

# ---------- 18. External right legend ----------
def create_external_legend(ax, fig, magnitude_bins, magnitude_counts, line_styles, show_boundaries, project_site):
    legend_width = 0.2
    legend_ax = fig.add_axes([0.75, 0.14, legend_width, 0.7])
    legend_ax.set_facecolor('white')
    legend_ax.set_xlim(0, 1)
    legend_ax.set_ylim(0, 1)

    legend_ax.spines['top'].set_visible(False)
    legend_ax.spines['right'].set_visible(False)
    legend_ax.spines['bottom'].set_visible(False)
    legend_ax.spines['left'].set_visible(False)
    legend_ax.set_xticks([])
    legend_ax.set_yticks([])

    legend_ax.text(0.5, 0.95, 'Legend',
                  fontsize=20, fontweight='bold',
                  ha='center', va='top',
                  transform=legend_ax.transAxes)

    magnitude_items = []
    y_pos = 0.82
    for i, (m_min, m_max, size, color) in enumerate(magnitude_bins):
        count, label = magnitude_counts.get((m_min, m_max), (0, f'{m_min:.1f}-{m_max:.1f} magnitude (0 events)'))
        magnitude_items.append((0.15, y_pos - i*0.06, size, color, label))

    for x, y, size, color, label in magnitude_items:
        legend_ax.scatter(x, y, s=size, color=color, alpha=0.8,
                         edgecolors='black', linewidth=0.8,
                         transform=legend_ax.transAxes)
        legend_ax.text(x + 0.08, y, label,
                      fontsize=16, va='center', ha='left',
                      transform=legend_ax.transAxes)

    line_items_config = []
    current_y = 0.44

    line_items_config.append(('River', current_y))
    current_y -= 0.06

    for boundary_type in ['Provincial boundary', 'City boundary', 'County boundary']:
        if show_boundaries.get(boundary_type, False):
            line_items_config.append((boundary_type, current_y))
            current_y -= 0.06

    for line_type, y_pos in line_items_config:
        style = line_styles[line_type]
        x = 0.15;

        if line_type == 'County boundary':
            legend_ax.plot([x, x + 0.12], [y_pos, y_pos],
                          linestyle='-', color=style['edgecolor'],
                          linewidth=style['linewidth'],
                          alpha=style['alpha'],
                          transform=legend_ax.transAxes)
        elif line_type == 'River':
            legend_ax.plot([x, x + 0.12], [y_pos, y_pos],
                          linestyle='-', color=style['color'],
                          linewidth=style['linewidth'],
                          alpha=style['alpha'],
                          transform=legend_ax.transAxes)
        else:
            legend_ax.plot([x, x + 0.12], [y_pos, y_pos],
                          linestyle='-', color=style['edgecolor'],
                          linewidth=style['linewidth'],
                          alpha=style['alpha'],
                          transform=legend_ax.transAxes)

        legend_ax.text(x + 0.15, y_pos, line_type,
                      fontsize=16, va='center', ha='left',
                      transform=legend_ax.transAxes)

    legend_y = current_y - 0.06
    legend_ax.add_patch(Rectangle((0.125, legend_y - 0.01), 0.05, 0.02,
                                facecolor='black', edgecolor='black',
                                transform=legend_ax.transAxes, zorder=5))
    legend_ax.text(0.15 + 0.08, legend_y, 'Project Site',
                  fontsize=16, va='center', ha='left',
                  transform=legend_ax.transAxes)

    legend_y -= 0.06
    legend_ax.scatter(0.15, legend_y, s=150, color='white', alpha=0.8,
                     edgecolors='black', linewidth=0.8,
                     transform=legend_ax.transAxes)
    legend_ax.text(0.15, legend_y, '1', fontsize=10, fontweight='bold',
                  ha='center', va='center',
                  transform=legend_ax.transAxes)
    legend_ax.text(0.15 + 0.08, legend_y, 'Labeled Earthquake Number',
                  fontsize=16, va='center', ha='left',
                  transform=legend_ax.transAxes)

    legend_ax.add_patch(plt.Rectangle((0.02, 0.02), 0.98, 0.98,
                                     transform=legend_ax.transAxes,
                                     fill=False, edgecolor='gray',
                                     linewidth=1, alpha=0.5))

    return legend_ax

legend_ax = create_external_legend(ax, fig, MAGNITUDE_BINS, magnitude_counts, LINE_STYLES, SHOW_BOUNDARIES, PROJECT_SITE)

# ---------- 19. Map output ----------
ax.set_xlim(LON_MIN, LON_MAX)
ax.set_ylim(LAT_MIN, LAT_MAX)

ax.set_xlabel('Longitude (°E)', fontsize=16, labelpad=10)
ax.set_ylabel('Latitude (°N)', fontsize=16, labelpad=10)

ax.set_title('\n('
            f'{LON_MIN}°E–{LON_MAX}°E, {LAT_MIN}°N–{LAT_MAX}°N)',
            fontsize=16, pad=20, fontweight='bold')

ax.set_facecolor('white')
fig.patch.set_facecolor('white')

plt.subplots_adjust(right=0.78)

output_file = 'earthquake_map_enhanced.png'
plt.savefig(output_file, dpi=500, bbox_inches='tight',
            facecolor='white', edgecolor='none')

print(f'Map saved: {output_file}')
print(f'Total number of events: {len(eq)}')
print(f'≥6.5 magnitude earthquakes: {len(major_quakes)} events')
print(f'Project site location: Longitude {PROJECT_SITE["lon"]}°, Latitude {PROJECT_SITE["lat"]}°')

print('\nStatistics of earthquakes by magnitude:')
for (m_min, m_max), (count, label) in magnitude_counts.items():
    print(f'  {m_min:.1f}-{m_max:.1f} magnitude: {count} events')

enabled_boundaries = [k for k, v in SHOW_BOUNDARIES.items() if v]
print(f'\nDisplayed boundary types: {", ".join(enabled_boundaries)}')

plt.show()

# ---------- 20. Print ≥6.5 magnitude earthquake details ----------
if not major_quakes.empty:
    print('\n≥6.5 magnitude earthquake information (sorted by occurrence time):')
    fmt = '{idx:>2}  {y:04d}-{m:02d}-{d:02d}  {lon:6.2f}°E  {lat:5.2f}°N  M{mag:3.1f}'
    for idx, row in major_quakes.iterrows():
        print(fmt.format(idx=idx + 1,
                         y=int(row['Year']),
                         m=int(row['Month']),
                         d=int(row['Day']),
                         lon=row['Longitude'],
                         lat=row['Latitude'],
                         mag=row['Magnitude']))