Overview of Effects
Heart of Machine Learning Date: August 30, 2025
Safety Evaluation Scheme for Cast Iron Bathtub Production Process Based on Structural Entropy Weight and Cloud Model
1. Overview of Core Methods
-
Structural Entropy Weight Method:
-
Objective: To objectively determine the weights of various indicators in the evaluation system, avoiding the influence of subjective human factors.
-
Principle: Based on the concept of “entropy”. A higher entropy value indicates a greater degree of data dispersion for the indicator, meaning it has a larger impact on the overall evaluation result, thus a greater weight. The structural entropy weight method collects subjective opinions through expert questionnaires (typical ranking) and then converts them into objective weights through entropy calculations, combining subjective intent with objective data support.
Cloud Model:
-
Ex: The average value of cloud droplets distributed in the domain space, representing the center of the concept.
-
En: The ambiguity of the concept, representing the acceptable range of the domain.
-
He: The entropy of entropy, representing the degree of dispersion (randomness) of cloud droplets.
-
Objective: To qualitatively and quantitatively convert and comprehensively evaluate safety conditions, addressing the fuzziness (uncertainty of qualitative concepts) and randomness (uncertainty of membership) in the evaluation.
-
Principle: Characterizes a qualitative concept by three numerical features: Expectation (Ex), Entropy (En), and Hyper-Entropy (He).
-
Role in Evaluation: Establishes standard cloud models for each safety level (e.g., “Safe”, “Relatively Safe”, “Average”, “Relatively Dangerous”, “Dangerous”) and maps the indicator data of the object to be evaluated onto these standard clouds through the Inverse Cloud Generator or Certainty Calculation, ultimately determining its safety level.
2. Construction of Evaluation Indicator System
This is the foundation of the evaluation. Based on the production process of cast iron bathtubs (mainly including: melting, pouring, forming, cleaning, polishing, painting, etc.), combined with the five dimensions of “people, machines, materials, methods, and environment”, a multi-level safety evaluation indicator system is constructed.
-
Goal Level (A): Safety level of cast iron bathtub production process (A)
-
Criterion Level (B): (Example)
-
B1 Human Factors (Training, Operating Standards, Wearing of Protective Equipment, etc.)
-
B2 Equipment and Facility Factors (Safety of Melting Furnaces, Molds, Lifting Equipment, Ventilation and Dust Removal Systems, etc.)
-
B3 Material and Management Factors (Management of Raw Materials such as Pig Iron and Coke, Safety Regulations, Emergency Plans, etc.)
-
B4 Process Method Factors (Melting Temperature, Pouring Speed, Spraying Process Parameters, etc.)
-
B5 Environmental Factors (Temperature of Workplaces, Dust Concentration, Noise Levels, etc.)
-
Indicator Level (C): Design specific, measurable indicators for each criterion level.
-
C11: Rate of Certified Special Operators (%)
-
C12: Employee Safety Training Pass Rate (%)
-
C21: Melting Furnace Temperature Alarm System Integrity Rate (%)
-
C22: Lifting Equipment Regular Inspection Pass Rate (%)
-
C31: Dust Concentration in Workshop (mg/m³)
-
C32: Noise Level in Workplaces (dB(A))
-
C41: Pouring Area Ground Leakage Prevention and Drying Condition (Qualitative, can be quantified through expert scoring)
-
C42: Volatile Organic Compound Concentration in Coating Operations (ppm)
-
… (can be expanded based on actual conditions)
3. Implementation Steps
Step 1: Data Collection and Processing
-
Collect data for each indicator in the indicator level (C) through on-site testing, sensor data, archival records, expert scoring questionnaires, etc.
-
Normalize quantitative indicators (e.g., dust concentration) to unify them within the [0,1] range. Different normalization formulas are used for cost-type indicators (the smaller the better, such as dust concentration) and benefit-type indicators (the larger the better, such as pass rates).
-
For qualitative indicators (e.g., completeness of management systems), use expert scoring methods (e.g., 1-10 points) for quantification, then normalize.
Step 2: Calculate Indicator Weights Based on Structural Entropy Weight Method
-
Expert Typical Ranking: Invite m safety experts to rank the importance of indicators at the same level (for example, under criterion B1, C11 is considered more important than C12).
-
Form the “Typical Ranking” Matrix: Collect all experts’ ranking opinions.
-
Calculate the “Average Recognition Degree”: Convert rankings into corresponding scores (e.g., 1st place gets n points, 2nd place gets n-1 points…), and calculate the average score for each indicator.
-
Calculate the “Fuzziness of Recognition”: This is the entropy value. The more dispersed the average scores, the larger the entropy value.
-
Calculate the “Essential Recognition Degree”: Normalize the average recognition degree to eliminate fuzziness.
-
Calculate Weights: Normalize the essential recognition degree to obtain the objective weights W_i for each indicator.
Step 3: Establish Safety Level Standard Cloud Model
-
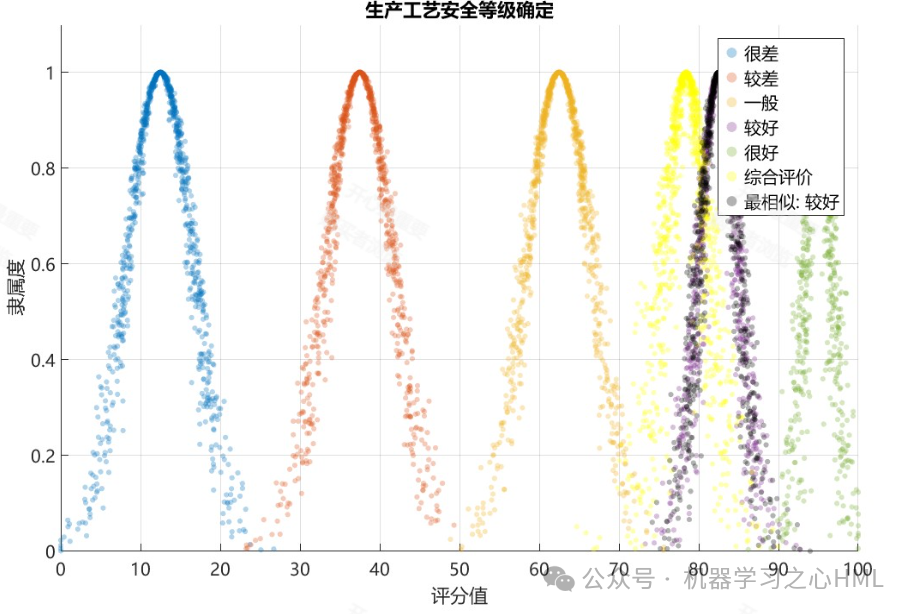
Divide safety conditions into five levels: Level I (Safe), Level II (Relatively Safe), Level III (Average), Level IV (Relatively Dangerous), Level V (Dangerous).
-
Determine the domain range, usually [0,1] (corresponding to normalized data).
-
Use the Golden Section Method to generate the standard cloud numerical features (Ex, En, He) for each level. Assuming the domain is [Xmin, Xmax] = [0,1]:
-
Level I (Safe) Cloud:
<span>Ex1 = 1.0</span>,<span>En1 = 0.0615</span>,<span>He1 = 0.01</span>(usually set He to one-tenth to one-fifth of En) -
Level II (Relatively Safe) Cloud:
<span>Ex2 = 0.691</span>,<span>En2 = 0.038</span>,<span>He2 = 0.006</span> -
Level III (Average) Cloud:
<span>Ex3 = 0.5</span>,<span>En3 = 0.023</span>,<span>He3 = 0.004</span> -
Level IV (Relatively Dangerous) Cloud:
<span>Ex4 = 0.309</span>,<span>En4 = 0.038</span>,<span>He4 = 0.006</span> -
Level V (Dangerous) Cloud:
<span>Ex5 = 0.0</span>,<span>En5 = 0.0615</span>,<span>He5 = 0.01</span>
Step 4: Calculate Comprehensive Evaluation Cloud and Determine Safety Level
-
Generate Evaluation Cloud for Each Indicator: For each indicator C_i’s measured value x_i, treat it as a cloud droplet. Through the Inverse Cloud Generator, a cloud model feature (Ex_i, En_i, He_i) can be calculated from a set of x_i. Alternatively, a simpler method is to directly calculate the certainty μ_k(x_i) of the measured value x_i belonging to each standard cloud.
-
<span>μ_k(x_i) = exp(-(x_i - Ex_k)^2 / (2 * (En_k')^2))</span>, where<span>En_k'</span>is a normal random number with<span>En_k</span>as the mean and<span>He_k</span>as the standard deviation.
Comprehensive Calculation:
-
<span>μ_k = sum(W_i * μ_k(x_i))</span>
-
<span>Ex_total = sum(W_i * Ex_i)</span> -
<span>En_total = sum(W_i * En_i)</span> -
<span>He_total = sum(W_i * He_i)</span>
-
Scheme A (Comprehensive Cloud Algorithm): Integrate the cloud model features (Ex_i, En_i, He_i) of each indicator according to their weights W_i to calculate the overall comprehensive evaluation cloud numerical features (Ex_total, En_total, He_total).
-
Scheme B (Certainty Weighted Method): First calculate each indicator x_i’s certainty μ_k(x_i) for each standard level k, then perform a weighted average to obtain the overall certainty μ_k for each level k.
Determine Final Safety Level:
-
Scheme A: Compare the generated comprehensive cloud (Ex_total, En_total, He_total) with the standard clouds to see which standard cloud’s center Ex it is closest to, determining the level of the “Cloud Center of Gravity“.
-
Scheme B: Compare the comprehensive certainty μ_k, following the “Maximum Certainty Principle“, selecting the level with the highest μ_k value as the final safety evaluation level.
<span>Level = argmax(μ_k)</span>
4. Application Example (Simplified)
Assuming only the evaluation of “Environmental Factors (B5)” with two indicators: Dust Concentration C31 (weight 0.6) and Noise Level C32 (weight 0.4).
-
Measured values: C31 normalized to 0.3 (high dust concentration), C32 normalized to 0.8 (good noise control).
-
Calculate the certainty of each indicator for the five standard levels (calculation process omitted, assume results as follows):
-
C31(0.3): For Level V μ=0.8, for Level IV μ=0.4, for other levels μ≈0.
-
C32(0.8): For Level II μ=0.7, for Level I μ=0.5, for Level III μ=0.3.
-
Weighted calculation of total certainty:
-
μ_Ⅴ = 0.6*0.8 + 0.4*0 = 0.48
-
μ_Ⅳ = 0.6*0.4 + 0.4*0 = 0.24
-
μ_Ⅲ = 0.6*0 + 0.4*0.3 = 0.12
-
μ_Ⅱ = 0.6*0 + 0.4*0.7 = 0.28
-
μ_Ⅰ = 0.6*0 + 0.4*0.5 = 0.20
-
Result: μ_Ⅴ=0.48 is the maximum, thus the evaluation result for “Environmental Factors” is Level V (Dangerous). The main reason is the severe dust concentration exceeding standards, although noise control is good, the overall risk is extremely high.
5. Advantages and Value
-
Scientificity: Integrates subjective experience (expert ranking) and objective data (entropy weights, measured values), making weight distribution more reasonable.
-
Precision: The cloud model can handle both fuzziness and randomness simultaneously, reflecting the essential uncertainty of safety status more accurately than traditional fuzzy comprehensive evaluation methods, resulting in more precise evaluation results.
-
Intuitiveness: The final result can be a definite level or visualized through a cloud diagram, clearly presenting the overall distribution and stability of evaluation results.
-
Practicality: It can not only draw overall conclusions but also analyze weak links in process safety through the indicator level (e.g., dust concentration in this case), providing clear directions for targeted rectification.
6. Conclusion
Applying the structural entropy weight-cloud model to the safety evaluation of cast iron bathtub production processes represents an effective upgrade in methodology. It constructs a complete, scientific, and operable system from indicator construction, weight calculation to comprehensive evaluation, helping enterprises to more comprehensively and profoundly understand safety risks in the production process, achieving a shift from “post-event handling” to “pre-event warning”, and significantly enhancing safety management levels.
Code Access (Non-public, please do not abuse)