Follow us for free subscriptions to the latest avionics news.
✦
✦
Safety analysis is not only a primary means of enhancing safety in aircraft development but also an important compliance method for verifying whether design solutions meet airworthiness requirements during certification. Traditional safety analysis methods lag behind the design process of the system and are highly dependent on the technical skills and experience of analysts, which cannot meet the needs of developing complex systems in modern aircraft. This paper proposes a model-based safety analysis method for fly-by-wire control systems. Using Simulink, nominal and extended models of a typical fly-by-wire control system are constructed, and a fault impact analysis method is proposed based on the system response after single fault injection to support the development of failure modes and effects analysis (FMEA). The method implements combinatorial fault injection based on state traversal and proposes a fault tree minimal cut set analysis method using the system response after combinatorial fault injection. Finally, an engineering case is presented to illustrate the correctness and effectiveness of the proposed method. Compared with classical Markov analysis methods, this approach avoids dependence on the experience of designers and offers higher accuracy; when system plans are modified, the method can directly update safety analysis results, avoiding the cumbersome work of remodelling and analysis.
The fly-by-wire (FBW) system of modern large civil aircraft is a highly integrated complex system composed of mechanical, electrical, electronic, and hydraulic components, which performs important functions such as flight attitude control, flutter suppression, pitch axis balancing, aircraft stabilization, and lift-drag control. The loss, failure, or non-commanded operation of functions such as flight attitude control and flutter suppression can significantly impact the safety of the aircraft, crew, and passengers, leading to catastrophic failure consequences.
System safety analysis serves as a primary means of conducting safety design and improving the safety of aircraft systems during the development process, as well as an important method for compliance verification regarding the “Equipment, Systems, and Installations” clauses in the airworthiness standards for transport aircraft. Currently, safety analysis of civil aircraft systems mainly employs methods such as Functional Hazard Assessment (FHA), Failure Mode and Effect Analysis (FMEA), and Fault Tree Analysis (FTA). In traditional safety analysis processes, these methods are highly subjective and overly reliant on the engineering experience of analysts, making it easy to result in incomplete and inconsistent analysis outcomes when there are misunderstandings regarding the design solutions. Moreover, these methods have low automation levels and typically require analysts to complete them manually, making the aircraft system development process, which is constantly updated and iterated, exceedingly cumbersome.
Model-Based Safety Analysis (MBSA) is a theory or method that combines model-based development processes with safety analysis techniques to achieve automated or semi-automated safety analysis. In model-based development, various development activities (such as simulation, verification, and testing) are conducted on the system model. Based on this model, corresponding fault modes are automatically injected, and the fault impacts are analyzed according to the model’s response, determining the paths of fault propagation or the logical relationships between faults, thus enabling the automation of safety analysis. Additionally, the output of the safety analysis is automatically generated by the system model, avoiding reliance on the engineering experience of analysts.
Over the past 20 years, the MBSA method has become a hot topic in the field of system safety modeling and analysis. Currently, MBSA methods can be generally categorized into three types: architecture modeling methods, finite state machine methods, and dynamic modeling methods. Architecture modeling methods utilize architecture modeling languages such as UML, SysML, AADL, and AltaRica to establish formal models of systems, determining the logical relationships or fault propagation paths between faults at various levels of the system, thus automatically generating safety analysis tools such as fault trees and event trees. Finite state machine methods model systems by describing system states and the transitions between those states, using linear temporal logic or branching temporal logic to represent safety requirements, and employing model checking methods to verify whether safety requirements can be met. Typical finite state machine modeling methods include Petri nets, Stateflow, NuSMV, etc. Dynamic modeling methods utilize mathematical models such as differential equations, transfer functions, or state equations of objects to construct simulation models that reflect the dynamic characteristics of the system; typical dynamic modeling tools include Simulink, Modelica, etc.
For FBW systems, whether it’s the control laws of the flight control computer, the input-output models of sensors and actuators, or the flight dynamics model of the aircraft itself, they are all represented by differential equations, transfer functions, or state equations. These models and associated parameters can be obtained through wind tunnel tests, CFD simulations, and system identification methods. These models and associated parameters are also prerequisites for building iron bird test benches on the ground, and during the design process, the models and parameters will be revised based on the results of computer simulations, iron bird tests, and flight tests. This paper will utilize the mathematical model of the FBW system and use Simulink to construct the nominal model (i.e., fault-free model) and extended model (i.e., fault model) of the FBW system, proposing a fault impact analysis method based on the system response after single fault injection to support the development of FMEA. Combinatorial fault injection will be implemented based on state traversal, and an FTA method will be proposed based on the system response after combinatorial fault injection. According to the results of the safety analysis, design modifications can be made. This helps to obtain real-time insights into how changes to the system model and parameters impact system safety during the iterative development of the system, making safety analysis a part of the system development process and avoiding the issue of having “two separate processes” in safety analysis and system development.
Finally, an application case based on a lateral FBW system is presented.
Modeling of Fly-By-Wire Control Systems Based on Simulink
The formal model of the system is the foundation for conducting MBSA. This section focuses on a lateral control system of a certain FBW system, using Simulink tools to establish both the nominal model and the extended model of the system, implementing fault injection based on the extended model, monitoring the response of the simulation system under different fault modes, and analyzing the fault impacts. The nominal model can be constructed directly using Simulink modules, while the extended model requires integrating the Simulink model of component fault modes based on the nominal model.
1. A Certain Lateral FBW System
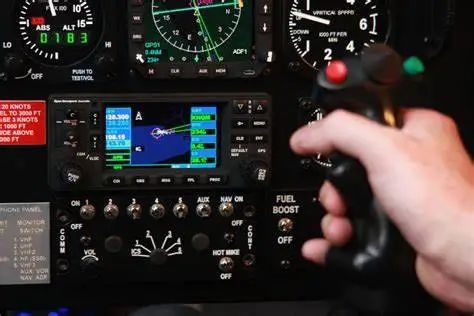
This FBW system’s lateral control system consists of a flight control computer subsystem, an actuator subsystem, a sensor subsystem, and control surfaces such as ailerons and rudders, enabling roll and yaw control of the aircraft, as shown in Figure 1.
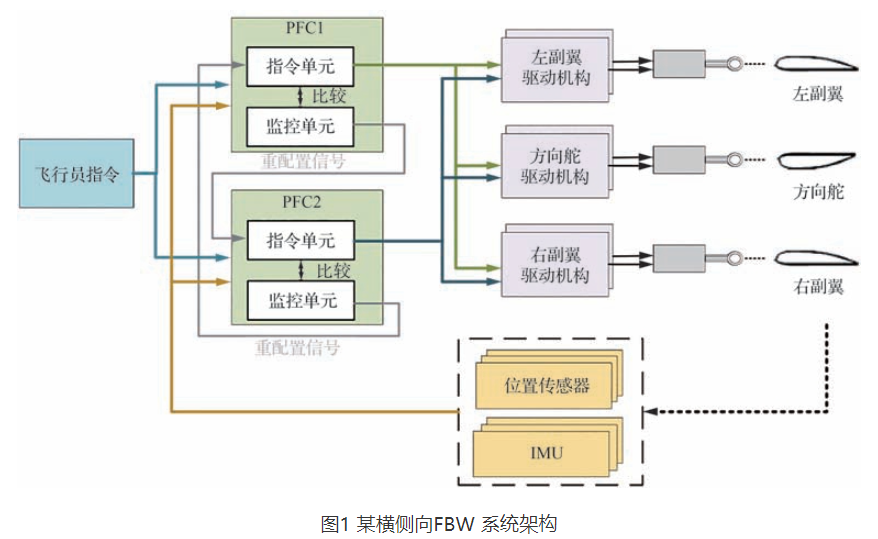
The flight control computer subsystem features a dual-redundancy architecture consisting of two identical primary flight computers (PFCs), each containing one command unit and one monitoring unit. The command unit calculates control laws and outputs control surface deflection commands based on input flight states and pilot instructions. The monitoring unit also computes the control laws, but its results are compared with those of the command unit. If the difference between the two exceeds a certain threshold, the monitoring unit suppresses the output of the control surface deflection command and sends fault information to the other PFC for reconfiguration of control commands.
The actuator subsystem consists of the left aileron actuation (LAA), right aileron actuation (RAA), and rudder actuation (RA). All actuators are designed with dual redundancy, and each actuator is connected to a synthesizer to combine the signals from the two actuators. The sensor subsystem includes three position sensors for the control surfaces and an inertial measurement unit (IMU), all of which are configured with triple redundancy.
2. Nominal Model of the Lateral FBW System
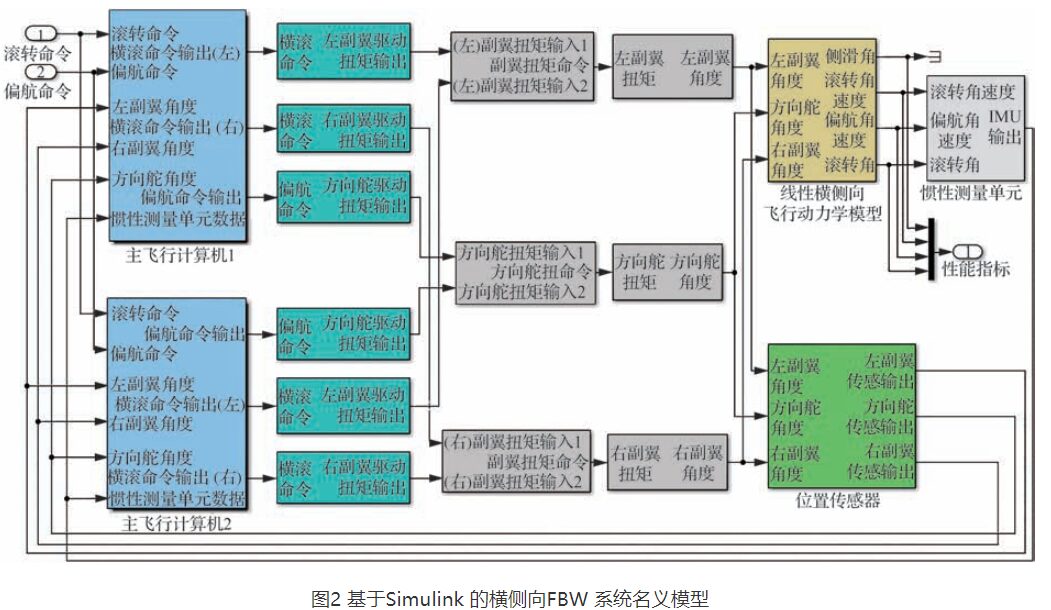
Literature [23] provides the mathematical models of each component of this lateral FBW system represented in forms such as differential equations, transfer functions, or state equations. Using the Simulink module library, corresponding models of components can be constructed, and the integrated component models constitute the nominal model of the FBW system, as shown in Figure 2.
3. Modeling and Injection of Component Fault Modes
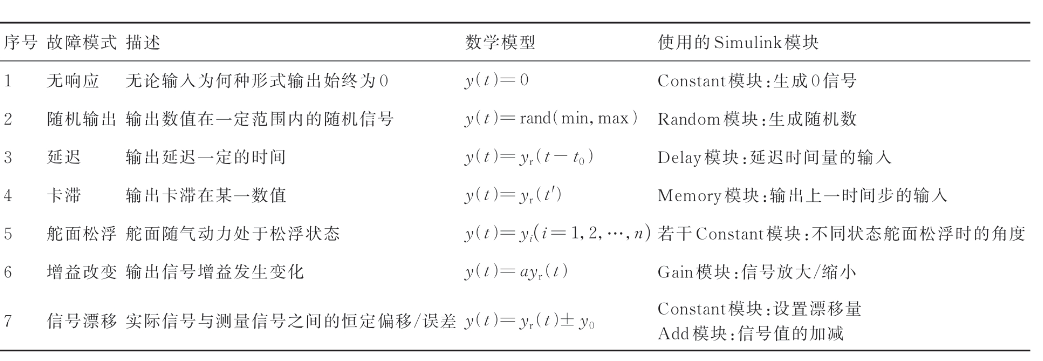
This lateral control system comprises seven fault modes: unresponsive, random output, delay, stagnation, control surface float, gain change, and signal drift. Using the Switch and related modules in Simulink, the component fault modes can be modeled. By controlling the signal ports, switching between normal and fault signals can be achieved. Table 1 provides descriptions, mathematical models, and the Simulink modules used for modeling each fault mode. In the table, y(t) represents the fault signal; yr(t) represents the input normal signal; min and max denote the lower and upper bounds for generating random numbers; t0 indicates the set delay time; yr(t′) represents the normal signal from the previous time step; yi represents the float angle of the i-th control surface during various flight states (including climb, cruise, descent); a indicates the set amplification or reduction factor; y0 represents the set signal offset.
Table 1: Common Fault Modes and Descriptions
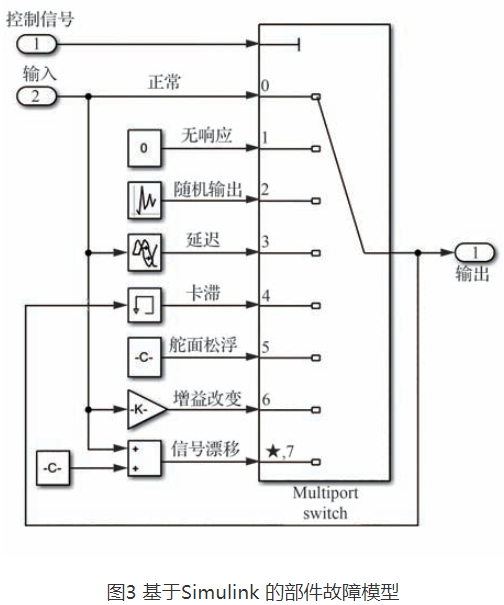
Assuming a component possesses the seven fault modes listed in Table 1, the fault model constructed using Simulink’s “Multiport Switch” module is shown in Figure 3. In Figure 3, the component has eight states, including the “normal” state and the seven fault states corresponding to the fault modes in Table 1; these eight states correspond to control signal values 0, 1, 2, 3, 4, 5, 6, and 7. By selecting the control signal values, different fault modes can be injected into the nominal model.
4. Extended Model of the Lateral Control System
The extended model of the components can be established by merging the fault-free model with the fault model. By connecting the extended models of all components, the extended model of the system can be constructed.
The serial numbers, names, and fault mode numbers of the 25 components of this FBW system are shown in Table 2, where the fault mode numbers correspond to the seven fault modes listed in Table 1.
Table 2: Fault Modes of Various Components
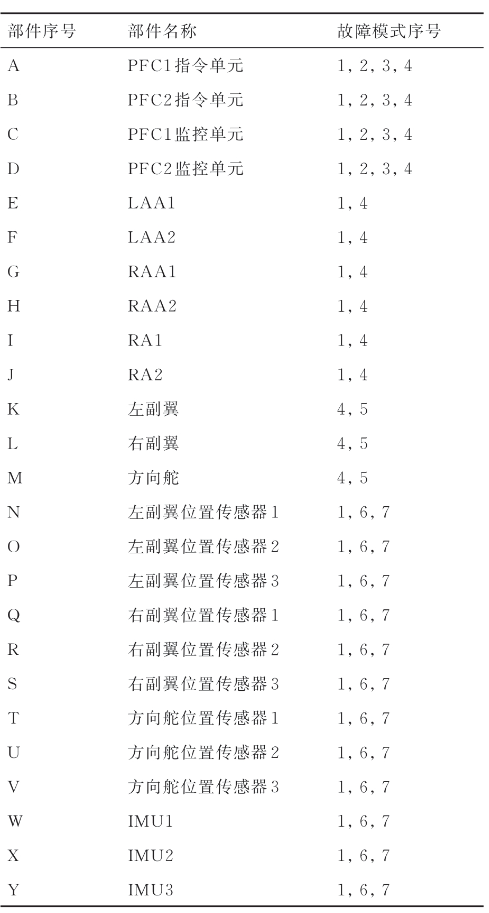
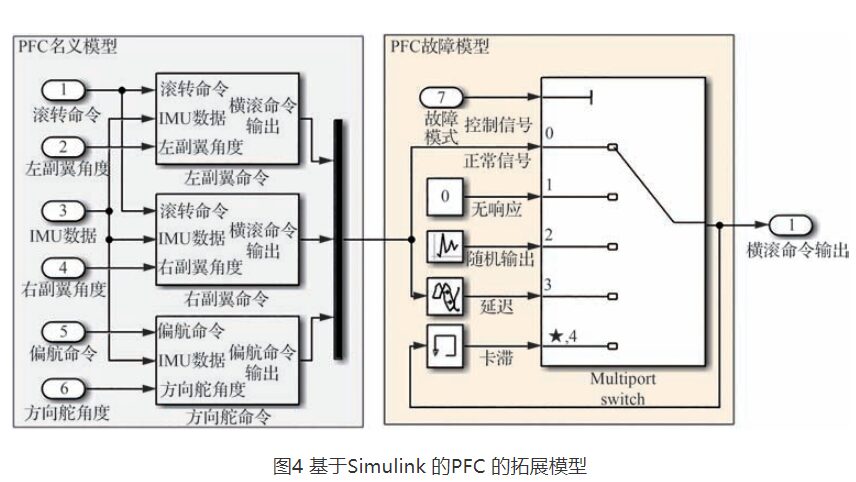
Figure 4 illustrates the extended model of a component, using the PFC as an example. The left side shows the nominal model of the PFC, while the right side presents the fault model of the PFC, which includes the “normal” state and four fault states: “unresponsive,” “random output,” “delay,” and “stagnation”; these five states correspond to control signal values 0, 1, 2, 3, and 4, respectively.
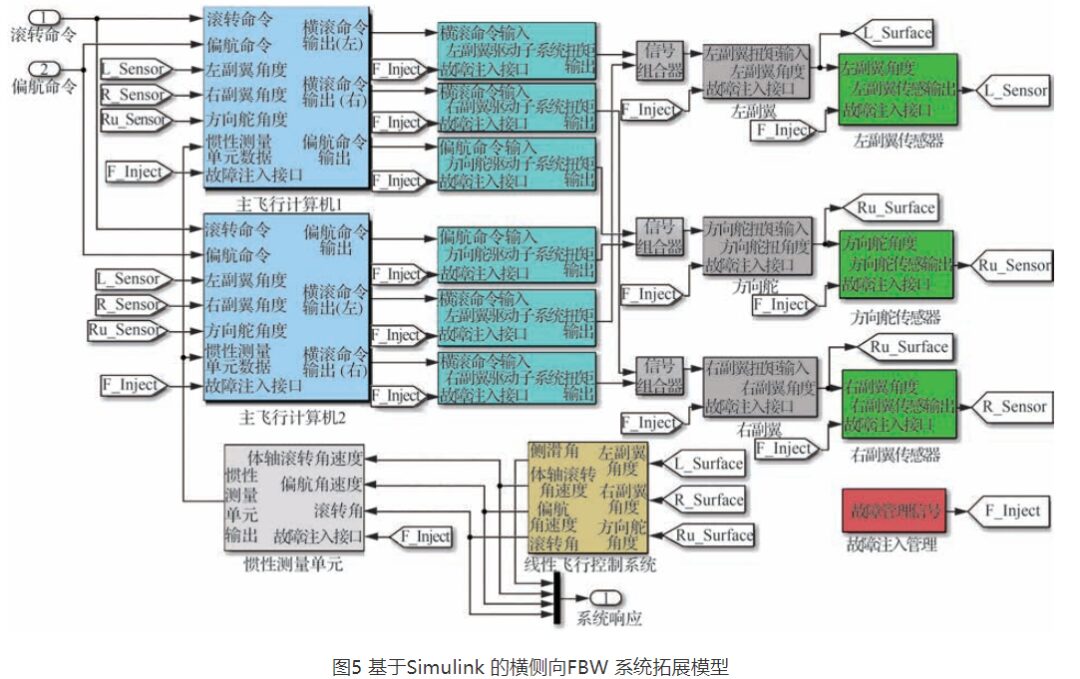
By constructing extended models for each component shown in Figure 2 and connecting them, the extended model of this lateral FBW system can be established, as shown in Figure 5.
Fault Impact Based on Single Fault Injection
In aircraft system safety analysis, FMEA is a safety analysis method that identifies all fault modes of components and analyzes their impacts on higher levels. FMEA is typically used to analyze the impact of a single fault mode on the aircraft or system, facilitating the identification of weak points in system design. Determining fault impacts is a crucial step in FMEA, and traditional FMEA methods mainly rely on the experience of analysts to identify fault impacts. This study will determine fault impacts based on the system performance response after fault injection.
1. System Performance Indicators and Thresholds
The occurrence of the top-level failure condition (Failure Condition, FC) determined by FHA is the primary basis for analyzing the “final impact” of fault modes. Performance indicators and thresholds are defined for each FC, and the system response after injecting faults is monitored. When the aircraft is in a safe state, the responses of performance indicators should remain within acceptable ranges; once the performance indicators exceed the thresholds, the top-level FC occurs.
The lateral FBW system shown in Figure 1 has top-level FCs as determined by FHA, including “loss of roll function leading to an unsafe flight path” and “roll oscillation leading to an unsafe flight path.”
The performance indicators for “loss of roll function leading to an unsafe flight path” are sideslip angle β, roll rate pr, yaw rate rr, and roll angle ϕ. Their performance requirements are defined as

Where: yi(t) is the i-th performance indicator; yir(t) is the reference value of the i-th performance indicator, indicating its value under fault-free conditions; ri is the threshold for the i-th performance indicator; the thresholds for β, pr, rr, and ϕ are set at 0.15 rad, 0.45 rad/s, 0.45 rad/s, and 0.15 rad, respectively.
The performance indicator for “roll oscillation leading to an unsafe flight path” is the roll angle ϕ, with the threshold defined as the frequency of passing through 0 rad within 20 seconds not exceeding 10 occurrences per second.
For the “local impact” or “higher-level impact” of faults, similar methods can be used to analyze based on the output responses of the respective levels of systems or subsystems. For example, to analyze the impact of the fault mode of the PFC1 command unit in Figure 5, the responses of the output parameters “left-right roll command output” and “yaw command output” of PFC1 after fault injection can be used for judgment.
2. Fault Impacts of Typical Fault Modes
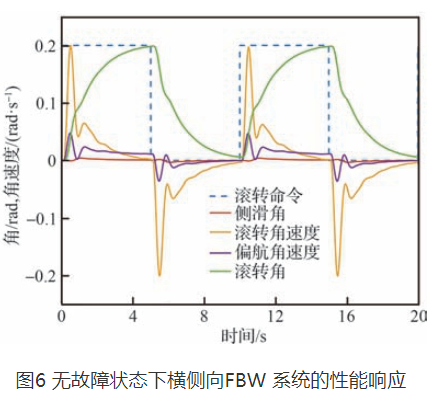
Taking the lateral FBW system shown in Figure 1 as an example, with an input roll command of 0.2 rad and a square wave of 0.1 Hz, the system’s response under normal conditions is shown in Figure 6.
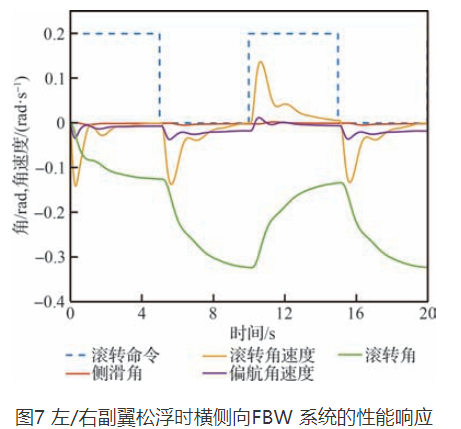
After injecting the “left/right aileron-control surface float” fault, the system’s performance response is shown in Figure 7. At this point, the roll angle ϕ significantly exceeds the specified threshold of 0.15 rad, indicating that the final impact of the “left/right aileron-control surface float” fault is “loss of roll function leading to an unsafe flight path.”
After injecting the “rudder-control surface float” fault, the system’s performance response is shown in Figure 8. At this point, the roll angle ϕ has exceeded the specified threshold of 0.15 rad, and a small oscillation has occurred; however, the oscillation frequency did not exceed the threshold (i.e., the number of occurrences exceeding 1 per second within 20 seconds is not more than 10). Therefore, it can be concluded that the final impact of the “rudder-control surface float” fault is only “loss of roll function leading to an unsafe flight path.”
Upon completing all single fault injections, it was found that none of the single faults would “lead to an unsafe flight path roll oscillation,” thus the top-level FC would not be triggered by single faults.
Fault Tree Based on Fault Traversal
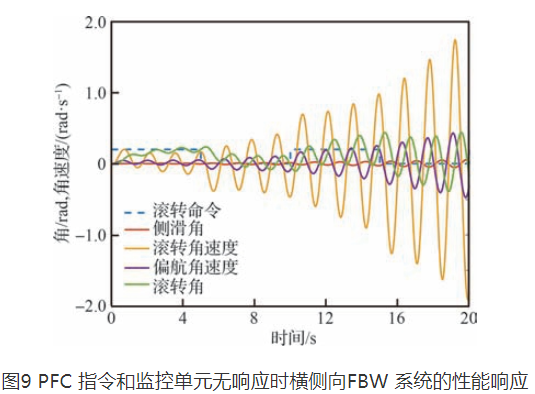
FTA is a combinatorial fault analysis method that can determine the combinations of fault causes leading to the top-level FC and calculate the probability of the top event occurring. Although FMEA cannot analyze the impacts of combinatorial faults, the previous analysis showed that while all single faults do not “lead to an unsafe flight path roll oscillation,” the simultaneous occurrence of the two fault modes “PFC command unit-unresponsive” and “PFC monitoring unit-unresponsive” will cause the FC to occur, as shown in Figure 9.
This section proposes a fault traversal-based FTA method, first using a recursive approach to obtain all fault combinations of the system; secondly, a reduction method for fault combinations is proposed to improve analysis efficiency; thirdly, fault combinations are injected into the nominal model through state traversal, and based on the system response, it is determined whether the top-level FC will occur, thus identifying whether the fault combination is a cut set; finally, the minimal cut set (MCS) can be used to calculate the probability of the response FC occurring. The proposed method utilizes the performance response of combinatorial faults to determine the MCS leading to the top-level FC, also avoiding reliance on the experience of analysts.
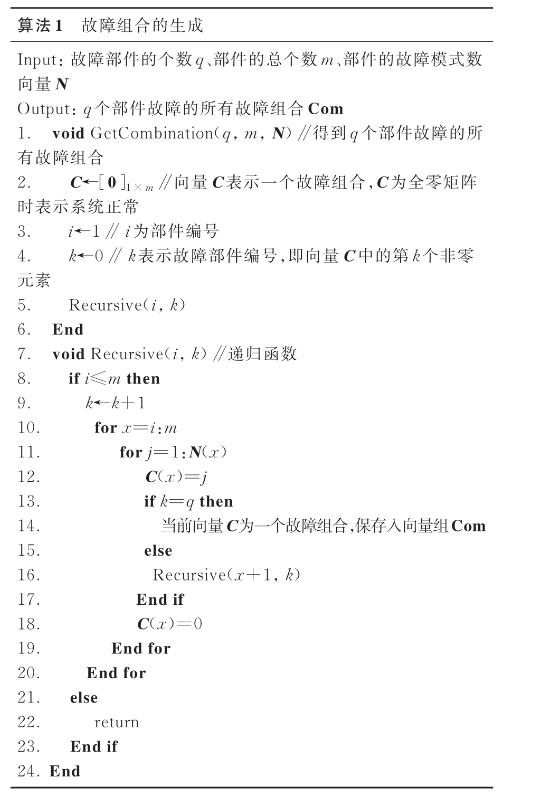
1. Determining Fault Combinations Based on Recursive Method
To use state traversal for fault injection, it is necessary first to obtain all fault combinations. Assuming the system consists of m components, the number of fault modes for each component is represented by the vector N:
Where: ni indicates the number of fault modes for the i-th component.
Each fault combination is represented by the vector C:
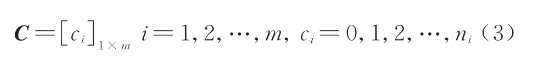
Where: ci=0 indicates no fault for the i-th component; ci=j (j=1, 2, …, ni) indicates the j-th fault mode of the i-th component occurs. Assuming a fault combination contains q (q=1, 2, …, m) components that have faults, the vector C will have q non-zero elements.
The pseudocode description of all fault combinations of q components obtained through the recursive method is shown in Algorithm 1.
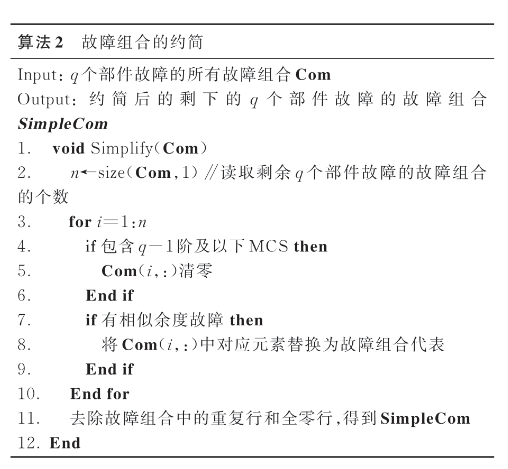
2. Reduction of Fault Combinations
To reduce the number of fault combinations that need to be traversed and improve the efficiency of safety analysis, the generated fault combinations can be reduced beforehand. There are two methods for reducing fault combinations:
1) If a subset of a certain fault combination is an MCS, that fault combination can be discarded and does not need to be injected. That is, when traversing the fault combinations of q elements, if a fault combination contains an MCS (of lower order than q), that fault combination need not be considered, as it has already been accounted for in previous iterations.
2) Using similarity redundancy, the faults of similar components in the redundancy architecture are not repeated in the fault combinations. When generating fault combinations, the redundancy of components is treated as several different components (such as PFCs, actuators, sensors), including single faults, multiple faults, etc. For non-similar redundancy, traversal can be directly performed; for similar redundancy, the responses to faults are also the same, so this part of the fault combinations can be reduced first. For example, this FBW’s PFC uses a 2×2 redundancy structure, employing two identical PFCs, each containing two similar branches, namely the command unit and the monitoring unit; two identical actuators are separately connected to the two PFCs (as shown in Figure 2). Since components A, B, C, and D are all similar command or monitoring units, the fault combinations associated with component combinations {A, E, G, I}, {C, E, G, I}, {B, F, H, J}, and {D, F, H, J} yield the same responses after fault injection, thus only one is retained as a representative, referred to as the fault combination representative. The pseudocode for reducing fault combinations is shown in Algorithm 2.
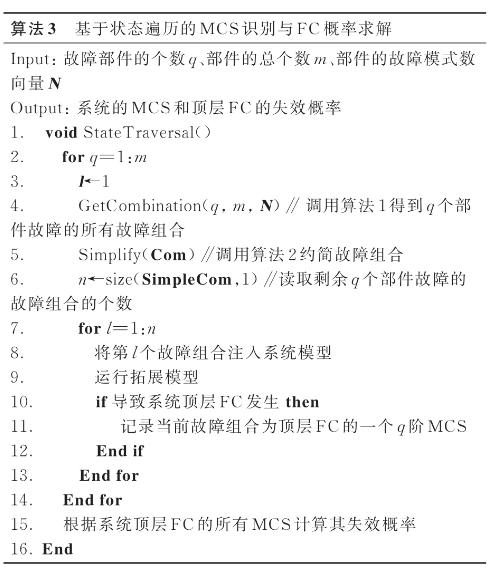
3. Safety Analysis Method Based on State Traversal
Injecting the reduced fault combinations into the system model and analyzing the system response can yield the MCS that leads to the occurrence of the top-level FC, thus determining the causes of system failure for improving system design. Furthermore, utilizing fault rate data from the fault modes, the probability of the top-level FC can be calculated based on the MCS.
The pseudocode for identifying the MCS and calculating the probability of the top-level FC based on state traversal is described in Algorithm 3.
Case Analysis and Discussion
This section provides examples of FMEA and FTA analysis based on the lateral FBW system shown in Figure 1.
1. FMEA Example Based on Single Fault Injection
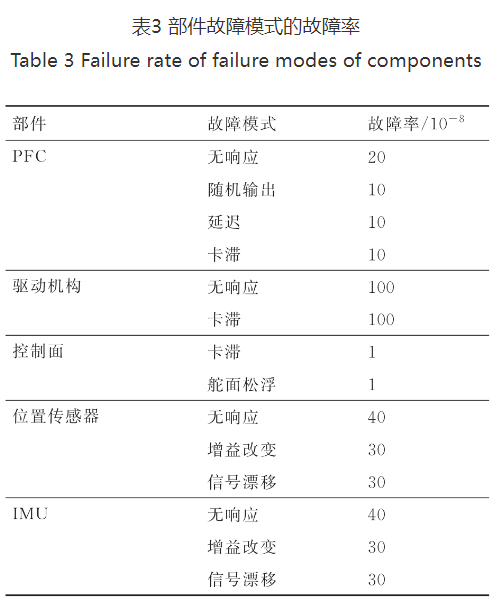
Considering the functions and composition characteristics of this lateral FBW system, it can be divided into four parts: the PFC subsystem, actuators, sensor subsystem, and control surfaces. Each subsystem consists of multiple components, and the fault modes of the components are shown in Table 2, while the fault rates of the components are detailed in Table 3, with the hierarchical decomposition diagram shown in Figure 10.
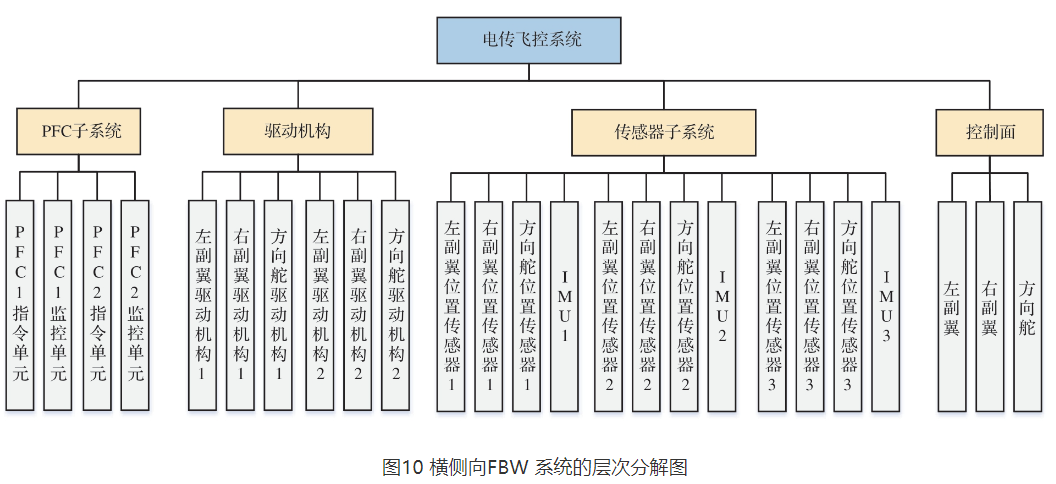
By analyzing the fault modes of each type of component, their impacts on the current level, higher subsystem levels, and the system level are determined, along with fault detection methods, thus completing the FMEA.
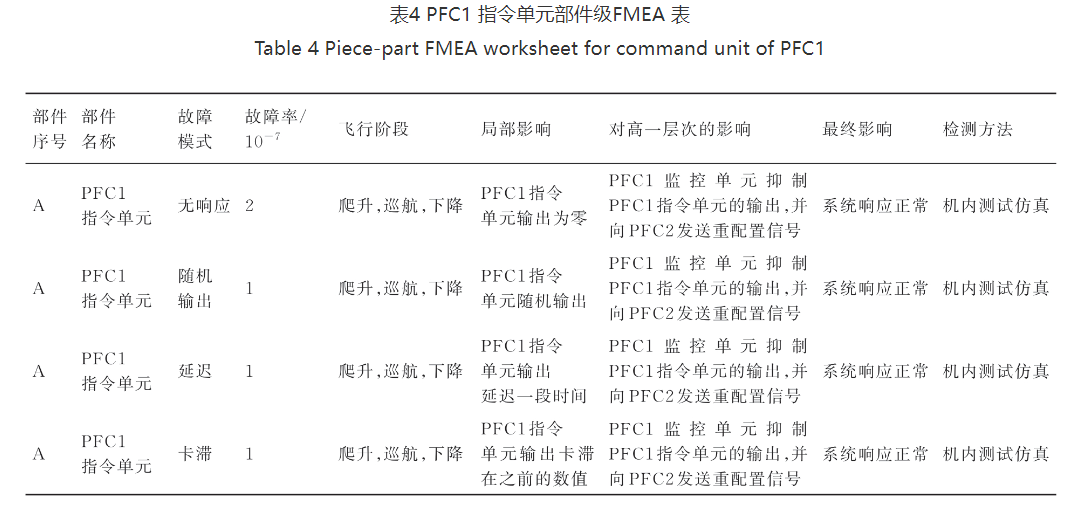
Taking the PFC1 command unit in the PFC subsystem as the analysis object, its function is to “acquire pilot commands and aircraft attitude information, calculate control laws, and instruct actuator actions.” By analyzing the four fault modes and their impacts of the PFC1 command unit, the resulting FMEA table is shown in Table 4.
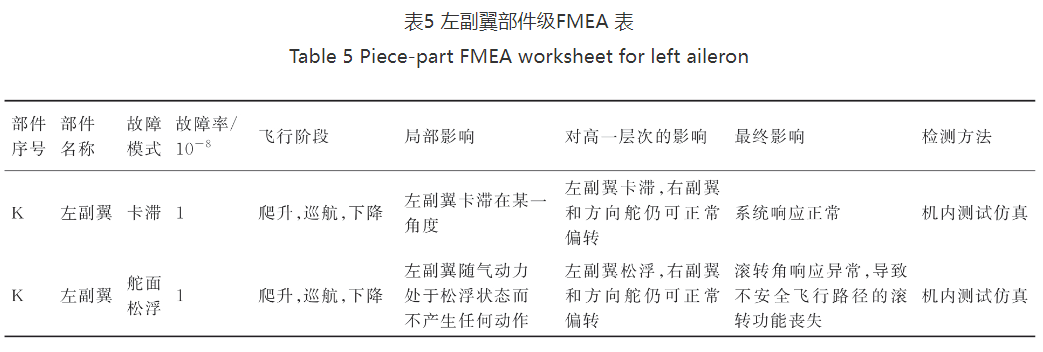
Taking the left aileron in the control surface subsystem as the analysis object, its function is to “provide roll control for the aircraft.” By analyzing the two fault modes and their impacts of the left aileron, the resulting FMEA table is shown in Table 5.
2. FTA Example Based on State Traversal
Using the state traversal method, a total of 3,293 MCSs are obtained for the top-level FC “loss of roll function leading to an unsafe flight path” of the lateral FBW system; after reducing equivalent MCSs, 215 remain, including 3 first-order, 42 second-order, 104 third-order, and 66 fourth-order and above.
The total number of MCSs for the top-level FC “roll oscillation leading to an unsafe flight path” is 1,128; after reducing equivalent MCSs, 109 remain, including 0 first-order, 6 second-order, 60 third-order, and 69 fourth-order and above.
When calculating the occurrence probability of the top event, the exposure time and fault rates of the basic events are needed. Since all components of this lateral FBW system are operational during the entire flight segment without latent faults, the exposure time for each basic event in the fault tree is taken as the average flight segment time. The fault rates for each component’s fault modes are shown in Table 3; assuming the average flight segment time for the aircraft is 10 hours, the occurrence probability of “loss of roll function leading to an unsafe flight path” during each flight segment time is calculated as 3.002661×10⁻⁷, and the occurrence probability per flight hour is 3.0027×10⁻⁸; for “roll oscillation leading to an unsafe flight path,” the occurrence probability during each flight segment time is 1.1406×10⁻¹⁰, and the occurrence probability per flight hour is 1.1406×10⁻¹¹.
3. Analysis and Verification
For this system, literature [26] proposed an approximate method using classical Markov analysis (MA) to obtain upper and lower limits for failure probability. The main steps for MA are: ① Inject fault modes, run the system’s extended model, determine the various states of the system (normal, failed), and draw the system’s state transition diagram; ② Based on the state transition diagram, construct the corresponding state transition matrix and the differential equations used to solve the state probabilities of the flight control system; ③ By solving the system of differential equations, the probabilities of the system being in each state at a given moment can be derived, thus calculating the system’s failure probability.
The MA model for the lateral FBW system’s “loss of roll function leading to an unsafe flight path” is shown in Figure 11.
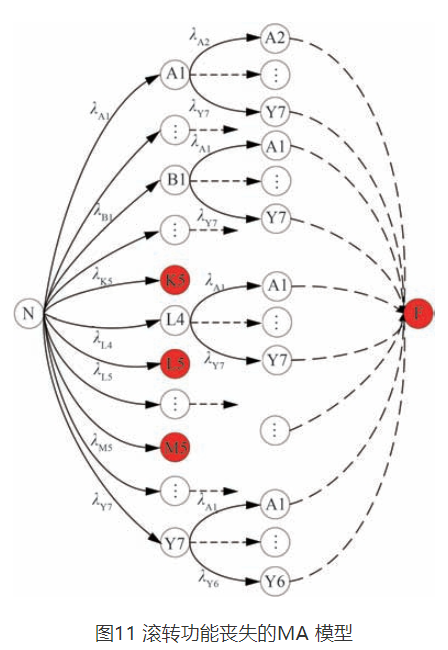
In Figure 11, the red circles represent the absorbing states of the system; circles labeled N represent the normal states of the system; circles labeled with letters and numbers represent intermediate states of the system. For example, the circle labeled A1 indicates that fault mode 1 of component A has occurred, with λA1 denoting the fault rate of component A’s fault mode 1. By solving the Fokker-Planck equation of the Markov process, the probability of the top-level FC occurring can be calculated.
To simplify the MA process, the MA model can be truncated to reduce the number of states; the number of states included in the truncated MA model will significantly decrease, depending on the truncation level. Figure 11 shows the state transition diagram of the MA model after a level 3 truncation, where, apart from the complete failure state T, other states with three or more faults will no longer be considered.
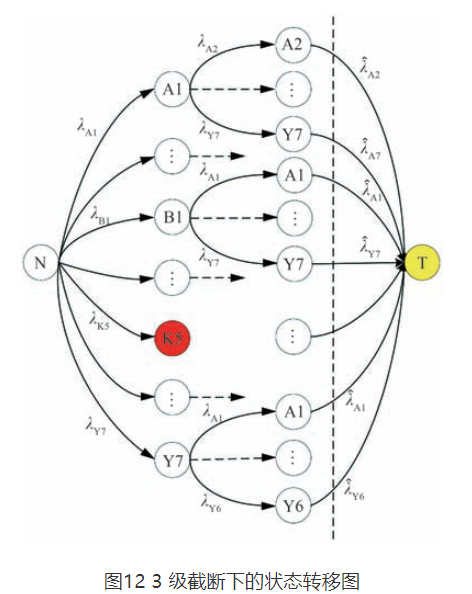
The corresponding fault rates in the truncated MA model can be obtained using the formula (4).
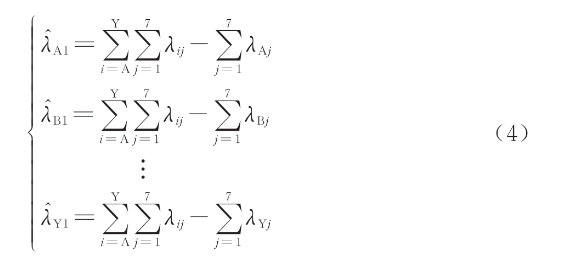
After truncating the MA model, it is not possible to obtain the MCS and precise probabilities of the top-level FC occurring, but upper and lower bounds for the probabilities of the top-level FC can be calculated. When the truncation level is set to 3, the upper and lower bounds for the occurrence probabilities of the two top-level FCs obtained through different methods are shown in Table 6.
Table 6: Occurrence Probabilities of Top-Level FCs Obtained by Different Methods
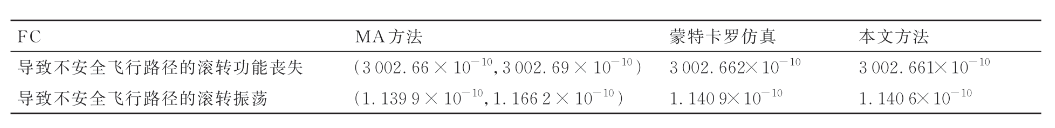
Moreover, the occurrence probabilities of failure states for this FBW system can also be approximately solved using the Monte Carlo simulation method. The specific method for Monte Carlo simulation is to represent the fault times of each component’s fault modes with random numbers, sort these numbers in ascending order, and inject the failure modes as they occur. When the response does not meet safety requirements, a simulation is terminated, yielding time samples under unsafe conditions. Based on several time samples, the probability distribution of the occurrence of unsafe conditions over time can be obtained. The probabilities of unsafe conditions occurring within the average flight segment time calculated through Monte Carlo simulation are shown in Table 6.
This indicates that the probabilities calculated using the methods in this paper fall between the upper and lower bounds obtained using the MA method, and are close to the results of the Monte Carlo simulation, demonstrating the accuracy of the proposed method.
Additionally, with changes in design, the MA model needs to be manually reconstructed, while the method in this paper can automatically update safety analysis results based on the modified system model, avoiding the cumbersome process of remodelling. Although the Monte Carlo simulation method saves analysis time, it is a stochastic method that cannot provide precise failure probabilities or identify the MCS of failure states.
Conclusion
This paper presents a safety analysis method for FBW systems based on Simulink. By injecting single faults and traversing fault combinations, automation of FMEA and FTA is achieved. Compared to traditional safety analysis methods, the proposed method has the following advantages:
1. A new MBSA method is proposed, establishing nominal and extended models of the FBW system based on Simulink, capable of automatically analyzing the fault impacts for FMEA, determining the MCS for FTA, and calculating the occurrence probabilities of the top-level FC.
2. The impacts of component faults or fault combinations on system safety are determined based on the system’s performance response after fault injection. Compared to traditional safety analysis methods, the determination of system failures is not reliant on the technical skills and experience of analysts, making it more objective.
3. When changes are made to the system design, the extended model can automatically update safety analysis results without the need to reconstruct the safety analysis model (such as FTA, MA, or dependency graph analysis), thus avoiding the cumbersome work of manually remodelling.
(The above article is sourced from the Journal of Aeronautics, authored by Zhuo Lu, Lu Zhong, Song Haijing, Dong Li, Wu Yuting, and Zhou Jia, affiliated with Nanjing University of Aeronautics and Astronautics, Civil Aviation College; China Flight Test Research Institute, Reliability Research Center; China Aviation Radio Electronics Research Institute, Civil Aircraft Systems Department; Eastern Airlines Jiangsu Co., Ltd. Aircraft Maintenance Department)

Add WeChat to receive industry materials for free and join the discussion group.